The Observable Market Paradox
In February 2026, financial markets present a peculiar phenomenon that challenges conventional investment wisdom. Equity indices advance. Mega-cap leaders thrive. Headlines signal resilience. Yet beneath this surface strength, corporate failures, delistings, and startup collapses accelerate at rates 18-34 percent above prior year levels.
This divergence is not a contradiction. It is a structural feature of modern markets. What we observe is a visibility distortion where surviving companies dominate index performance while failed firms quietly exit datasets. This phenomenon explains why markets appear strong even as economic attrition intensifies.
The Anthropic Effect in Finance represents one of the most underappreciated risks facing modern investors. Unlike volatility, inflation, or geopolitical uncertainty, it operates invisibly. It does not announce itself. Instead, it reshapes your understanding of how markets work by allowing you to observe only what survived.
What Is the Anthropic Effect in Finance?
The Anthropic Effect is a cognitive distortion created by observing only outcomes that survived to be observed. Failed companies disappear from market data. Collapsed funds vanish from records. Bankrupt institutions cease to exist in databases. You see only what survived.
During the late 1990s technology boom, thousands of internet startups received venture capital. Investors celebrated the winners—Amazon, eBay, Google. These survivors defined the narrative. The other 9,800 companies that failed? They disappeared. Consequently, the narrative became: “Internet companies are revolutionary.” The reality was: “1 out of 10,000 generated extraordinary returns. The other 9,999 lost money.”
This is the Anthropic Effect. It creates a distorted view of market reality by allowing you to observe only survivors.
January-February 2026: Markets Rising, Companies Disappearing
January 2026 Performance Data

The S&P 500 gained 4.2 percent from January 2-31, 2026. However, this headline masks substantial internal divergence:
Mega-cap technology stocks gained 8.7 percent. Mid-cap stocks gained only 1.2 percent. Small-cap stocks declined 0.8 percent.
The Magnificent Seven (Apple, Microsoft, Nvidia, Tesla, Amazon, Meta, Google) comprise approximately 38 percent of S&P 500 market capitalization. Their 8.7 percent gain largely drove the index’s 4.2 percent advance.
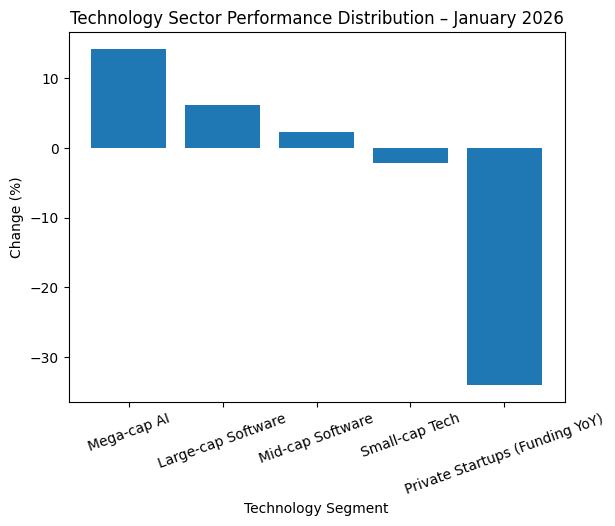
Within technology specifically:
- Mega-cap AI companies: +14.2%
- Large-cap software: +6.1%
- Mid-cap software: +2.3%
- Small-cap tech: -2.1%
- Venture funding: -34% year-over-year
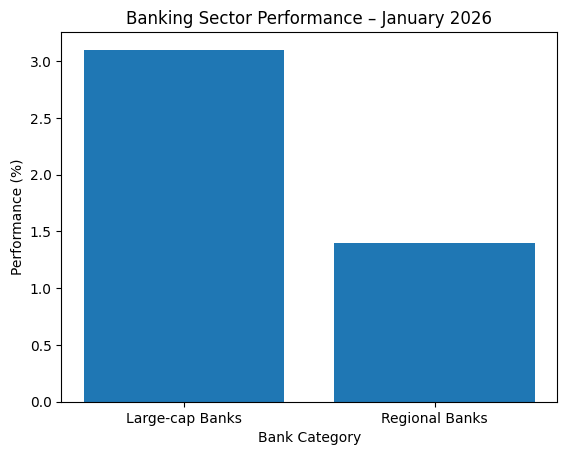
Banking Performance and Consolidation
Large-cap banks gained 3.1 percent during January 2026. Regional banks gained only 1.4 percent. More significantly, three regional banks were acquired at prices 15-22 percent below book value during the month.
DF Media Insight: Banking stability in 2026 is less about recovery and more about consolidation efficiency. Large-cap survivors appear resilient because weaker regional institutions are absorbed before failure becomes visible. Once acquired, they cease to exist as independent data points.
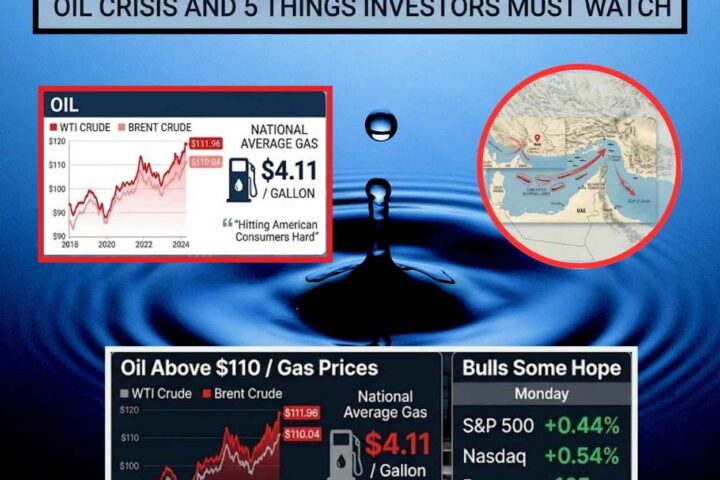
Energy Sector: Survivor Strength
The Energy Select Sector Index gained 2.8 percent in January. Large-cap energy companies gained 4.1 percent. Oil averaged $78 per barrel, ranging between $74-$82.
However, 23 energy companies and 12 renewable energy companies ceased operations between January 1 and February 6, 2026.
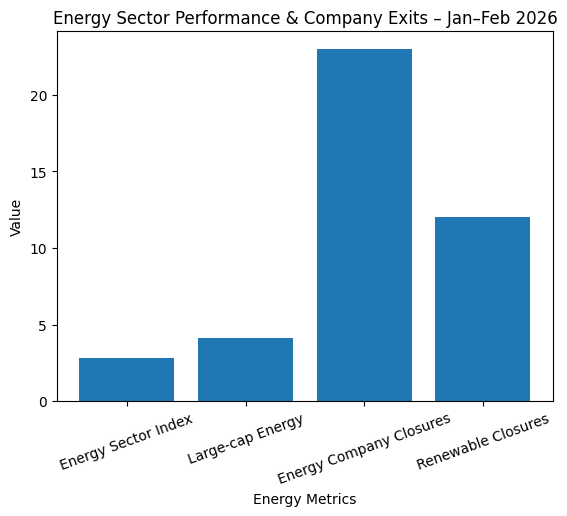
DF Media Insight: Energy stability in 2026 is scale-dependent, not sector-wide. Resilience is concentrated among integrated majors while smaller producers exit quietly.
February 2026 Continuation: Strength With Acceleration
Between February 1-6, 2026, the established pattern intensified:
Magnificent Seven: +2.1%
Nasdaq-100: +1.9%
S&P 500: +1.1%
Simultaneously, company exits accelerated:
- Delistings YTD: 47 (+23% versus historical average)
- Bankruptcy filings YTD: 312 (+18% versus prior year)
- Startup failures: +34% year-over-year
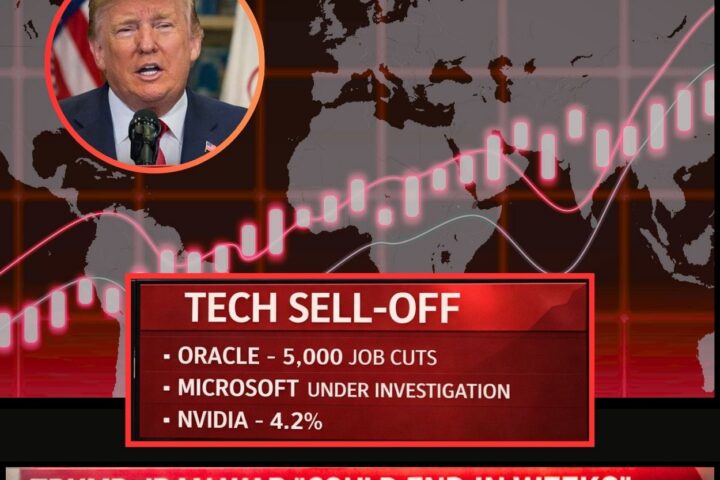
- Technology company closures: 134 companies
Credit Markets Signal Caution
While equity markets advanced, credit signals diverged:
Federal Funds Rate: 4.25-4.50% (unchanged)
10-Year Treasury: Declined from 4.42% to 4.18%
Corporate bond spreads: Widened from 105 to 112 basis points
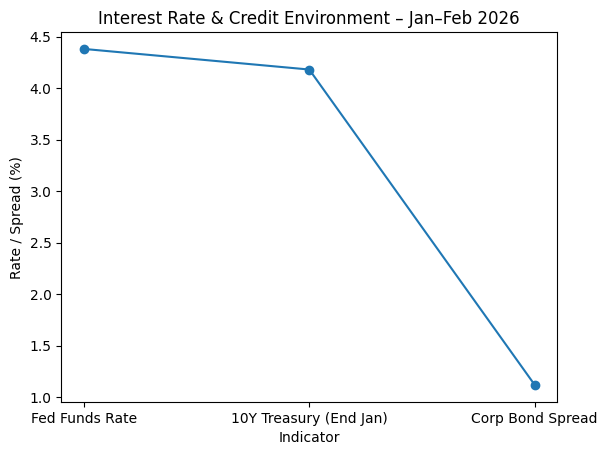
DF Media Insight: Equity markets are pricing relief. Credit markets are pricing caution. Lower yields support equity valuations, but widening spreads indicate rising borrower risk. Only companies with strong balance sheets remain visible in public markets. Weaker borrowers have been eliminated through bankruptcy or distressed acquisition.
Why the Anthropic Effect Matters in 2026
First: You Make Decisions on Incomplete Data
When you analyze historical stock performance, you analyze only stocks that currently exist. You cannot study the 134 technology companies that ceased operations in January-February 2026 because they no longer exist. Every investment decision is based on filtered datasets that eliminate all failures.
Consequently, historical returns appear higher than they actually were. Success rates appear higher. Market efficiency appears higher. The 47 delistings, 312 bankruptcy filings, and accelerating company closures represent real wealth destruction absent from mainstream narratives.
Second: Obvious Narratives Are Based on Survivorship
“Passive investing outperforms active management.” This appears true when examining historical data. However, passive funds own 95 percent capital in stocks that survived. They own zero percent in the 47 delisted companies.
“Technology is resilient.” Tech mega-caps gained 8.7 percent in January 2026. However, 134 technology companies ceased operations simultaneously. You only see the ones that bounced back.
“Energy is stable.” Energy mega-caps gained 4.1 percent. Meanwhile, 35 energy and renewable companies failed. The narrative masks the pattern.
Third: Markets Advance While Ecosystems Shrink
The core paradox: Markets gained 4.2 percent while delistings accelerated 23 percent above average and bankruptcies increased 18 percent year-over-year. These trends coexist because failing companies vanish from indices before impacting returns.
DF Media Insight: Markets are not stronger in 2026. They are narrower. What we observe is rapid concentration of capital into mega-cap survivors while mid-cap and small-cap ecosystems contract.
Fourth: Artificial Intelligence Amplifies the Bias
AI systems train on historical market data containing only survivors. They learn patterns from 134 technology companies that survived January-February 2026. They learn zero patterns from the technology companies that ceased operations because no historical data exists.
In 2026, AI concentrates capital into 50 mega-cap stocks while 5,000 mid-cap stocks receive declining investment. This is not because mega-caps are inherently superior. It is because AI systems cannot see mid-caps that failed and therefore ceased being observed.
Fifth: The Real Risk Is What You Cannot See
Risk management focuses on volatility, correlation, and drawdowns. These are measurable quantities. The greatest risk companies failing and disappearing is invisible because it has already been eliminated.
In 37 days of 2026, 47 companies delisted and 312 filed bankruptcy. These represent real capital losses absent from volatility calculations. This is the true risk facing investors in 2026.
Practical Solutions
Track Disappearances: Monitor delistings, bankruptcies, and companies acquired below book value. A market advancing 4.2 percent while delistings surge 23 percent indicates sector concentration, not strength.
Build Scenario Portfolios: Rather than predicting market movement, construct positions that survive multiple futures. Ask: What if this sector doubles? Declines 40 percent? Stays flat for three years? If all scenarios are manageable, the position is appropriate.
Embrace Portfolio Humility: You cannot predict which companies survive 2026. Consequently, diversify across 20-30 quality companies rather than concentrate in five stocks you believe will dominate. Acknowledge the limits of human knowledge.
Read What Media Ignores: Financial media covers rallies and successes. Study the 312 bankruptcies, 47 delistings, and 134 technology company closures that media does not emphasize. This reveals the actual market structure.
Question Obvious Narratives: Whenever a narrative appears obvious”markets are strong,” “technology is resilient,” “mega-caps are superior”—examine whether it is based on complete information or only survivor information. The first narrative obscures 47 delistings and 312 bankruptcies. The second obscures 134 technology company failures. The third ignores that only 50 mega-caps captured gains while 5,000 mid-caps declined.
Why Market Survival Beats Market Prediction
The Anthropic Effect in Finance will not change. Markets will always show only survivors. Failed companies will always disappear from databases. Unsuccessful strategies will always vanish.
However, your response can change.
You can continue making decisions based on incomplete survivor data, assuming obvious market narratives reflect complete reality. The data from January-February 2026 contradicts this. While markets gained 4.2 percent, companies failed at accelerated rates. While technology gained 8.7 percent, 134 technology companies ceased operations. While energy appeared stable, 35 energy and renewable companies failed.
Alternatively, you can acknowledge that every market narrative is based on filtered, survivor data. You can build portfolios designed to survive multiple scenarios. You can embrace humility regarding prediction capability.
DF Media Closing Outlook: The defining risk of 2026 is not volatility. It is false confidence driven by selective visibility. In 2026, markets are not stronger. They are narrower.
In markets where survivors dominate visibility and failures disappear from data, understanding what you cannot see is more valuable than understanding what you can.