# Daily Finance
> Generated by All in One SEO Pro v5.0.3, this is an llms-full.txt file, used by LLMs to index the site.
## Posts
### [Bitcoin Holds Above $82K as Big Tech Earnings Rock Wall Street This Week](https://df.media/bitcoin-price-this-week-big-tech-earnings/)
**Published:** October 19, 2026
**Author:** Vishnu Priya
**Excerpt:** Bitcoin price this week near $82,728. Meta, Netflix and Tesla earnings hit this week. S&P 500 near 7,700 support after AI selloff. Global crypto market cap $2.82 trillion. Bitcoin dominance 58.6%.
**Content:**
Bitcoin is holding above $82,000 this week while Wall Street braces for the biggest earnings sprint of Q4 2026. On October 19, 2026, the [S&P 500 entered the week near critical technical support](https://df.media/markets-today-october-12-2026/) after its worst weekly loss since June. Meanwhile the global [crypto market cap](https://www.coingecko.com/) hit $2.82 trillion and Bitcoin dominance climbed to 58.6%. This is the week that could reset the direction of both markets for the rest of the year.
## Bitcoin Holds Above $82K Despite Two Hot Inflation Reports
Bitcoin price this week opened near $82,728 on Monday, holding firm after two consecutive inflation readings came in above analyst expectations. The [September CPI report on October 14](https://df.media/cpi-october-14-2026-goldman-sachs-jpmorgan-earnings/) showed headline inflation rising to 3.6% year over year, yet Bitcoin barely flinched. The 24-hour trading range ran from $80,672 to $82,693, a relatively tight band that signals accumulation rather than panic selling.
Bitcoin’s all-time high stands at $126,200, making the current price roughly 35% below that peak. [CoinDesk](https://www.coindesk.com/) data shows the asset firmly in a recovery pattern. Michael Saylor of Strategy, whose firm holds more than 629,000 BTC, stated publicly this week that Bitcoin is returning to a bull market. Strategy’s position is valued at over $72 billion at current prices, making it the largest corporate Bitcoin holder in the world. The [Crypto Fear and Greed Index](https://alternative.me/crypto/fear-and-greed-index/) sits at 59 — solidly in greed territory.
## Big Tech Earnings Week Meta Netflix and Tesla Report
Approximately 70 S&P 500 companies report earnings this week, headlined by three of the most widely watched names in global finance. [Meta Platforms](https://investor.fb.com/) reports on October 21, with analysts watching whether its AI-driven ad revenue continues its 2026 momentum. [Netflix](https://ir.netflix.net/) reports on October 20, with consensus EPS estimates around $0.82 to $0.84. Tesla also reports this week with expectations muted after a series of delivery disappointments earlier in the year.
These three names carry enormous index weight. A combined beat from Meta, Netflix, and Tesla could single-handedly reverse the S&P 500’s recent slide. A combined miss, particularly from Meta whose AI infrastructure spending has drawn investor scrutiny, could push the index through its 7,700 support level and toward the 7,500 zone that technical analysts are flagging as the next meaningful floor.
## S&P 500 Slides Into Earnings Week Near Key Support
The S&P 500 closed last week near 7,659, down roughly 1.1% and logging its worst weekly performance since June 2026. The decline was driven by a rotation out of artificial intelligence and semiconductor stocks as investors questioned whether the scale of AI infrastructure spending can be justified by near-term revenue. The [CBOE VIX volatility index](https://www.cboe.com/tradable_products/vix/) hit a four-month intraday high on Friday, a clear signal of rising fear.
Monday morning S&P 500 futures recovered modestly, rising 0.2% to 0.4% as traders positioned for earnings season. [Charles Schwab](https://www.schwab.com/) market analysts noted that the 7,700 level is the first key support to watch, with 7,500 the larger downside risk if monthly options expiration creates additional selling pressure this week. A close below 7,500 would mark a 4% correction from the all-time high set in early October.
## AI Stock Selloff What It Means for Investors Right Now
Last week’s AI stock selloff raised a fundamental question every investor is now asking: can the revenue justify the spend? Companies across the Nasdaq have committed hundreds of billions of dollars to AI infrastructure, data centers, and chip procurement in 2026. Yet advertising revenue growth, the primary monetization channel for Meta, and subscription revenue growth for Netflix have not yet scaled proportionally. When that gap becomes visible in quarterly results, the market sells first and asks questions later.
For Bitcoin price this week, the AI selloff is actually a potential tailwind. Institutional money flowing out of overvalued growth tech has to go somewhere, and Bitcoin increasingly functions as a non-correlated store of value in portfolios where traditional safe havens like bonds yield barely real returns after 3.6% inflation. The [geopolitical premium already baked into oil and gold](https://df.media/how-geopolitics-affects-oil-energy-prices/) is starting to appear in Bitcoin’s relative resilience above $80,000.
## Crypto Market Cap at $2.82 Trillion and Bitcoin Dominance Rises
The global crypto market capitalization reached $2.82 trillion this week, with Bitcoin’s share at 58.6% — the highest dominance reading since early 2024. [Ethereum](https://ethereum.org/en/) traded between $2,420 and $2,460, roughly flat on the week. The rising dominance figure means capital inside crypto is consolidating into Bitcoin rather than spreading into altcoins, a classic pattern seen in the early phase of a new Bitcoin bull cycle.
Spot Bitcoin ETFs continue to attract institutional demand. When flows are positive, as they have been through much of Q3 and early Q4 2026, the result is persistent buying pressure that traditional retail-driven crypto cycles did not have. This structural change — large fund managers allocating to Bitcoin through regulated ETF vehicles — is one reason Bitcoin price this week is holding well above where it would trade in a purely retail-driven market at similar macro conditions.
## What to Watch This Week for Stock and Bitcoin Investors
| Day | Event | Why It Moves Markets |
|---|---|---|
| Monday Oct 19 | S&P 500 Futures Recovery Attempt | Tests 7,700 support — holds or breaks defines the week |
| Tuesday Oct 20 | Netflix Q3 2026 Earnings | EPS est $0.82. Miss could drag Nasdaq lower |
| Wednesday Oct 21 | Meta Platforms Q3 2026 Earnings | AI ad revenue growth — biggest index mover this week |
| Wednesday Oct 21 | Tesla Q3 2026 Earnings | Delivery numbers and margin outlook |
| Thursday Oct 22 | US Jobless Claims | Labor market health ahead of Fed Oct 27 meeting |
| Friday Oct 23 | Options Expiration Week Closes | Potential volatility spike at 7,500 S&P support |
## What is the Bitcoin price this week in October 2026?
Bitcoin price this week opened near $82,728 on October 19 2026. The 24-hour range was $80,672 to $82,693. Bitcoin dominance rose to 58.6% with global crypto market cap at $2.82 trillion. The Crypto Fear and Greed Index sits at 59, in greed territory.
## Which Big Tech companies report earnings this week?
Netflix reports Q3 2026 earnings on October 20, Meta Platforms reports on October 21, and Tesla also reports this week. Approximately 70 S&P 500 companies are reporting earnings this week, making it the busiest stretch of Q4 2026 earnings season.
## Why did the S&P 500 fall last week?
The S&P 500 fell roughly 1.1% last week — its worst week since June 2026 — as investors rotated out of AI and semiconductor stocks. Concerns about whether massive AI infrastructure spending can be justified by near-term revenue growth drove the selloff. The VIX hit a four-month intraday high on Friday.
## Is Bitcoin a good investment when stocks fall?
Bitcoin price this week has held above $82,000 despite two hot inflation reports and a tech stock selloff, showing resilience. Institutional buying through spot Bitcoin ETFs provides structural support. However Bitcoin remains volatile, and past performance does not guarantee future results. Always consult a financial advisor before investing.
Bitcoin price this week sits at a genuine inflection point. A strong Meta earnings beat could reignite tech optimism and pull crypto higher alongside equities. A miss from multiple Big Tech names could accelerate the AI selloff and test Bitcoin’s floor around $80,000. Either way, the Federal Reserve meets October 27-28 as the final macro event that will set the tone for Q4 2026. Stay current with every development at [DF Media](https://df.media/) — your source for US and global finance news.
**Categories:** Banking
---
### [CPI October 14 2026 Goldman Sachs Beats JPMorgan Misses Revenue](https://df.media/cpi-october-14-2026-goldman-sachs-jpmorgan-earnings/)
**Published:** October 14, 2026
**Author:** Vishnu Priya
**Excerpt:** September CPI drops today at 8:30 AM ET. Goldman Sachs Q3 EPS at $17.01 beats estimates. JPMorgan revenue misses at $50.17B vs $51.23B expected. Fed meeting Oct 27.
**Content:**
The CPI October 14 2026 report is the defining event for US markets today, dropping at 8:30 AM Eastern. Two major bank earnings also landed before the opening bell. [Goldman Sachs](https://www.goldmansachs.com/investor-relations/) posted a strong Q3 beat while [JPMorgan Chase](https://www.jpmorganchase.com/ir) came in slightly below revenue expectations. Here is what every investor needs to know right now. For broader context see our [US markets recap from October 12 2026](https://df.media/markets-today-october-12-2026/).
## Goldman Sachs Q3 2026 Earnings Beat Estimates
Goldman Sachs reported net revenues of [$18.68 billion for Q3 2026](https://www.sec.gov/Archives/edgar/data/0000886982/000088698226000529/a3q26gsearningsresults.htm), beating the $17.42 billion consensus. Diluted EPS of $17.01 beat the $15.39 estimate. Net earnings were $5.29 billion with return on equity at 18.7%. The beat was driven by trading and investment banking strength. Goldman also completed its $2.25 billion acquisition of NEOS Investments, expanding its [actively managed ETF](https://www.etf.com/) platform. Goldman posted EPS of just $12.25 in Q3 2025, making this year-over-year improvement dramatic.
## JPMorgan Q3 2026 Revenue Comes in Below Estimate
JPMorgan Chase reported [total net revenue of $50.17 billion for Q3 2026](https://www.sec.gov/Archives/edgar/data/0000019617/000162828026065582/a3q26erfex992supplement.htm), short of the $51.23 billion Wall Street consensus. Pre-earnings estimates had JPMorgan at approximately $5.93 EPS. Despite the revenue miss, the bank is on track to open more than 160 new branches and renovate nearly 600 locations in 2026, a signal of long-term retail banking confidence.
## CPI October 14 2026 September Inflation Report at 8:30 AM ET
The [Bureau of Labor Statistics](https://www.bls.gov/schedule/news_release/cpi.htm) releases the CPI October 14 2026 data at 8:30 AM Eastern. Economists forecast headline CPI at 3.6% year over year, up from 3.4% in August, with a monthly gain of 0.5% to 0.6%. Core CPI excluding food and energy is expected at 2.4% annually.
The [Cleveland Fed nowcast](https://www.clevelandfed.org/indicators-and-data/inflation-nowcasting) puts September headline inflation at 3.60% and core at 2.39%. Gasoline is estimated up 4.8% month over month and 32.1% year over year in September, driven entirely by Middle East supply disruption. Read our full analysis: [How Geopolitics Drives Oil and Energy Prices](https://df.media/how-geopolitics-affects-oil-energy-prices/).
## Why CPI October 14 2026 Matters More Than Usual
The CPI October 14 2026 report arrives at an unusually sensitive moment. The [Federal Reserve FOMC meets October 27 and 28](https://www.federalreserve.gov/monetarypolicy/fomccalendars.htm). Three consecutive months of cooling inflation would give policymakers cover to signal a rate cut. Three months of sticky inflation locks in higher-for-longer rates into 2027.
What makes the CPI October 14 2026 reading especially hard to predict is energy. If gasoline alone adds 0.3 to 0.4 percentage points to the monthly headline figure, the 3.6% forecast could print at 3.7% or higher. Bond markets were closed Monday for Columbus Day so the 10-year [US Treasury](https://www.treasurydirect.gov/) yield at 5.24% has not yet reacted to weekend developments. See: [Markets Today October 9 2026](https://df.media/markets-today-october-9-2026/).
A yield spike above 5.4% after the CPI October 14 2026 print would drag on equities immediately. A drop below 5.0% would trigger a broad S&P 500 risk rally. Futures were flat ahead of the release as traders refused to commit either direction before the data.
## Key Numbers at a Glance October 14 2026
| Story | Number | vs Estimate |
|---|---|---|
| Goldman Sachs Q3 Revenue | $18.68B | Beat $17.42B est |
| Goldman Sachs Q3 EPS | $17.01 | Beat $15.39 est |
| JPMorgan Q3 Revenue | $50.17B | Miss $51.23B est |
| September CPI Forecast | 3.6% YoY | Above 3.4% prior |
| Core CPI Forecast | 2.4% YoY | Steady |
| 10-Year Treasury Yield | 5.24% | Near 24-year highs |
## What is the CPI October 14 2026 forecast?
The September 2026 CPI report is due October 14 2026 at 8:30 AM ET. Economists forecast headline CPI at 3.6% year over year, up from 3.4% in August. Core CPI is expected at 2.4% annually. Energy prices driven by Middle East tensions are the main upside risk.
## What were Goldman Sachs Q3 2026 earnings?
Goldman Sachs reported Q3 2026 net revenues of $18.68 billion and EPS of $17.01, both beating consensus estimates. Net earnings were $5.29 billion with an 18.7% return on equity.
## Did JPMorgan beat earnings in Q3 2026?
JPMorgan reported Q3 2026 revenue of $50.17 billion, slightly below the $51.23 billion Wall Street estimate. The bank missed on the top line but continues its expansion with 160 new branch openings planned for 2026.
## When is the next Federal Reserve rate decision?
The next Federal Reserve FOMC meeting is October 27 and 28 2026. The CPI October 14 2026 inflation data will be a critical input for the Fed rate decision at that meeting.
The CPI October 14 2026 print, Goldman’s earnings beat, and JPMorgan’s slight revenue miss together paint a picture of a US economy in transition. Growth is holding, corporate profits remain strong, but inflation is not yet low enough for the Federal Reserve to pivot. Bookmark [DF Media](https://df.media/) for live updates as the BLS number hits this morning.
**Categories:** Banking
---
### [Markets Today October 12 2026 Bank Earnings Oil and CPI Week](https://df.media/markets-today-october-12-2026/)
**Published:** October 12, 2026
**Author:** Vishnu Priya
**Excerpt:** Markets today October 12 2026: S&P 500 at 7,811, Dow at 51,654, Brent crude near $104 on Middle East tensions. Bank earnings start Tuesday and CPI drops Wednesday.
**Content:**
Wall Street futures edged higher Monday morning as investors positioned for a critical week that includes big bank earnings, fresh inflation data, and rising crude oil prices driven by renewed tensions in the Middle East. US stock markets remain open despite Columbus Day while bond markets are closed for the holiday.
## US Stock Market Overview October 12 2026
US equities closed out last week on a strong note. The S&P 500 rose 0.6% on Friday to settle at 7,811.54, finishing just shy of its record high. The Dow Jones Industrial Average climbed 0.8% to 51,654.95, and the Nasdaq Composite gained 0.6% to close at 27,366.17.
For the week ending October 11, the S&P 500 advanced 1.2% while the Nasdaq lagged at 0.6% as semiconductor and mega-cap technology stocks faced selling pressure. The CBOE Volatility Index settled near 15.41 and the Fear and Greed Index rose from 31 to 45, pushing into neutral territory after weeks of fear-driven positioning.
## Oil Prices Surge on Middle East Tensions
Crude oil opened Monday roughly 1% higher after fresh geopolitical developments over the weekend. Brent crude hovered near $103.95 per barrel as investors weighed continued disruption risks around the Strait of Hormuz. One analyst described the waterway as structurally impaired with no resolution expected within three to six months.
Oil has swung between $97 and $108 per barrel in recent weeks following reports that the United States rejected a proposed seven-day deal to reopen the strategic waterway. The US Strategic Petroleum Reserve has released more than 40 million barrels to offset supply disruption, and G7 nations have also tapped emergency stocks. Goldman Sachs estimates Gulf crude exports recovered to approximately 23.3 million barrels per day in September.
## Bank Earnings Season Kicks Off Tuesday October 13
All eyes turn to Wall Street on Tuesday when JPMorgan Chase and Goldman Sachs are scheduled to report third-quarter 2026 results before the opening bell. These reports will set the tone for the broader earnings season and offer early signals on consumer spending, corporate borrowing, and investment banking activity.
For JPMorgan, analysts are estimating earnings per share of approximately $5.82 on revenue of around $50.6 billion. The bank plans to open more than 160 new branches and renovate nearly 600 locations in 2026. Goldman Sachs carries consensus EPS estimates of approximately $16.42 with revenue near $17.6 billion. Goldman also agreed to acquire NEOS Investments for up to $2.25 billion, deepening its push into actively managed ETFs.
## CPI Inflation Data Due Wednesday October 14
The next major market-moving event after earnings is the Consumer Price Index report, due Wednesday, October 14 at 8:30 AM Eastern Time. Investors will closely watch headline and core CPI readings for any sign that the Federal Reserve’s rate policy is cooling inflation effectively.
The 10-year US Treasury yield closed Friday at 5.24%, an historically elevated level that has weighed on growth stocks and kept mortgage rates high. With bond markets closed Monday, the yield reaction to any weekend news will only be visible Tuesday morning when fixed-income trading resumes.
## Gold Bitcoin and Safe Haven Assets
Gold continued its 2026 bull run with prices near $4,190 per ounce on Monday morning, underpinned by geopolitical risk, central bank buying, and strong demand for inflation hedges. The precious metal has surged sharply this year as the Middle East situation remained unresolved.
Bitcoin traded near $83,950 on Monday, holding a relatively stable range. Crypto markets have been moving broadly in line with risk appetite, with the Fear and Greed Index in neutral territory offering little strong directional signal for the week ahead.
## Key Events to Watch This Week October 13 to 17 2026
| Date | Event | Why It Matters |
|---|---|---|
| Tuesday Oct 13 | JPMorgan and Goldman Sachs Q3 Earnings | Consumer health and investment banking signals |
| Wednesday Oct 14 | US CPI Inflation Report 8:30 AM ET | Key Federal Reserve rate decision driver |
| Wednesday Oct 14 | Bond Markets Reopen After Columbus Day | Treasury yield reaction to weekend news |
| Thursday Oct 15 | Regional and Retail Bank Earnings Continue | Broader credit and lending picture |
| Friday Oct 17 | Additional S&P 500 Company Earnings | Q3 2026 earnings season momentum check |
October 12 marks the start of what could be the most market-moving week of Q4 2026. With oil supply under geopolitical pressure, inflation data on deck Wednesday, and the largest US banks about to open their books Tuesday, investors are searching for clues on whether the economy is cooling fast enough for the Federal Reserve to begin easing or whether rates stay higher for longer into 2027. Stay tuned to DF Media for live updates throughout the week.
**Categories:** Banking
---
### [How Geopolitics Drives Oil and Energy Prices Higher: The Investor's Essential Guide](https://df.media/how-geopolitics-affects-oil-energy-prices/)
**Published:** October 9, 2026
**Author:** Laura Anderson
**Content:**
Every time a missile is fired in the Middle East, oil prices move. Every time a naval standoff erupts near a critical shipping lane, energy markets shudder. Every time a major oil-producing nation faces sanctions, prices climb and global stock markets feel the pain. This is the iron law connecting geopolitics and energy: when the world becomes unstable, oil becomes expensive, and expensive oil reshapes every corner of the global economy.
Understanding how geopolitics affects oil prices is not optional for serious investors. Oil is the circulatory system of modern civilization. When it flows freely, economies grow. When it is disrupted, growth stalls, inflation rises, and financial markets go into crisis mode. This complete guide walks you through the history, the mechanics, and exactly what smart investors do when geopolitics drives energy prices higher.
## Why Oil and Geopolitics Are Permanently Linked
The Persian Gulf holds more than 48% of the world’s proven oil reserves. Saudi Arabia, Iraq, Iran, Kuwait, and the UAE together can make or break global energy markets with a single policy decision. The Strait of Hormuz, a narrow waterway between Iran and the Arabian Peninsula, carries roughly 20% of all global oil every single day. When US-Iran tensions escalated in 2026, tankers slowed, insurance costs spiked, and Brent crude jumped more than 10% in a single week. This is how geopolitics affects oil prices: through ships, pipelines, and chokepoints the entire world economy depends on.
## Five Greatest Geopolitical Oil Shocks in History
### 1973 OPEC Embargo: Energy as a Weapon Is Born
In October 1973, Arab OPEC members embargoed the US for supporting Israel in the Yom Kippur War. Oil prices quadrupled from $3 to $12 per barrel in months. The Dow Jones lost nearly 50% of its value. Gasoline lines stretched across America. The 1973 shock permanently established that oil is a geopolitical weapon and forced every major economy to build strategic petroleum reserves.
### 1979 Iranian Revolution: Regime Change Destroys Supply
Iran’s revolution collapsed its oil output from 6 million to under 2 million barrels per day overnight. Brent crude surged from $13 to over $35. The resulting stagflation was so severe that Federal Reserve Chair Paul Volcker raised interest rates to 20% to break it. Lesson: political regime change in a top oil producer is one of the most violent energy shocks possible with no warning and no easy hedge.
### 1990 Gulf War: Military Conflict Doubles Oil in Weeks
When Iraq invaded Kuwait in August 1990, oil doubled from $17 to $35 per barrel within weeks. The S&P 500 fell 20% during the uncertainty then surged powerfully when the war ended faster than markets expected. This established a key investor pattern: geopolitical oil spikes create sharp dislocations, but resolutions come faster than pessimists predict and reward patient investors who buy the panic.
### 2022 Ukraine War: Energy Becomes the Battlefield
Russia’s invasion of Ukraine triggered Europe’s worst energy crisis since 1973. European natural gas prices surged over 400%. Brent crude hit $130 per barrel. European inflation reached 10%, forcing the fastest ECB rate-hiking cycle in history. For investors, 2022 delivered the starkest modern lesson: energy supply disruptions cause inflation, force rate hikes, and crush equity valuations especially in growth and technology stocks.
### 2026 Iran Crisis: The Hormuz Threat Returns
The most recent chapter unfolded in 2026 as escalating US-Iran tensions put the Strait of Hormuz at genuine risk. Brent crude surged past $100 for the first time since 2022. The US EIA raised oil price forecasts multiple times. With Brent currently trading around $104 per barrel, the 2026 crisis is not history. It is the present reality and a living classroom for every principle in this guide.
## How Rising Oil Prices Ripple Through Every Asset Class
When geopolitics drives oil higher, the damage radiates outward in a predictable chain reaction. Transportation costs rise first as airlines, shipping companies, and trucking firms pass fuel costs into every product category from food to electronics. Manufacturing costs increase because petrochemicals from oil are embedded in plastics, fertilizers, and thousands of industrial inputs. Finally, consumer spending falls as households spend more on gasoline and heating and less on discretionary purchases. The entire chain from a geopolitical event to a consumer slowdown can play out in as little as six to eight weeks.
## Stock Market Winners and Losers When Oil Prices Rise
| Sector | Impact | Why |
|---|---|---|
| Energy Stocks (Exxon, Chevron) | Strong Winner | Revenue directly tied to oil price |
| Defense Contractors | Winner | Geopolitical tension drives defense budgets |
| Gold and Gold Miners | Winner | Safe haven demand rises with oil shocks |
| Airlines | Major Loser | Jet fuel is 20 to 30% of operating costs |
| Consumer Discretionary | Loser | Households cut spending as fuel costs climb |
| Technology Growth Stocks | Loser | Oil inflation forces rate hikes that crush valuations |
| Emerging Markets | Major Loser | Oil importers face currency collapse and inflation |
## The Oil Inflation Rate Chain That Breaks Stock Markets
The most dangerous consequence of a geopolitical oil shock for investors is not its direct effect on energy companies. It is the chain reaction running from oil through inflation through central bank policy through interest rates to equity valuations. This chain has played out identically in 1973, 1979, 1990, 2022, and 2026. Oil spikes on geopolitical news. Consumer price inflation accelerates because energy is embedded in the cost of almost everything. Central banks raise rates to fight inflation. Higher rates compress equity valuations, especially for growth and technology companies with high price-to-earnings ratios. The Nasdaq fell 33% in 2022 precisely because the Fed raised rates aggressively to fight Ukraine-driven energy inflation. With Brent at $104 and the 10-year Treasury yield at 5.2% in October 2026, this risk is live for today’s investors.
## The Proven Investor Playbook for Geopolitical Oil Shocks
The four-move playbook that has worked across every major geopolitical oil crisis since 1973 is time-tested. Move one: increase exposure to energy stocks and gold before the crisis peaks. Oil majors and gold miners consistently outperform during geopolitical oil shocks. Move two: reduce exposure to rate-sensitive growth stocks. Technology companies with high valuations are extremely vulnerable when oil-driven inflation forces rate hikes. Move three: watch the US dollar. Oil is priced in dollars, so dollar strength accompanies oil spikes, hurting emerging markets and multinational companies with large overseas revenues. Move four: be patient. Every geopolitical oil shock in history has resolved. Every resolution has been followed by a powerful stock market recovery for investors who held their positions through the uncertainty and fear.
## The Bottom Line for Every Finance Investor
Geopolitics and oil prices will remain linked for as long as the world’s most critical energy reserves sit beneath its most politically volatile territories. The investors who build lasting wealth through these cycles are not the ones who panic when oil spikes above $100. They are the ones who recognize the historical pattern, position early in energy and gold, reduce exposure to rate-sensitive growth stocks, and wait for the resolution that history always delivers. Master the relationship between geopolitics and energy prices and you will understand global financial markets at a level most professional investors never fully achieve.
### How does geopolitics affect oil prices?
Geopolitics affects oil prices by threatening crude oil supply from major producing regions. Conflicts, sanctions, and instability near oil infrastructure or shipping routes like the Strait of Hormuz create immediate fear of reduced supply, pushing prices sharply higher. The 1973 OPEC embargo, 1979 Iranian Revolution, 1990 Gulf War, 2022 Ukraine war, and 2026 Iran crisis are the five clearest historical examples.
### Which stocks go up when geopolitical tension raises oil prices?
When geopolitics raises oil prices, energy stocks like Exxon Mobil, Chevron, Shell, and BP typically rise strongly because their revenues are directly tied to higher crude prices. Defense contractors and gold mining companies also consistently outperform because geopolitical tension drives both defense spending and safe haven demand for gold.
### Why do higher oil prices hurt technology stocks?
Higher oil prices hurt technology stocks through the inflation-rates chain. Oil-driven inflation forces central banks to raise interest rates. Higher rates increase the discount rate applied to future earnings, reducing the present value of growth stocks with high price-to-earnings multiples. The Nasdaq fell 33% in 2022 precisely because the Fed raised rates to fight Ukraine-driven energy inflation.
### What is the Strait of Hormuz and why does it matter for oil prices?
The Strait of Hormuz is a narrow waterway between Iran and the Arabian Peninsula through which approximately 20% of the world’s daily oil supply passes. Any threat to close or disrupt the Strait immediately spikes global oil prices because there is no realistic alternative route for most Persian Gulf oil exports. Even a credible threat without actual disruption can push Brent crude 10% or more higher within days.
### How long do geopolitical oil shocks typically last?
Geopolitical oil shocks typically last between a few weeks and several months depending on conflict severity. The 1990 Gulf War oil spike resolved within six months once the military outcome was clear. The 2022 Ukraine energy crisis lasted roughly 18 months before European gas supplies diversified. In every case in history, oil prices eventually fell from their geopolitical peak and stock markets staged strong recoveries once uncertainty cleared.
**Categories:** Banking
---
### [OpenAI Raises 30 Billion at 1.4 Trillion Valuation: Why AI Stocks Just Crashed](https://df.media/openai-30-billion-valuation-ai-stocks-crash-october-2026/)
**Published:** October 9, 2026
**Author:** Laura Anderson
**Content:**
## OpenAI Raises 30 Billion Dollars at 1.4 Trillion Valuation: Why AI Stocks Just Sold Off
OpenAI is raising at least $30 billion in fresh funding at a staggering $1.4 trillion valuation, making it the most valuable private company in history. The announcement sent shockwaves through financial markets as investors simultaneously marveled at the scale of AI investment and worried that OpenAI’s actual revenues are not growing fast enough to justify the price tag. The result: a sharp AI stock selloff that dragged the Nasdaq down 1.25% and wiped billions from the market caps of Nvidia, Oracle, and AMD in a single session.
This is the defining financial story of October 2026. The OpenAI $30 billion fundraise is not just a startup milestone. It is a signal that the AI financing cycle has reached a scale that only a handful of sovereign wealth funds and the world’s largest asset managers can participate in. For everyday investors in AI stocks, it raises a critical question: is the AI trade still a buy, or is the valuation bubble about to burst?
## The Numbers Behind the OpenAI 30 Billion Dollar Deal
At a $1.4 trillion valuation, OpenAI is being priced at approximately 28 times its annualized revenue. That multiple is extraordinarily high, even by Silicon Valley standards. For comparison, Nvidia currently trades at around 35 times forward earnings, but Nvidia is a profitable, publicly traded company with hardware that every AI lab in the world depends on. OpenAI is still a private company, is not yet profitable, and its revenue growth, while impressive, came in below what some insiders had expected.
CEO Sam Altman has ruled out an OpenAI IPO in 2026, which means the only way for most investors to get exposure to OpenAI’s growth is indirectly, through the companies that supply it. That includes Nvidia for chips, Microsoft for cloud infrastructure, and a growing list of enterprise software companies building on top of OpenAI’s API. This is exactly why the OpenAI $30 billion raise matters so much for public market investors.
## How AI Stocks Reacted: Nvidia Oracle and AMD All Fall
The market’s reaction to the OpenAI funding news was swift and punishing for AI hardware and infrastructure stocks. Oracle shares fell more than 5% as investors questioned whether the company’s cloud infrastructure business is growing quickly enough to support its AI-driven valuation premium. Nvidia dropped nearly 3%, a significant move for a company that has become the backbone of the entire AI investment thesis. AMD fell almost 4%, hurt by both the sector-wide selloff and concerns about its competitive position against Nvidia’s dominant H100 and H200 chip franchises.
The Nasdaq Composite fell 1.25%, closing at 27,193.34, while the S&P 500 declined 0.47% to 7,765.36. Not every AI stock suffered. Palantir bucked the trend with a 2% gain after Goldman Sachs upgraded the data analytics company, arguing that Palantir’s government and enterprise contracts make it more defensible than pure AI infrastructure plays. The divergence between Palantir and the chip names tells a nuanced story: investors are starting to reward AI companies with real, recurring revenue contracts over those selling hardware into a buildout that may eventually slow.
## Morgan Stanley: AI Needs 1.5 Trillion in Financing by 2028
Beneath the daily stock moves is a deeper structural story that every finance investor needs to understand. Morgan Stanley analysts estimate that AI infrastructure will require $1.5 trillion in external financing by 2028. That is a number that dwarfs even the OpenAI $30 billion raise. It means data centers, chips, energy infrastructure, and networking equipment will need to be funded at a scale that has never been seen in any previous technology cycle.
The banks are already benefiting. JPMorgan posted the highest quarterly profit in US banking history last quarter, with CEO Jamie Dimon crediting AI-related investment banking activity including IPOs, debt issuance, and mergers as the primary driver. Goldman Sachs reported earnings of $20.98 per share versus analyst estimates of $14.40 last quarter. Both JPMorgan and Goldman Sachs report their Q3 2026 earnings on October 13, just four days away. Wall Street expects another record quarter, and any disappointment will hit financial stocks hard.
## Bitcoin at 82000 Dollars: Crypto Holds Ground Despite AI Stock Selloff
Bitcoin demonstrated remarkable resilience in the face of the AI stock selloff, holding around $82,000 per coin. Bitcoin mining stocks did fall in sympathy with the broader technology sector, but the flagship cryptocurrency itself held above key technical support levels. JPMorgan targets the S&P 500 reaching 8,000 by year-end, an increase from current levels of around 7,765, and notes that Bitcoin historically outperforms equities in the final quarter of the year when institutional risk appetite is high.
The crypto market is also watching the AI funding story closely because several of the largest Bitcoin mining companies are pivoting toward AI computing infrastructure. Firms like Core Scientific and Hive Digital have been converting mining facilities into AI data centers, effectively making them plays on both the Bitcoin price and the AI infrastructure boom. If OpenAI’s $30 billion raise accelerates AI compute demand, these dual-exposure companies could be among the biggest beneficiaries.
## PepsiCo Earnings: A Warning Sign for Consumer Stocks
While the AI story dominated headlines, a quieter but equally important earnings signal came from PepsiCo. The consumer goods giant beat analyst estimates but cut its full-year profit growth forecast roughly in half. PepsiCo’s stock rose 3.7% on the day because investors had feared even worse results, but the guidance cut is a warning sign for the broader consumer sector.
PepsiCo’s struggle reflects a real tension in the US economy in October 2026: consumers are feeling the pressure of oil at $104 per barrel, elevated interest rates, and persistent food and energy inflation. The Federal Reserve has kept rates above 4% all year to fight inflation, and the impact is being felt in consumer spending. The September CPI report due Thursday is the next critical data point, and any upside surprise on inflation would increase pressure on the Fed to hold rates higher for longer, creating a headwind for both stocks and consumer companies.
## What This Means for Investors in October 2026
| Stock / Asset | Move | Key Driver |
|---|---|---|
| Nasdaq Composite | -1.25% | OpenAI revenue concerns |
| S&P 500 | -0.47% | AI stock selloff |
| Nvidia | -3% | AI infrastructure re-rating |
| Oracle | -5% | Cloud growth doubts |
| AMD | -4% | Chip sector weakness |
| Palantir | +2% | Goldman Sachs upgrade |
| Bitcoin | Held $82,000 | Resilience vs equity selloff |
| Gold | $4,194.50 (+1.52%) | Safe haven demand |
The OpenAI $30 billion fundraise at a $1.4 trillion valuation is a landmark moment that crystallizes both the enormous promise and the equally enormous risk of the AI investment cycle. For long-term investors, the story remains compelling. AI will reshape every industry over the next decade, and the companies building the infrastructure for that transformation will generate extraordinary returns. But valuations like OpenAI’s remind investors that the market is already pricing in a very optimistic scenario, and any shortfall in revenue growth can trigger sharp corrections in even the most beloved AI names.
The next 48 hours are critical. Thursday’s CPI report and Friday’s start of bank earnings will either confirm or challenge the AI bull case. Investors who can stomach short-term volatility may find the current pullback in Nvidia and the broader AI sector a buying opportunity. Those with shorter time horizons should watch the 10-year Treasury yield closely. If it rises back above 5.3%, expect another leg down in growth stocks.
### How much is OpenAI raising and at what valuation in 2026?
OpenAI is raising at least $30 billion at a $1.4 trillion valuation in October 2026, making it the most valuable private company in history. The deal values OpenAI at approximately 28 times its annualized revenue. CEO Sam Altman has ruled out an IPO in 2026.
### Why did AI stocks fall after the OpenAI fundraise news?
AI stocks fell because OpenAI’s actual revenues came in below what some investors had expected, raising questions about whether the $1.4 trillion valuation is justified. Nvidia fell 3%, Oracle dropped 5%, and AMD lost 4% as investors reassessed the growth assumptions baked into AI infrastructure valuations.
### When do JPMorgan and Goldman Sachs report Q3 2026 earnings?
JPMorgan Chase and Goldman Sachs both report their Q3 2026 earnings on October 13, 2026. Both banks are expected to post strong results driven by AI-related investment banking activity. Last quarter, JPMorgan posted the highest quarterly bank profit in US history and Goldman beat estimates by nearly 50%.
### What is Bitcoin price in October 2026?
Bitcoin is trading around $82,000 in October 2026, holding steady despite the AI stock selloff that hurt the Nasdaq and S&P 500. Bitcoin mining companies are increasingly pivoting toward AI data center infrastructure, creating dual exposure to both the crypto and AI investment themes.
---
### [Markets Today October 9 2026: Best Q3 Earnings Season AI Stocks Drive S&P 500 to Record Highs](https://df.media/markets-today-october-9-2026/)
**Published:** October 9, 2026
**Author:** Laura Anderson
**Content:**
## Markets Today October 9 2026: Q3 Earnings Season Kicks Off as AI Stocks Lead Wall Street Higher
Markets today October 9 2026 are opening one of the most consequential weeks of the year for investors. The Q3 earnings season officially begins this week, with major US bank earnings and the September CPI inflation report both landing within days of each other. The S&P 500 is trading at 7,786.44, up 0.27%, hovering just below its recent all-time high as Wall Street braces for a flood of corporate results.
The central theme driving markets today October 9 2026 is artificial intelligence. Analysts expect AI-related companies to generate the majority of S&P 500 earnings growth this quarter. Gold surged to $4,194.50 per ounce, up 1.52%, while Brent crude oil dipped slightly to $104.11, giving some relief to equity markets and battered bond portfolios.
## Q3 Earnings Season 2026: What Analysts Expect
The biggest story shaping markets today October 9 2026 is the start of Q3 earnings season. JPMorgan Chase, Wells Fargo, and BlackRock are among the first major companies to report results this week. Analysts expect overall S&P 500 earnings growth of approximately 8% year-over-year, but the distribution is highly uneven.
AI-related companies are expected to account for the vast majority of those gains. Technology giants with significant AI revenue streams are projected to post earnings growth of 20% to 35%, while traditional sectors like energy, materials, and utilities are expected to show flat to modest growth. This divergence has been the defining feature of the 2026 stock market rally, and markets today October 9 2026 suggest that investors are betting heavily that trend continues.
## Gold Hits 4194 as Safe Haven Demand Surges
One of the most striking moves in markets today October 9 2026 is gold’s powerful rally to $4,194.50 per ounce, up 1.52% in a single session. Gold has now gained more than 50% over the past 12 months, driven by a combination of central bank buying, persistent inflation above the Fed’s 2% target, and ongoing geopolitical uncertainty in the Middle East.
Copper also advanced strongly in markets today October 9 2026, rising 1.38% to $1,426.90 per metric ton. Copper is often called “Doctor Copper” because it reflects global economic health. A strong copper price alongside rising gold suggests that investors are simultaneously betting on continued growth and protecting against risks. This dual signal is characteristic of late-cycle bull markets.
## Bank Earnings and CPI Headline a Packed Markets Week
Beyond the daily movements, markets today October 9 2026 are being driven by anticipation of two major macro events this week. The September Consumer Price Index report will be released Thursday and is expected to show inflation running between 3.2% and 3.5% annually. Any surprise above 3.5% would reignite fears of additional Federal Reserve rate hikes and could push the 10-year Treasury yield back above the psychologically important 5.3% level.
The 10-year US Treasury yield currently stands at 5.232% in markets today October 9 2026, marginally lower on the day. UK gilt yields are elevated at 5.444%, and Germany’s 10-year bund yields 3.478%. The spread between US and European bonds continues to attract global capital flows into dollar-denominated assets, supporting the US equity market even at record valuations.
## SpaceX Spectrum Deal Pressures Telecom Stocks
A major corporate story making waves in markets today October 9 2026 is SpaceX’s new spectrum agreement with regulators. The deal, which gives SpaceX access to frequencies previously held by traditional telecom operators, sent shockwaves through the telecommunications sector. AT&T, Verizon, and T-Mobile all traded lower on the news as investors reassessed competitive threats from Elon Musk’s space and communications empire.
This SpaceX development is part of a broader technology disruption story that has defined markets today October 9 2026 and throughout 2026. Traditional industries from banking to telecoms to energy are under increasing pressure from technology and AI-driven competitors. The market’s message is clear: companies that adapt to the AI era will be rewarded, and those that do not will be left behind.
## European and Asian Markets October 9 2026
Global markets are broadly positive in markets today October 9 2026. The Euro STOXX 50 gained 1.04% to 6,190.35, powered by strong performance in European technology and industrial stocks. The FTSE 100 rose 1.18% to 10,564.76, its best session in two weeks, as falling oil prices boosted consumer sentiment across the UK economy.
In Asia, the Nikkei 225 was essentially flat at 69,030.92 as yen weakness continued to weigh on Japanese consumer stocks, even as exporters benefited. India’s central bank made news in markets today October 9 2026 by announcing plans to sell $2.6 billion of bonds and tighten bank reserve requirements, signaling that the Reserve Bank of India is moving to absorb excess liquidity amid rising inflation pressures.
## Full Market Data October 9 2026
| Asset | Price / Level | Change |
|---|---|---|
| S&P 500 | 7,786.44 | +0.27% |
| Euro STOXX 50 | 6,190.35 | +1.04% |
| FTSE 100 | 10,564.76 | +1.18% |
| Nikkei 225 | 69,030.92 | -0.02% |
| Gold ($/oz) | 4,194.50 | +1.52% |
| Brent Crude ($/bbl) | 104.11 | -0.16% |
| Copper ($/MT) | 1,426.90 | +1.38% |
| US 10Y Yield | 5.232% | -0.002 |
| EUR/USD | 1.1193 | -0.16% |
| GBP/USD | 1.3222 | -0.05% |
## What to Watch This Week in Markets
For investors tracking markets today October 9 2026 and the week ahead, three events will determine whether the S&P 500 breaks back to record highs or pulls back. First, bank earnings from JPMorgan, Wells Fargo, BlackRock and Citigroup will set the tone for the entire Q3 season. Strong results with forward guidance maintained will confirm the bull case for equities.
Second, Thursday’s CPI print is the most important macro data point of the month. Inflation has been the defining force in financial markets since 2021, and it still moves bond yields and stock valuations significantly. Third, Federal Reserve speakers are scheduled throughout the week. Any hint of a rate cut timeline for early 2027 would be a major catalyst for both bonds and growth stocks. Markets today October 9 2026 are a calm before what promises to be an eventful week for global finance.
### What are the top markets stories for October 9 2026?
Markets today October 9 2026 are dominated by the start of Q3 earnings season, with AI companies expected to drive most S&P 500 earnings growth. Gold reached $4,194, Brent crude held at $104, and the SpaceX spectrum deal hit telecom stocks hard. Bank earnings and September CPI data are the key events this week.
### Where is gold trading on October 9 2026?
Gold is trading at $4,194.50 per ounce in markets today October 9 2026, up 1.52% on the day. The yellow metal has surged more than 50% over the past year driven by central bank buying, geopolitical risk, and persistent inflation above the Federal Reserve’s 2% target.
### What is the S&P 500 level on October 9 2026?
The S&P 500 is trading at 7,786.44 in markets today October 9 2026, up 0.27%. The index remains near its all-time high set earlier this month as investors look ahead to Q3 bank earnings and September CPI inflation data later this week.
### When do Q3 2026 bank earnings start?
Q3 2026 bank earnings begin this week in markets today October 9 2026, with JPMorgan Chase, Wells Fargo, BlackRock, and Citigroup all scheduled to report results. Analysts expect overall S&P 500 Q3 earnings growth of about 8% year-over-year, with AI-related companies driving the bulk of the gains.
---
### [Markets Today October 6 2026: Best S&P 500 Nasdaq Record Highs Proven by Surging AI Stocks](https://df.media/markets-today-october-6-2026/)
**Published:** October 6, 2026
**Author:** Laura Anderson
**Content:**
## Markets Today October 6 2026: S&P 500 and Nasdaq Shatter Records
Markets today October 6 2026 delivered a stunning rally for investors worldwide. The S&P 500 surged to 7,833.70, marking a fresh all-time high, while the Nasdaq Composite also climbed to record territory. This breakout came as 10-year Treasury yields eased from their multi-year high of 5.279%, giving growth stocks the oxygen they needed to race higher.
Traders watching markets today October 6 2026 saw a textbook risk-on session. Technology and software stocks led the charge, gold hit $4,163 per ounce, and Brent crude held just above the psychologically significant $100 mark. Every major global index posted gains, underscoring the breadth of the rally.
## S&P 500 and Nasdaq Reach New All Time Highs
The headline story in markets today October 6 2026 is undeniably the S&P 500 closing at 7,833.70, up 0.77% on the day. The index has now set consecutive record closes as investors grow more confident that the Federal Reserve is done hiking interest rates. The Nasdaq, home to the biggest technology names, matched that energy with its own fresh all-time closing high.
Analysts say the easing in Treasury yields was the key catalyst. The 10-year yield dropped 3.2 basis points to 5.279%, pulling back from levels that had unsettled equity markets in recent weeks. Lower yields reduce the discount rate applied to future corporate earnings, which immediately boosts the valuations of high-growth companies. That dynamic powered the Nasdaq’s outperformance in markets today October 6 2026.
## US Software Stocks Scale Fresh 2026 Highs as AI Worries Fade
A separate but related story making waves in markets today October 6 2026 is the surge in US software stocks to their best levels of 2026. For months, investors worried that artificial intelligence would cannibalize traditional software companies by automating tasks and reducing enterprise spending. Those fears are now fading rapidly.
Enterprise customers are actually spending more on software to integrate AI into their workflows. Companies like Salesforce, ServiceNow, and Adobe all traded higher on Tuesday. The market is pricing in a world where AI is a tailwind, not a headwind, for software revenues. This theme dominated conversations among institutional investors watching markets today October 6 2026.
## Treasury Yields and Bond Market: What It Means for Investors
The bond market provided a crucial backdrop for markets today October 6 2026. The 10-year US Treasury yield stood at 5.279%, a level that just weeks ago was causing significant anxiety. While yields remain historically elevated, the fact that they pulled back slightly on Tuesday was enough to trigger a broad equity rally.
Meanwhile, Germany’s 10-year bund yield edged up to 3.491% and the UK’s 10-year gilt rose to 5.398%. The spread between US and European yields continues to attract global capital into dollar-denominated assets, supporting both the currency and equity markets. Analysts at major banks are watching whether the 5.3% level for the 10-year US yield becomes a ceiling or a floor in coming weeks.
## Oil at 100 Dollars and Gold at 4163: Commodity Markets Update
Commodity markets also made major news in markets today October 6 2026. Brent crude oil traded at $100.23, barely changed on the day, hovering at a level that carries enormous psychological weight. The US Energy Information Administration raised its oil price forecasts again this week, citing the ongoing Iran conflict, which has drained global crude inventories faster than expected.
Gold continued its remarkable 2026 bull run, trading at $4,163.30 per ounce, up 0.85% on Tuesday. The yellow metal has become a multi-year story of strength, supported by central bank buying, geopolitical uncertainty, and persistent inflation fears. Copper also advanced 0.16% to $1,412.80, signaling that industrial demand remains healthy despite global growth concerns. These commodity moves added another dimension to markets today October 6 2026.
## Currency Markets: Euro and Sterling Rebound
Foreign exchange markets saw a notable shift in markets today October 6 2026. The euro bounced sharply, with EUR/USD rising 0.29% to 1.1256, after French bond yields fell sharply. Investors had been worried about French fiscal policy following the rise of Marine Le Pen’s far-right movement, but falling bond spreads suggested those fears eased for now.
The British pound also gained ground, with GBP/USD up 0.36% to 1.3271. The yen weakened slightly against the dollar, with JPY/USD slipping 0.15%. The Chinese yuan held steady at 0.1492 against the dollar. For multinational companies reporting earnings this season, currency moves in markets today October 6 2026 will be a key variable to watch.
## Global Markets Scorecard October 6 2026
| Index / Asset | Level | Change |
|---|---|---|
| S&P 500 | 7,833.70 | +0.77% |
| Euro STOXX 50 | 6,272.23 | +0.48% |
| FTSE 100 | 10,541.69 | +0.42% |
| Nikkei 225 | 70,683.98 | +1.05% |
| Gold ($/oz) | 4,163.30 | +0.85% |
| Brent Crude ($/bbl) | 100.23 | -0.09% |
| US 10Y Yield | 5.279% | -0.032 |
| EUR/USD | 1.1256 | +0.29% |
## What Wall Street Is Watching for the Rest of October 2026
Looking beyond markets today October 6 2026, investors are preparing for the start of Q3 earnings season. Major US banks are set to report results this week, with JPMorgan Chase kicking off the season. Analysts expect earnings growth of approximately 8% year-over-year for S&P 500 companies, supported by strong consumer spending and AI-driven productivity gains.
Federal Reserve speakers will also be closely watched. Any hint that the central bank is considering rate cuts in early 2027 could add further fuel to the equity rally. Conversely, if inflation data released later this month surprises to the upside, the bond sell-off could resume, pressuring stocks from their record highs. Markets today October 6 2026 may be the calm before a volatile earnings and macro data storm.
## Key Takeaways for Finance Investors
Markets today October 6 2026 offered a clear message: when Treasury yields ease even slightly, risk assets rally hard. The record closes in the S&P 500 and Nasdaq reflect genuine investor optimism about AI-driven corporate earnings growth and a potential soft landing for the US economy. Gold’s continued strength at $4,163 signals that investors are not abandoning safe havens entirely, keeping a hedge against inflation and geopolitical risk.
For individual investors, the lesson from markets today October 6 2026 is to stay diversified. Equities are at record highs, bonds offer the highest yields in years, gold is soaring, and oil at $100 creates both risks and opportunities. The best portfolios heading into Q4 2026 will balance exposure across all of these asset classes rather than concentrating in any single trade.
### What happened in markets today October 6 2026?
Markets today October 6 2026 saw the S&P 500 hit a record high of 7,833.70 and the Nasdaq reach a new all-time high as Treasury yields pulled back from their peaks. Gold traded at $4,163.30 and Brent crude held near $100 per barrel.
### Why did the S&P 500 hit a record high on October 6 2026?
The S&P 500 hit a record high in markets today October 6 2026 primarily because 10-year Treasury yields eased slightly, reducing pressure on equity valuations. Strong performance in software and technology stocks also helped drive the index to new highs as AI disruption fears faded.
### Where is gold trading in markets today October 6 2026?
In markets today October 6 2026, gold is trading at $4,163.30 per ounce, up 0.85% on the day. Gold has been one of the top performing assets of 2026, supported by central bank buying and geopolitical uncertainty.
### What is the US 10-year Treasury yield today October 6 2026?
The US 10-year Treasury yield in markets today October 6 2026 stands at 5.279%, down 3.2 basis points from the previous session. This slight pullback from multi-year highs helped fuel a broad stock market rally.
---
### [India US Trade Talks 2026 Hit Plateau, Finance Minister Says](https://df.media/india-us-trade-talks-2026/)
**Published:** October 5, 2026
**Author:** Vishnu Priya
**Content:**
October 5, 2026
**Table of Contents**
1. What Is Happening in India US Trade Talks 2026
2. Trade Flows and Oil Import Data
3. Why It Matters
4. Expert Analysis and Reaction
5. What Investors and Traders Need to Know
6. What Comes Next for India US Trade Talks 2026
7. Key Takeaways
8. FAQ
## What Is Happening in India US Trade Talks 2026
India US trade talks 2026 have reached a plateau, according to Finance Minister Nirmala Sitharaman, who said on Monday that both governments are running out of room to trade concessions. Speaking at an event in New Delhi, she called the deal a hard fought agreement and stressed that negotiations are still continuing.
[Reuters](https://www.reuters.com/) described the remarks as New Delhi’s clearest public admission that talks have stalled. The two sides have been chasing a bilateral agreement since February 2025, with the goal of deepening economic ties and settling difficult market access questions.
Here is the thing. Sitharaman said any further give and take would now be “very, very difficult” for both sides. That is a blunt message from a senior minister, and it follows U.S. Trade Representative Jamieson Greer’s statement last week that a deal was not imminent after he met Indian Trade Minister Piyush Goyal in the United States.
## Trade Flows and Oil Import Data
The numbers explain why neither side wants to walk away. The United States remains India’s largest export destination. Indian official data cited by Reuters shows goods shipments to the U.S. rose to $42.79 billion between April and August, up from $40.39 billion a year earlier, a gain of roughly 6%.
Sitharaman argued that the trade balance favors India and that the deficit sits on the American side. In her view, that is why Washington wants to shrink the imbalance.
Oil is the harder variable. [Kpler](https://www.kpler.com/) data cited by Traders Union shows India imported 2.08 million barrels per day of Russian crude in August 2026, about 45% of its total crude purchases. Separately, the [Centre for Research on Energy and Clean Air](https://energyandcleanair.org/) estimates that China took 50% and India 37% of Russia’s crude exports between December 2022 and August 2026.
Here is why those figures matter. India sits at the center of a new U.S. sanctions law, and its energy mix leaves little room for a quick change of course.
## Why It Matters
President Donald Trump signed the Lindsey O. Graham Sanctioning Russia and Iran Act of 2026 on September 18, according to a White House statement reported by the Press Trust of India. The Senate passed the bill 86 to 11, and the House approved the final version 262 to 159.
The law authorizes tariffs of up to 100% on goods from the largest buyers of Russian oil and gas. PTI reports that it targets the top five purchasers by volume over the prior 12 months, that the president keeps wide discretion over which countries are hit, at what rate, and whether waivers apply, and that it takes effect within 30 days of signing. A Democratic amendment from Representative Steny Hoyer reportedly names ten countries for possible action, including India and China.
But wait. The 100% figure is a ceiling, not an automatic tariff, as Outlook Business notes. Still, the threat alone narrows the space for compromise. Reuters reports that it leaves Prime Minister Narendra Modi in an energy policy bind. Cutting Russian purchases could lift domestic fuel prices or strain government finances, while keeping them risks damaging exports to India’s biggest market. India has said it will keep diversifying its oil sources while warning that the measures could harm ties with Washington.
Global markets move fast. Stay ahead of every rate decision, price move, and market shifting event as it happens.
👉 [Follow Daily Finance News at DF.Media](https://df.media/)
## Expert Analysis and Reaction
Ajay Srivastava, founder of the New Delhi think tank Global Trade Research Initiative and a former trade official, argued that India should stop offering concessions while the deal remains unfinished. His comment mirrors the finance minister’s message that room for compromise is thin.
Sitharaman also pushed back on the wider use of tariffs. She said levies aimed at fixing trade imbalances have gone beyond being a negotiating tool, and she pointed to India’s own lopsided deficit with China as a case where New Delhi prefers talks over penalties. Her point was that every country faces imbalances, and the answer is negotiation, not punishment.
Kerala Kaumudi reported that Washington is expected to press India to sharply cut its Russian purchases while possibly avoiding a direct trade clash, since it views India as a strategic partner against China. Officials have not confirmed that reading.
## What Investors and Traders Need to Know
Markets do not need talks to collapse to reprice risk. A stalled deal combined with live tariff authority raises uncertainty for Indian exporters that depend on the U.S. market, including electrical machinery, which Traders Union flagged as exposed. Refiners and oil marketing companies face a separate question about crude sourcing costs if Russian barrels become harder to buy.
Currency and bond traders will watch how any energy shift affects India’s import bill and fiscal position, since Reuters noted that government finances are part of the dilemma. Equity investors should track statements from India’s Commerce Ministry and the U.S. Trade Representative for signs of movement.
Here is the thing. Nothing in this week’s news confirms new tariffs on India. What it confirms is that a quick deal looks unlikely, and headline risk is likely to stay elevated until Washington signals how it will use its new powers.
## What Comes Next for India US Trade Talks 2026
The first checkpoint is the law’s 30 day effective window, which points to mid October based on the September 18 signing date reported by PTI. After that, attention turns to which countries the administration names and at what rates.
Talks are expected to continue, since Sitharaman said negotiations are ongoing, but Greer’s comment last week suggests no signing is near. A shift by either side on market access or Russian oil would be the clearest sign of a breakthrough.
## Key Takeaways
Finance Minister Sitharaman says India US trade talks have plateaued and that further concessions would be very difficult. Negotiations have run since February 2025 without a final deal. Indian goods exports to the U.S. rose to $42.79 billion from April to August. Russian crude made up about 45% of India’s August imports, per Kpler. A new U.S. law allows tariffs of up to 100% on top buyers of Russian energy, with wide presidential discretion.
This story is moving fast. Get every update, analysis, and market reaction as it happens.
👉 [Follow Breaking Finance News at DF.Media](https://df.media/)
## FAQ
### What did Nirmala Sitharaman say about India US trade talks?
She said talks have reached a plateau and that further concessions would be very difficult for both sides, though negotiations are continuing, according to Reuters on October 5, 2026.
### When did India and the US start negotiating a trade deal?
The two countries have been pursuing a bilateral agreement since February 2025, per Reuters.
### What is the new US law on Russian oil buyers?
The Lindsey O. Graham Sanctioning Russia and Iran Act of 2026, signed September 18, authorizes tariffs of up to 100% on top buyers of Russian oil and gas, according to PTI.
### Will the US impose 100% tariffs on India?
Not automatically. The rate is a ceiling, and the administration has wide discretion over countries, rates, and waivers, per Outlook Business and PTI.
### How much Russian oil does India import?
Kpler data cited by Traders Union puts August 2026 imports at 2.08 million barrels per day, about 45% of India’s crude purchases.
### How much did India’s goods exports to the US grow?
Shipments rose to $42.79 billion from April to August, from $40.39 billion a year earlier, per Indian official data cited by Reuters.
*This article is for informational purposes only and does not constitute financial advice. Always conduct your own research before making any investment decisions.*
**Sources:** Reuters (Shivangi Acharya), Oct 5, 2026; Press Trust of India, Sept 19, 2026; Outlook Business, Sept 2026; Traders Union (Kpler and CREA data), Sept 2026; Kerala Kaumudi, Sept 19 and 20, 2026
**Categories:** Global News
---
### [Trump Signs AI Self-Regulation Accord With Every Major Tech CEO and Renames the Technology Super Intelligence](https://df.media/trump-ai-self-regulation-super-intelligence/)
**Published:** September 30, 2026
**Author:** Vishnu Priya
**Content:**
Markets today September 30 2026 are processing a landmark moment in the AI governance story: President Trump gathered the most powerful technology executives in America at the White House on Tuesday, signed what he called a “morally binding” accord on AI self-regulation, and officially renamed artificial intelligence “Super Intelligence” in government record-keeping.
The meeting in the East Room included Jensen Huang of Nvidia, Mark Zuckerberg of Meta, Satya Nadella of Microsoft, Sundar Pichai of Google, Jeff Bezos of Amazon, Dario Amodei of Anthropic, Alex Karp of Palantir, Elon Musk of Tesla, and OpenAI president Greg Brockman. For investors tracking AI-exposed equities, this is the moment Washington formally chose self-regulation over legislation — and markets today September 30 2026 are reacting accordingly.
## Markets Today September 30 2026: What the White House AI Accord Actually Says
Trump posted the accord to his Truth Social account as a single-page document. It commits each participating company to implement four categories of safeguards: technological controls to detect problems with new models, internal risk review processes, external auditors, and additional unspecified measures. The document notes that “it might make sense to codify these steps into laws or regulations” at a later date — language that leaves the door open to future legislation while firmly keeping government out of the room for now.
“There’s a belief that there should be tremendous self-regulation,” Trump said after the meeting. “There was a lot of commonality in this room.” For markets today September 30 2026, this is the most bullish possible policy outcome for AI-linked equities: no mandatory compliance framework, no model capability limits, no licensing regime. The companies most exposed to a regulatory crackdown — Nvidia on chips, Meta and Google on foundation models, Microsoft on AI deployment — got exactly the outcome their share prices were pricing in.
## Super Intelligence: Why Trump Renamed AI and What It Signals
One of the most striking moments on markets today September 30 2026 was Trump’s announcement that the US government would officially rename artificial intelligence “Super Intelligence” or “SI” in all federal record-keeping. “We’ve changed the name officially to SI,” Trump said. The rebranding is not cosmetic. It reflects a deliberate pivot away from the cautious language that has dominated AI policy discourse — away from “risks,” “dangers” and “alignment” — and toward a frame of American dominance and technological supremacy.
Trump was unambiguous about the stakes: “I would never stifle the growth of technology that will be bigger than the industrial revolution.” That framing — Super Intelligence as the next industrial revolution, not as an existential threat — is the ideological foundation of the self-regulation approach. For equity markets today September 30 2026, the message is clear: the administration sees winning the Super Intelligence race as a national security and economic priority, and it will not allow domestic regulation to slow that race down.
## CEO Reactions: Zuckerberg, Amodei and What the Accord Left Unresolved
Not everyone at the White House table gave the accord an unqualified endorsement on markets today September 30 2026. Meta CEO Mark Zuckerberg called it “a start” — measured language that stops well short of enthusiasm. Anthropic CEO Dario Amodei, whose essay “We Must Pace the Frontier” sparked the global AI slowdown debate earlier this month, said that “the mechanism, how we address those risks, is still under discussion.” Amodei acknowledged progress toward “both the US winning AI and also winning safely,” but was careful to emphasize that the technology still poses “real dangers.”
Amodei’s positioning is the most complex at the table. He has called publicly for a cooperative slowdown in frontier AI development. He is now a signatory to a self-regulation accord championed by a president who has explicitly ruled out government intervention. That tension — between Amodei’s stated safety concerns and the political environment he is operating in — is unresolved. For investors tracking Anthropic and the AI safety ecosystem on markets today September 30 2026, the accord is a political accommodation, not a technical solution.
## AI Czar Incoming: What Trump’s Announcement Means for Stocks
Trump also revealed on markets today September 30 2026 that he is “very close” to a decision on an AI czar — a single executive authority figure to coordinate the federal government’s Super Intelligence strategy — and will announce the appointment in the next three to four days. The creation of a dedicated AI czar role is significant regardless of who fills it. It means a single point of contact between the White House and the industry, a clearer channel for the companies that just signed the accord, and a potential accelerant for federal AI procurement and deployment.
The seat placement at the East Room meeting offers clues about who holds influence. Jensen Huang of Nvidia, Elon Musk, and Lisa Su of AMD all received prominent spots near Trump — the same three who sat at the head table with Xi Jinping at last week’s state dinner. Nvidia’s position at the centre of the AI hardware stack makes Huang the most strategically important CEO in the room for both the US-China competition and the domestic Super Intelligence race.
## The Regulatory Risk That Remains: Florida and the Incident Data
The White House accord does not eliminate all regulatory risk for AI stocks on markets today September 30 2026. Florida’s attorney general moved to challenge OpenAI in court, asking a judge to halt the training of new models unless outside safeguards are in place — a state-level intervention that the federal self-regulation framework cannot pre-empt. And a separate Axios report revealed that OpenAI, Anthropic and security researchers are actively sifting through thousands of incidents of problematic actions by AI agents — a disclosure that underscores the gap between the “morally binding” language of the accord and the operational reality of deploying frontier models at scale.
Trump addressed these concerns directly after the meeting, saying he believes AI will make the world safer and that fears about data centre costs driving up energy prices were overblown. “These new facilities are going to make communities very happy,” he said. He also committed to using the Department of Justice and FBI to “stop the bad use” of AI — framing enforcement as a law-and-order question rather than a technology regulation question. For markets today September 30 2026, that framing is consistent with a policy environment that keeps compliance costs low for the major AI companies.
## Key Stocks and What the Accord Means for Each
Here is the company-level read on markets today September 30 2026 following the White House AI accord:
| Company | CEO at White House | Accord Impact |
|---|---|---|
| Nvidia (NVDA) | Jensen Huang | No chip export limits — bullish |
| Meta (META) | Mark Zuckerberg | No model regulation — bullish |
| Microsoft (MSFT) | Satya Nadella | AI deployment headroom retained |
| Google (GOOGL) | Sundar Pichai | Self-audit vs external mandate |
| Amazon (AMZN) | Jeff Bezos | AWS AI buildout unconstrained |
| Palantir (PLTR) | Alex Karp | Government AI contracts expand |
| Tesla (TSLA) | Elon Musk | xAI development unconstrained |
| Anthropic (ANTH.PVT) | Dario Amodei | Safety concerns noted not resolved |
| AMD (AMD) | Lisa Su | AI chip demand intact |
## Markets Today September 30 2026: Bottom Line for Investors
Markets today September 30 2026 close the month with the US government having made its AI policy choice explicit. Self-regulation. No mandatory licensing. No capability limits. An AI czar incoming to coordinate federal deployment. And a president who has staked his legacy on the United States winning the Super Intelligence race.
For equity investors, this is the most permissive policy environment AI companies could have hoped for. The risk is not regulation — it is the incidents.
Thousands of AI agent problems being logged at OpenAI and Anthropic, a Florida court challenge to OpenAI’s training, and a “morally binding” accord with no enforcement mechanism are the fault lines beneath the bullish surface. If a high-profile AI failure forces the administration’s hand before the czar is even named, the self-regulation framework could unravel fast. For now, markets today September 30 2026 are trading the optimism. The incidents are tomorrow’s problem. Follow our [Markets Today September 21 2026](https://df.media/markets-today-september-21-2026-us-china-trump-xi-summit-stocks/) US-China summit coverage and [Markets Today September 17 2026](https://df.media/markets-today-september-17-2026-fed-hike-warsh-rate-4-percent/) Fed hike analysis for the full macro backdrop.
Sources: [Yahoo Finance: Trump Gathers AI Leaders, Floats Self-Regulation](https://finance.yahoo.com/news/trump-gathers-ai-leaders-self-regulation-technology-dangers.html) \| [Axios: OpenAI and Anthropic Sifting Through Thousands of AI Incidents](https://www.axios.com/2026/09/26/openai-anthropic-thousands-ai-security-incidents) \| [Tech Insider: Amodei’s We Must Pace the Frontier](https://tech-insider.org/what-amodei-actually-proposed-in-we-must-pace-the-frontier/)
**Categories:** Banking
---
### [US-China Trade Truce Extended to January 2027 as Tariff, AI and Market Talks Advance](https://df.media/us-china-trade-truce-extended-to-january-2027/)
**Published:** September 28, 2026
**Author:** Laura Anderson
**Excerpt:** US-China trade truce extended to January 10, 2027 as tariff, AI, coal, agriculture and financial talks shape global markets.
**Content:**
The **United States and China have extended their trade truce through January 10, 2027**, giving both governments additional time to implement existing arrangements and negotiate unresolved economic issues.
The extension was announced by China’s Commerce Ministry on September 28, following US President Donald Trump’s meeting with Chinese President Xi Jinping in Washington.
The latest framework covers more than tariffs. The two countries will discuss **reciprocal tariff reductions covering $30 billion of products**, establish a new trade council, create an agriculture working group, expand discussions on financial-services access, continue talks on direct flights and establish a communication channel for **artificial intelligence-related incidents**.
China has also agreed to import **US coal during 2027 and 2028**.
For global markets, the immediate significance is a reduction in near-term uncertainty around US-China trade. The extension does not resolve the broader disputes over technology, supply chains, market access and strategic economic competition.
## US-China Trade Truce: What Changed?
The latest arrangement introduces several developments:
| Area | Latest development |
|---|---|
| Trade truce | Extended through January 10, 2027 |
| Tariffs | Discussions covering $30 billion of products |
| Trade council | New mechanism for regular economic discussions |
| Agriculture | Dedicated working group to address market access and regulation |
| Coal | China to import US coal in 2027 and 2028 |
| Financial services | China to examine approvals for foreign financial institutions |
| Artificial intelligence | New communication channel for AI-related incidents |
| Aviation | Continued discussions on increasing direct flights |
The measures provide additional time for negotiations but do not constitute a comprehensive US-China trade settlement.
## When Does the US-China Trade Truce Expire?
The current [US-China trade truce](https://economictimes.indiatimes.com/opinion/et-commentary/xi-trump-summit-china-gains-diplomatic-leverage-as-us-china-trade-truce-extends-taiwan-tensions-persist/articleshow/134524139.cms?from=mdr) has been extended through **January 10, 2027**.
China’s Commerce Ministry said the extension will allow both sides to evaluate implementation of existing arrangements and continue discussions on economic and trade issues.
For companies, the additional period provides greater visibility when making decisions involving imports, exports, manufacturing, inventory and investment.
The January date is therefore an important policy checkpoint for businesses and financial markets.
## What Is the $30 Billion US-China Tariff Arrangement?
The United States and China will discuss **reciprocal tariff reductions covering approximately $30 billion of products**.
The objective is to maintain stable bilateral economic and trade relations and create better conditions for affected trade flows.
The actual economic impact will depend on which products are covered and how the tariff changes are implemented.
This is important because a targeted tariff reduction does not necessarily change the wider US-China tariff relationship.
Companies will still need to monitor product-level tariff treatment and future policy announcements.
## New US-China Trade Council Targets Investment and Trade Barriers
Washington and Beijing have agreed to create a **trade council** for regular economic discussions.
The council is expected to address:
- Investment opportunities
- Trade barriers
- Investment barriers
- Policy transparency
- Policy predictability
- Concerns raised by companies
The mechanism creates a formal channel for businesses and policymakers to discuss commercial obstacles.
Its economic significance will depend on whether those discussions lead to measurable changes in market access and investment conditions.
## US-China Agriculture Talks Get a Dedicated Working Group
Agriculture will have its own working group under the new trade council.
The first meeting is expected before the end of 2026 and will focus on **two-way agricultural market access and regulation**.
Agricultural trade has long been an important part of US-China economic relations.
Changes in market access could affect US agricultural exporters, Chinese importers, commodity markets, shipping and logistics.
For investors, the working group’s results could provide another indication of whether the latest trade arrangements are producing practical economic changes.
## China to Import US Coal in 2027 and 2028
Energy has also become part of the latest US-China trade framework.
China has agreed to import **US coal during 2027 and 2028**.
China’s Commerce Ministry said US coal would supplement domestic supplies and provide economic benefits to the US coal industry.
The agreement creates another bilateral commodity flow to monitor.
The market impact will depend on actual purchasing volumes, delivery schedules and how the trade affects existing coal supply chains.
## China to Examine Access for US-Backed Financial Institutions
Financial services are another area covered by the latest arrangements.
China said it will examine and approve foreign financial-services institutions, including institutions with US capital, to conduct business and open branches in China.
For international banks and financial companies, this could create additional opportunities to expand their operations in the Chinese market.
The development also demonstrates that US-China economic relations extend beyond merchandise trade into banking, investment and financial services.
The next issue for markets will be whether the announcement produces specific regulatory approvals.
## US-China AI Talks Create New Communication Channel
**Artificial intelligence is becoming a central part of US-China economic and technology relations.**
The United States and China have agreed to establish a communication channel for **AI-related incidents** and hold another dialogue by the end of November.
The talks take place against a wider technology relationship involving:
- AI development
- Advanced computing
- Semiconductors
- Data infrastructure
- Technology investment
- Export controls
The new communication mechanism does not remove the broader competition between Washington and Beijing over advanced technologies.
Instead, it establishes another government-to-government channel for discussing AI incidents and risks.
## Why US-China AI Talks Matter for Global Technology Markets
AI policy increasingly affects companies involved in semiconductors, cloud computing, data centers and advanced computing.
The US and China are both important markets for the global technology industry.
Consequently, developments in AI policy can have effects beyond the two countries.
The November dialogue will be important because it could show whether the new communication mechanism develops into a more regular framework.
However, AI communication should be distinguished from broader technology policy. Discussions over AI incidents do not automatically change semiconductor restrictions, export controls or other technology measures.
## US-China Supply Chains Remain a Separate Issue
The trade-truce extension may reduce immediate tariff uncertainty, but supply-chain risks remain.
Manufacturers have been reassessing their dependence on individual countries for components, raw materials and production.
Those decisions are influenced by more than tariffs.
Companies also consider:
- Export controls
- Critical minerals
- Production costs
- Logistics
- Supplier concentration
- Geopolitical risk
- Market access
As a result, an extended trade truce does not necessarily mean companies will reverse existing supply-chain diversification plans.
## What Does the US-China Trade Truce Mean for Global Markets?
The latest developments affect several market sectors.
### Global equities
Companies with significant exposure to US-China trade could benefit from greater short-term policy clarity.
The impact will vary according to each company’s products, supply chains and exposure to tariffs.
### Commodity markets
US coal exports to China create an additional commodity trade flow.
Agricultural negotiations could also affect commodity markets if the new working group produces changes in market access.
### Technology stocks
The AI dialogue introduces a new communication channel between Washington and Beijing, while wider competition over advanced technology continues.
### Financial stocks
Potential approval of foreign financial institutions could create new opportunities for international banks and financial-services companies.
### Manufacturing
Manufacturers may gain additional time to plan around tariff policy, although longer-term supply-chain strategies will depend on a broader set of economic and geopolitical factors.
## Is the US-China Trade War Over?
**No.**
The extension of the trade truce does not resolve all US-China disagreements.
The two countries continue to deal with issues involving tariffs, advanced technology, investment, supply chains and market access.
The latest framework is better understood as **an extension of negotiations and economic engagement**, rather than a permanent trade settlement.
That distinction is particularly important for businesses making long-term investment and sourcing decisions.
## What Happens Before January 10, 2027?
Several developments could shape the next phase of US-China economic relations.
### 1. Tariff implementation
Markets will need to see which products are included in the proposed $30 billion tariff arrangement.
### 2. Trade council discussions
The effectiveness of the new council will depend on whether it produces concrete changes in trade and investment conditions.
### 3. Agriculture negotiations
The first agriculture working-group meeting should provide more information about future market access.
### 4. US coal purchases
Actual Chinese purchasing volumes will determine the commercial significance of the 2027–2028 coal agreement.
### 5. Financial-services approvals
Investors will be watching for specific approvals involving foreign financial institutions.
### 6. November AI dialogue
The next AI discussion could provide more details about the new incident communication mechanism.
### 7. Direct flights
Further discussions could determine whether air connectivity between the United States and China expands.
### 8. Technology policy
Any new semiconductor, AI or advanced-computing restrictions could affect the broader economic relationship independently of the trade truce.
## What Should Businesses Monitor?
Businesses with US-China exposure should focus on **implementation rather than headline announcements**.
Importers and exporters should monitor product-specific tariff changes.
Manufacturers should continue reviewing supply-chain concentration.
Financial institutions should follow regulatory developments affecting market access.
Technology companies should separately track AI, semiconductor and advanced-computing policies.
Commodity businesses should monitor coal and agricultural trade flows.
The extended truce provides additional planning time, but it does not remove the need for companies to prepare for policy changes.
## The Bigger Economic Picture
The latest US-China framework creates additional space for economic engagement across multiple sectors.
The relationship now includes discussions covering **tariffs, agriculture, coal, financial services, aviation and artificial intelligence**.
That makes the January 10, 2027 deadline more significant than a simple tariff expiration date.
It provides a test of whether Washington and Beijing can turn a temporary reduction in trade tensions into more predictable commercial conditions.
For global markets, the central issue is therefore **implementation**.
The US-China trade truce has reduced some immediate escalation risk, but the deeper economic and technology competition remains.
The coming months will show whether the latest agreements produce a broader framework for trade and investment or another temporary pause in a relationship still shaped by competing economic and strategic interests.
## Frequently Asked Questions
### What is the latest US-China trade truce?
The United States and China have extended their trade truce through **January 10, 2027**, giving both sides additional time to implement existing arrangements and continue economic negotiations.
### When does the US-China trade truce expire?
The latest extension runs through **January 10, 2027**.
### What is the $30 billion US-China tariff agreement?
The United States and China will discuss reciprocal tariff reductions covering approximately **$30 billion of products**.
### Did Trump and Xi end the US-China trade war?
No. The Trump-Xi summit produced additional trade and economic arrangements, but wider disagreements involving tariffs, technology, supply chains and market access remain.
### What did the US and China agree about artificial intelligence?
The two countries agreed to establish a communication channel for **AI-related incidents** and hold another AI dialogue by the end of November.
### Will China import US coal?
Yes. China has agreed to import **US coal in 2027 and 2028**.
### Can US financial institutions expand in China?
China said it will examine and approve foreign financial-services institutions, including those with US capital, to conduct business and open branches in China.
### Why is the January 10, 2027 deadline important?
It provides a key checkpoint for assessing whether the latest tariff, trade, agriculture, financial-services and other negotiations have produced further concrete agreements.
### What does the US-China trade truce mean for investors?
The extension reduces some immediate trade-policy uncertainty, but investors still need to monitor tariffs, technology restrictions, supply chains, commodities, financial-services access and future negotiations.
## Key Takeaway
**The US-China trade truce now runs through January 10, 2027, while Washington and Beijing broaden economic discussions into tariffs, agriculture, coal, financial services and artificial intelligence.**
The extension gives companies additional time to plan and gives negotiators another window to address outstanding issues.
But it is **not a permanent US-China trade settlement**.
For global markets, the next phase will be defined by what Washington and Beijing actually implement between now and January.
**Categories:** Global News
---
### [US and China Called Their Talks Very Successful. Here Is What That Really Means for Global Markets.](https://df.media/markets-today-september-21-2026-us-china-trump-xi-summit-stocks/)
**Published:** September 21, 2026
**Author:** Laura Anderson
**Content:**
Markets today September 21 2026 are rallying on the most consequential geopolitical development of the year: US Treasury Secretary Scott Bessent and China’s top trade negotiator He Lifeng held talks at JPMorgan Chase headquarters in New York on Sunday, with both sides calling the discussions a success. Asian equities climbed, technology shares led the gains, wheat and corn futures surged, and S&P 500 futures pointed to a positive Wall Street open — all ahead of this week’s Trump-Xi summit that could redefine the US-China economic relationship for the rest of the decade.
## Markets Today September 21 2026: What the US-China Talks Actually Delivered
Markets today September 21 2026 are pricing in optimism, not certainty. Bessent called the discussions “very successful.” China’s Li Chenggang said they were held in a “good atmosphere.” Xinhua described the exchange as “candid, in-depth and constructive.” But beneath the diplomatic language, the concrete deliverables were narrower than the market reaction suggests. The two sides did not agree to extend the existing trade truce, according to the Financial Times. And an announcement of new US tariffs targeting excess manufacturing capacity was delayed until after the summit. The delay is good news. An extension of the truce would have been better. Markets today September 21 2026 are rallying on the delay, not a deal.
Bloomberg Economics framed the upcoming Trump-Xi meeting precisely: “a highly choreographed affair, with both sides focused on managing their rivalry rather than resolving it.” This is not a détente. It is controlled de-escalation. Both governments want to keep the relationship functional without making structural concessions on technology controls, Taiwan, and national security.
## US-China AI Dialogue: What Bessent Proposed and What It Means
The most significant new development on markets today September 21 2026 is the proposed “US-China AI dialogue.” Bessent announced that both sides agreed to create a formal channel to develop a common understanding of AI’s benefits and threats, plus a notification mechanism for AI incidents with national security implications. The initiative is aimed at managing shared risks — biological weapons, autonomous systems, AI-enabled cyberattacks — rather than imposing binding development limits on either country.
Bessent has been blunt about the stakes, warning last week that “there is no day after tomorrow” if China wins the AI race. Former US Deputy Secretary of State Kurt Campbell offered a sobering counterweight on Bloomberg TV: “They are going to be reluctant to enter into anything that would constrain Chinese actions. They fundamentally distrust the United States here.” Campbell flagged APEC in Shenzhen in November and the G20 in Florida in December as the next checkpoints where real progress on AI could be announced. On markets today September 21 2026, the AI dialogue is a confidence-building measure, not a breakthrough.
## Wheat, Corn and Soybeans: The Agricultural Trade Signal
One of the clearest market moves on markets today September 21 2026 is in agricultural commodities. Wheat and corn futures rose as traders anticipate more Chinese purchases of American farm products. China bought at least four cargoes of US soybeans last week through state-owned firms, and has now passed the halfway mark of its pledge to purchase at least 25 million tons of US soybeans annually through 2028 — part of the trade truce from the Trump-Xi summit in South Korea last October.
Agricultural trade is politically critical for the Trump administration — it directly benefits farm states that form the core of his coalition. Any signal that China intends to accelerate commodity purchases is a domestic political win regardless of what happens on technology and national security. On markets today September 21 2026, China is using agricultural purchases to demonstrate good faith without conceding anything on the issues it cares about most.
## Board of Trade and the Non-Sensitive Goods Carve-Out
US Trade Representative Jamieson Greer outlined the structural mechanism underpinning markets today September 21 2026 optimism: the two sides have “operationalized” a Board of Trade designed to ring-fence a subset of bilateral trade from future tariff escalation. The list would include consumer and low-tech goods from China, and energy, agricultural and medical products from the US — covering roughly $30 billion of products from each side.
Greer described it plainly: “There is a world where you have a relatively small subset of American and Chinese goods that can be traded in a balanced way, that are non-sensitive, that in the future, as trade actions come up, we can consider them as a class unto themselves.” For equity markets on markets today September 21 2026, this is the most practically important development. If a $30 billion bilateral trade corridor is permanently ring-fenced from tariff risk, the tail risk of a sudden trade shock — the scenario that crushed tech and industrial stocks in 2018-2019 — is structurally reduced.
## Key Market Moves: September 21 2026
Here is the full asset picture on markets today September 21 2026 following the Bessent-He Lifeng talks:
| Asset or Indicator | Move | Driver |
|---|---|---|
| Asian Equities (MSCI Asia) | Rising | US-China talks positive signal |
| Technology Shares | Leading gains | AI dialogue, tariff delay |
| S&P 500 Futures | Pointing higher | Summit optimism |
| European Futures | Pointing higher | Risk-on spread |
| Wheat Futures | Rising | Anticipated Chinese purchases |
| Corn Futures | Rising | Anticipated Chinese purchases |
| US Soybeans | China buying | 4 cargoes booked last week |
| US Excess Capacity Tariffs | Delayed | Held until after Xi summit |
## Markets Today September 21 2026: What Comes Next
Markets today September 21 2026 will watch the Trump-Xi summit with one question: does it produce anything beyond atmosphere? The structural gap on AI, Taiwan and technology controls has not narrowed. The JPMorgan talks produced goodwill and a proposed AI dialogue — but no truce extension, no binding AI agreement, and no resolution of the excess capacity tariff question. The tariff was delayed, not dropped.
The summit calendar beyond this week is as important as the meeting itself. APEC in Shenzhen in November and the G20 in Florida in December are the next real checkpoints. If both leaders leave this week’s summit without a public breakdown, markets will take it as a win. If the AI dialogue and Board of Trade mechanism survive intact to November, that is a structurally positive development for global risk assets — especially technology stocks exposed to US-China supply chain and market access risk. Follow our [Markets Today September 17 2026](https://df.media/markets-today-september-17-2026-fed-hike-warsh-rate-4-percent/) Fed hike analysis and [Markets Today September 14 2026](https://df.media/markets-today-september-14-2026-softbank-ai-openai-fed-hike/) for the full macro backdrop.
Sources: [Bloomberg: US and China Hail Talks as Positive](https://www.bloomberg.com/news/articles/2026-09-21/us-china-hail-talks-as-positive-ahead-of-trump-xi-summit) \| [Bloomberg: US Delays Excess Capacity Tariffs](https://www.bloomberg.com/news/articles/2026-09-17/us-said-to-delay-excess-capacity-tariffs-until-after-xi-summit) \| [Bloomberg: Wheat Jumps After US-China Talks](https://www.bloomberg.com/news/articles/2026-09-21/wheat-jumps-after-positive-signals-from-initial-us-china-talks)
**Categories:** Banking
---
### [Markets Today September 17 2026: Fed Hikes 25bp to 4 Percent in Unanimous Vote as Warsh Signals More to Come](https://df.media/markets-today-september-17-2026-fed-hike-warsh-rate-4-percent/)
**Published:** September 17, 2026
**Author:** Vishnu Priya
**Content:**
Markets today September 17 2026 are digesting the biggest Federal Reserve decision in three years. On Wednesday September 16, the FOMC raised the federal funds rate by 25 basis points to a target range of 3.75% to 4.00% — the first rate hike since 2023. The vote was 12 to 0. Unanimous. Not a single dissent. In July, that same committee split 9 to 3. Something changed. And what changed matters more than the quarter point itself.
## Markets Today September 17 2026: The Fed Just Rewrote the Playbook
Markets today September 17 2026 are not reacting to a 25 basis point hike. Markets are reacting to everything around it. The dot plot. The language. The tone. The unanimous vote. Fed Chair Kevin Warsh did not sound like a central banker trying to thread a needle. He sounded like one who has decided the needle needs to move further and faster.
His exact words: “price stability is foundational to economic growth.” Three months ago, the Fed’s official stance was that policy was “modestly restrictive.” On Wednesday, Warsh said the committee had removed “a dose of accommodation.” That is not a small semantic shift. That is a signal that the current rate is still below where the Fed thinks it needs to be.
For anyone tracking markets today September 17 2026, the single most important number is not 4.00%. It is 3.2% — the new longer-run neutral rate estimate in the dot plot. That rose from its prior level, which means the Fed is telling you that the world has structurally changed. Higher oil. Persistent supply shocks. Geopolitical premium baked into every inflation print. The rate that used to be “neutral” is no longer enough to cool this economy.
## What the Dot Plot Is Actually Saying
The dot plot delivered on markets today September 17 2026 is more hawkish than anything the Fed has published since the post-pandemic tightening cycle. Sixteen of eighteen FOMC participants expect at least one more rate hike before the end of 2026. Eight of those see an additional hike in 2027. The 2026 median dot moved to 4.1% from 3.8% — a 30 basis point revision in a single meeting. And the 2027 median shows zero cuts. None. The Fed is not signalling a pause and pivot. It is signalling a plateau at elevated levels.
The Fed’s 2026 core PCE inflation projection came in at 3.4% — still well above the 2% target. Former Fed Vice Chair Richard Clarida noted that this figure “may ultimately prove somewhat high, particularly given potential revisions to the underlying data.” But even with a downside revision, the trajectory does not get the Fed to 2% this year. The inflation fight is not over. The dot plot is priced accordingly.
## Bond Market Reaction: Two Verdicts, Two Different Instruments
The bond market reaction on markets today September 17 2026 tells a precise story about what investors believe. The 2-year Treasury yield went into the Fed decision down 3 basis points on the day. It came out up 5 basis points. A 9 basis point swing in a matter of hours. The front end believed every word Warsh said. The 2-year is the instrument most sensitive to near-term Fed policy, and it repriced sharply higher — telling you that markets now take the next hike seriously.
The 10-year yield told a different story on markets today September 17 2026. It went into the meeting below 5%. It traded back through the 5% level and ended flat on the day. That divergence — front end rises, long end stays flat — reflects genuine market uncertainty about the growth outlook. The Fed may be able to hike again. Whether the economy can absorb it without breaking is a separate question. The flat long end is the bond market’s polite way of saying: we are not convinced this ends well.
## What 12 to 0 Means and Why July’s 9 to 3 Matters
The vote on markets today September 17 2026 was 12 to 0. In July, the same committee voted 9 to 3 — three dissenters who wanted to hold. Every one of those three moved to the hiking camp between July and September. That shift was driven by three data inputs Warsh cited explicitly in his press conference: a strengthening economy, inflation running above the 2% target, and geopolitical “hot spots” — the Iran oil disruption and Saudi pipeline attack that pushed Brent crude above $108 and embedded an energy premium into every CPI print this quarter.
Unanimity matters in central banking. A split committee signals internal doubt, leaves room for a pivot, and gives markets an escape valve. A unanimous committee sends a different message entirely: we have all looked at the same data and we are all in agreement. No dissent. No hedge. The market response on markets today September 17 2026 reflects that clarity — uncertainty has collapsed in one direction. The next hike is not a question of if, it is a question of when.
## What This Means for Equities, Bonds, and Bitcoin
On markets today September 17 2026, equity markets are processing a rate environment that looks nothing like 2024. The S&P 500 is under pressure from a simple arithmetic: when risk-free rates move to 4.00% and the dot plot points to 4.25% or higher, the multiple on future earnings compresses. Every analyst model that was built on a 3.5% terminal rate needs to be rebuilt. That is not a small adjustment.
For Bitcoin and crypto, markets today September 17 2026 are particularly challenging. Bitcoin has tracked closer to a long-duration growth asset than a safe-haven in this cycle. When real yields rise, crypto underperforms. With the 10-year at 5% and the Fed signalling no cuts through 2027, the bid underneath Bitcoin weakens. The $76,000 to $77,000 range that held through last week looks increasingly fragile if equities sell off sharply on the post-hike repricing.
For bond investors, the 2-year at current levels offers the most attractive risk-adjusted return in years. Cash earns 4.00% with zero duration risk. Short-duration bond funds outperform in an environment where the long end is flat and the front end is pricing further tightening. The classic 60/40 portfolio is not dead — but the 40 side needs to be positioned short, not long.
## Key Data: The September 16 Fed Decision at a Glance
| Metric | Before | After |
|---|---|---|
| Fed Funds Rate | 3.50 to 3.75% | 3.75 to 4.00% |
| FOMC Vote | 9-3 (July) | 12-0 unanimous |
| 2026 Median Dot | 3.8% | 4.1% |
| Longer-Run Neutral Rate | Prior estimate | 3.2% (revised up) |
| Core PCE Projection 2026 | Prior estimate | 3.4% |
| 2027 Rate Cuts Priced | Some | Zero |
| 2-Year Treasury Yield | -3bp on day | +5bp after decision |
| 10-Year Treasury Yield | Below 5% | Back through 5%, flat |
## Markets Today September 17 2026: What Comes Next
Markets today September 17 2026 are now pricing a 4.25% terminal rate as the base case, with the next decision on November 4-5. The Fed will receive two more CPI prints, one more jobs report, and a full quarter of earnings data before that meeting. If oil stays above $100 and core services inflation does not break lower, the November hike is close to a done deal. If oil drops sharply — either from a Hormuz resolution or demand destruction — the Fed has room to pause without losing credibility, given the unanimous September vote demonstrated its commitment.
For investors navigating markets today September 17 2026, the framework is clear: the Fed has told you exactly what it intends to do. Believe it. Position accordingly. Energy stocks retain their inflation hedge value. Short-duration fixed income earns real returns. High-multiple growth stocks face continued multiple compression. And any asset — crypto, speculative tech, long-duration bonds — that was priced on a rate cut cycle remains structurally challenged until the dot plot changes. Right now, it is not changing.
For the lead-up to this decision, read our [Markets Today September 14 2026](https://df.media/markets-today-september-14-2026-softbank-ai-openai-fed-hike/) preview and the [Markets Today September 11 2026](https://df.media/markets-today-september-11-2026-cpi-yields-oil-bitcoin-fed/) CPI breakdown that set the stage for Wednesday’s unanimous vote.
Sources: [Bloomberg: Fed Raises Rates as Warsh Contains Inflation](https://www.bloomberg.com/news/articles/2026-09-16/fed-raises-rates-as-warsh-bucks-trump-to-contain-inflation) \| [Federal Reserve: FOMC Statement September 16 2026](https://www.federalreserve.gov/newsevents/pressreleases/monetary20260916a.htm) \| [WSJ: Fed Raises Rates for First Time in Three Years](https://www.wsj.com/economy/central-banking/fed-raises-rates-for-first-time-in-three-years-08539fbe)
**Categories:** Banking
---
### [Two London AI Startups Raise 42 Million in 48 Hours: Jack and Jill Disrupts Hiring, Quartz Takes On Private Banking](https://df.media/london-ai-startups-jack-jill-quartz-september-2026/)
**Published:** September 17, 2026
**Author:** Vishnu Priya
**Content:**
London AI startups September 2026 just delivered one of the fastest fundraising sequences the UK tech scene has seen this year. Jack and Jill, the dual-agent AI recruitment platform, closed a $40 million Series A on September 15. Quartz, the AI-powered personal banking app built for everyone locked out of private wealth management, raised £2.75 million on September 16. Two entirely different industries. Two fundamentally broken systems. Two AI-native solutions funded in 48 hours. This is not coincidence — it is the London AI playbook playing out in real time.
## Jack and Jill: The AI Recruiter That Raised 40 Million Dollars
Among the most ambitious London AI startups, Jack and Jill operate AI agents on opposite sides of the hiring table simultaneously. Jack works exclusively for the job seeker. Jill works exclusively for the employer. They do not share information with each other — instead, each agent learns what its principal actually wants through extended conversation, not what they claim to want on a CV or job description. An introduction only happens when both agents independently determine that both sides would take the call. No application. No CV screening. No automated rejection. No silence.
The results on the platform to date are striking. London AI startups September 2026 rarely produce traction numbers this concrete at Series A: 350,000 registered candidates, 5,000 companies using the platform, and 25,000 interviews arranged. One candidate spoke to Jack 144 times. Collectively, candidates have spent 12,000 hours in conversation with the Jack agent. That is not a vanity metric. It is evidence that the current hiring system has failed people so thoroughly they will invest hours talking to an AI to find a way around it.
The $40 million raise at this stage of product development signals investor conviction that the dual-agent architecture is the right model for AI-mediated labour markets. Traditional job boards monetise applications. Jack and Jill monetise outcomes — specifically, introductions that both sides wanted. The incentive alignment is structurally different from every incumbent in the space.
## Why the Hiring System Needed Replacing, Not Improving
The 12,000 hours figure is the most important datapoint in the Jack and Jill story. Job seekers are not spending hours talking to Jack because it is convenient. They are doing it because the alternative — uploading a CV, waiting weeks, receiving no feedback, then repeating across dozens of portals — has become so demoralising that an AI agent willing to listen and advocate feels meaningfully better. Among London AI startups September 2026, few have identified a pain point this visceral or this large.
For employers, Jill addresses a different failure mode. Job descriptions are aspirational documents, not accurate specifications of what a hiring manager actually needs. Jill’s conversations extract the real requirements — seniority signals, culture fit indicators, timeline urgency — and matches against candidates whose revealed preferences, as expressed to Jack, align with those requirements. The result is a 25,000-interview track record from a pool of 350,000 candidates and 5,000 companies: a conversion rate that traditional ATS platforms cannot approach.
## Quartz: Private Banking Access With No Minimum Balance
Quartz is solving a different access problem. UK private banks require between £750,000 and £3 million in investable assets before they assign you a personal banker — someone who actively manages your whole financial picture rather than answering reactive customer service queries. Quartz removes that minimum entirely. Its app connects your pensions, ISAs, savings accounts and investments into a single unified view and gives you Charlie, an AI personal banker that provides the continuous whole-wealth attention that has historically been available only to the genuinely wealthy.
The £2.75 million raise — modest by London AI startups standards — is a pre-product seed designed to build and launch. The founding team carries exceptional credibility: executives from Revolut and N26, the two most successful European neobanks of the past decade. The investor base is similarly well-positioned. Daphni, the Paris-based venture fund with a strong fintech track record, led the round. Angels include the founder of Kantox, the FX management platform that sold to BNP Paribas for €120 million — someone who has built, scaled and exited a financial infrastructure business to a Tier 1 bank.
As one of the standout London AI startups September 2026, Quartz is entering a market where the competitive moat is trust, regulation and data integration — precisely the areas where a Revolut and N26 alumni team has an edge over pure AI startups that lack financial services depth.
## Key Deal Data: Jack and Jill and Quartz September 2026
| Company | Raise | Date | Sector | Notable Backers |
|---|---|---|---|---|
| Jack and Jill | $40 million | September 15 2026 | AI Recruitment | Series A investors TBC |
| Quartz | £2.75 million | September 16 2026 | AI Wealth Management | Daphni, Kantox founder |
## The London AI Startups September 2026 Playbook
What connects Jack and Jill and Quartz is not the sector — recruitment and private banking are entirely different industries. What connects them is the thesis. Both companies identified markets where the incumbent experience is not just suboptimal but actively exclusionary. Job seekers are excluded from quality hiring conversations by gatekeeping CV systems. Most people are excluded from quality financial advice by arbitrary asset minimums. Both companies built AI-native products that do not digitise the incumbent model — they replace the underlying interaction entirely.
This is the pattern emerging across London AI startups September 2026. The most fundable companies are not building AI wrappers around existing SaaS workflows. They are identifying interactions that have historically been reserved for the privileged — whether that privilege is a strong network, a prestigious CV, or a seven-figure portfolio — and making those interactions available to everyone through AI agents that can operate at scale without increasing marginal cost. Jack gives every job seeker a personal advocate. Charlie gives every saver a personal banker. The addressable markets in both cases are enormous.
## Why These Deals Matter for UK Startup Investors
The 48-hour window in which both London AI startups closed their raises is notable not because of its speed — venture rounds rarely happen literally overnight — but because of what it signals about investor appetite for London AI startups September 2026 in the current macro environment. Global markets are under pressure: the 10-year Treasury yield is at 4.95%, the Federal Reserve hiked rates on September 16, and risk appetite is compressed across public markets. Against that backdrop, the willingness to deploy capital into pre-revenue or early-revenue AI plays speaks to the quality of the teams and the clarity of the problem being solved.
For UK founders watching these London AI startups succeed, the lesson is precise. Investors in September 2026 are not funding ideas or technology for its own sake. They are funding specific, named failures in large markets, attacked by teams with direct operational experience in the sector they are disrupting, using AI architectures that make the economics of personalised service viable at population scale. Jack and Jill and Quartz both meet that standard exactly.
For the broader macro context shaping the investment environment around London AI startups September 2026, see our [Markets Today September 14 2026 analysis](https://df.media/markets-today-september-14-2026-softbank-ai-openai-fed-hike/) covering SoftBank, OpenAI and the AI slowdown debate, and our [Markets Today September 11 2026 CPI report](https://df.media/markets-today-september-11-2026-cpi-yields-oil-bitcoin-fed/).
Full original story: [BestStartup UK: Jack and Jill $40M and Quartz £2.75M](https://beststartup.co.uk/jack-jill-40m-quartz-275m-london-ai-startups-september-2026/)
## London AI Startups: The Broader Context for September 2026
London AI startups are raising against a backdrop of global macro turbulence. The Federal Reserve hiked rates on September 16. Brent crude is above $108. Public market valuations are compressed. And yet London AI startups with clear problem-solution fit and experienced founding teams are finding capital without difficulty. Jack and Jill and Quartz both raised in days, not months — a signal that specialist investors are actively deploying into the London AI startups cohort regardless of the broader risk-off environment in public markets.
The UK’s regulatory environment also plays a role. The FCA’s sandbox approach to fintech experimentation, the relative depth of London’s financial services talent pool, and the concentration of global recruitment operations in the city give London AI startups a structural advantage in both the sectors these two companies are targeting. Expect more raises from London AI startups in Q4 2026 as the cohort that raised pre-product seed rounds in 2025 begins moving toward Series A.
**Categories:** Banking
---
### [Markets Today September 14 2026: SoftBank Crashes 11 Percent as AI Slowdown and Fed Hike Fear Rattle Global Markets](https://df.media/markets-today-september-14-2026-softbank-ai-openai-fed-hike/)
**Published:** September 14, 2026
**Author:** Vishnu Priya
**Content:**
Markets today September 14 2026 opened the week with a double shock: SoftBank shares cratered 11% in Tokyo after OpenAI confirmed it will not pursue a 2026 IPO, and Anthropic CEO Dario Amodei called for a global slowdown in AI development — knocking the wind out of the one narrative that has powered equity markets all year. Layered on top: Brent crude is above $108 a barrel after a Saudi pipeline attack, the 10-year Treasury yield is at 4.95%, and the Federal Reserve decision on September 16 is now priced at 86% probability of a rate hike. This is the most consequential week for global markets in 2026.
## Markets Today September 14 2026: SoftBank Crashes 11 Percent After OpenAI Kills IPO
The biggest single-stock story on markets today September 14 2026 is SoftBank Group, which fell as much as 13% in Tokyo before settling down 11%. The catalyst: OpenAI CEO Sam Altman told Fortune magazine that a 2026 public listing is “off the table” and would be “ill-advised” while the company works through safety concerns. SoftBank has bet $64.6 billion on OpenAI and holds roughly a 13% stake. The company must also repay $25.9 billion of a bridge loan used to finance that position on Tuesday, September 15 — meaning this week’s market conditions could not have come at a worse time for Masayoshi Son.
Markets today September 14 2026 saw the blow ripple across the AI investment complex. The Nikkei 225 slid 2%, MSCI Asia Pacific fell 0.6%, and South Korea’s Kospi dropped 2.8% as SK Hynix and Samsung Electronics — both critical AI memory chip suppliers — lost more than 3.5% each. Nasdaq 100 futures are down 1.2% and S&P 500 futures are off 0.5% heading into the US open.
## AI Leaders Call for Development Slowdown: Market Impact
Anthropic CEO Dario Amodei issued a formal call to slow AI development on Sunday, citing potential existential risks. Within hours, OpenAI’s Sam Altman and Google DeepMind head Demis Hassabis expressed support. Elon Musk also added his voice. On markets today September 14 2026, this coordinated message from four of the most powerful figures in frontier AI is repricing the entire growth narrative in real time.
The AI trade has powered global equities through 2025-2026. Nvidia crossed a $4 trillion market cap on chip demand, cloud hyperscalers poured hundreds of billions into data centre buildouts, and every major index benefited. Analysts at Barclays estimate AI-related capex accounts for roughly 18% of S&P 500 capital spending in 2026. Any meaningful slowdown would hit earnings materially and compress the multiples that depend on continued AI investment growth.
## Fed Hike Odds at 86 Percent Before Wednesday Decision
Markets today September 14 2026 carry the Federal Reserve’s shadow into every asset class. Fed funds futures price an 86% probability of a 25-basis-point rate hike at the September 16 FOMC meeting, which would take the target range from 3.50-3.75% to 3.75-4.00%. August CPI confirmed inflation has not cooled: oil above $108 adds a direct energy surcharge to every cost input in the US economy, and last week’s PPI at 5.4% annually underscored that producer prices are still rising fast. The current rate has held at 3.50-3.75% for five consecutive meetings.
The Fed’s updated dot plot, released alongside Wednesday’s decision, will be scrutinized for whether the committee signals “hike and hold” or opens the door to November. Either way, the 10-year yield at 4.95% means the equity risk premium for the S&P 500 is near its lowest level since 2007. On markets today September 14 2026, equities are being squeezed from both sides: higher rates compress multiples, and AI slowdown fears cut earnings growth projections.
## Oil at 108 Dollars as Saudi Pipeline Attack Adds New Risk
Brent crude is trading at $108.20 per barrel on markets today September 14 2026 — a new cycle high — after a Saudi pipeline was struck over the weekend, threatening a loss of up to 4% of global oil supply. The attack comes alongside continued Hormuz disruption from the US-Iran maritime conflict. ANZ analysts warn that if both outages persist through October, Brent could reach $115-$120 before OPEC+ can offset the lost barrels.
High oil compounds every macro problem. It feeds CPI directly, constraining the Fed’s ability to pause. It squeezes consumer spending at a time when real wages are already under pressure. And it raises the operating cost of the AI data centres that technology companies have been building at record pace — a further headwind for the very sector that is also grappling with the IPO and slowdown news today.
## Bitcoin at 76 500 Dollars as Risk Off Takes Hold
On markets today September 14 2026, Bitcoin is trading near $76,500 — down about 1.5% over 24 hours. The risk-off tone, dollar strength from Fed hike expectations, and the 10-year yield near 5% are all headwinds for crypto. Bitcoin trades increasingly like a long-duration growth asset in institutional portfolios: when real yields rise, it underperforms. Ethereum is down 2.3% to $2,840. Crypto-related equities including Coinbase and MicroStrategy are tracking lower with Nasdaq futures in pre-market trading.
## Key Market Data: September 14 2026
Here is the snapshot across major assets for markets today September 14 2026:
| Asset or Indicator | Level | Move |
|---|---|---|
| S&P 500 Futures | -0.5% | Risk-off tone |
| Nasdaq 100 Futures | -1.2% | AI selloff |
| Nikkei 225 | -2.0% | SoftBank drag |
| 10-Year Treasury Yield | 4.95% | Near 5% critical level |
| Brent Crude | $108.20/bbl | Saudi pipeline attack |
| Bitcoin (BTC) | ~$76,500 | Risk-off |
| Fed Hike Odds Sept 16 | 86% | CPI and PPI confirmed |
| SoftBank 9984 | -11% | OpenAI IPO cancelled |
| USD/JPY | ~153 | Dollar firm on Fed |
## What to Watch on Markets Today September 14 2026 and This Week
Markets today September 14 2026 open one of the most event-dense weeks of the year. The Bank of Japan is expected to raise rates to 1.25% — its own response to yen weakness and imported inflation from high oil. The Fed decision on September 16 at 2:00 PM ET will be accompanied by updated economic projections and the dot plot. Fed Chair Powell’s press conference at 2:30 PM ET is the single most watched event of 2026. Any signal of “one and done” could trigger a sharp relief rally; further tightening talk accelerates the selloff in bonds and equities alike.
Also on the calendar: US retail sales on Tuesday, UK CPI on Wednesday, and continued monitoring of the Saudi pipeline situation. If repairs take more than two weeks, oil could sustain its move toward $115, keeping inflation expectations elevated heading into Q4 earnings season.
## Markets Today September 14 2026: Bottom Line for Investors
Markets today September 14 2026 represent a genuine inflection point for the 2026 bull case. The AI growth narrative — the single biggest driver of equity returns in the past two years — is now under coordinated pressure from the very people who built it. Oil is at a cycle high. The Fed is almost certain to hike Wednesday. Bond yields are a single bad data point away from 5%, which would force a major repricing of every equity multiple on Wall Street.
Defensive positioning makes sense this week: energy exposure retains value while oil is elevated, short-duration bonds outperform in a volatile yield environment, and cash earns 3.75% with near-zero duration risk. The next 72 hours — Wednesday’s Fed decision above all — will determine whether markets today September 14 2026 marked the start of a new leg lower or a near-term buying opportunity. For the full inflation backdrop, read our [Markets Today September 11 2026](https://df.media/markets-today-september-11-2026-cpi-yields-oil-bitcoin-fed/) coverage and the [Markets Today September 10 2026](https://df.media/markets-today-september-10-2026-stocks-yields-fed-bitcoin/) rate shock analysis.
Sources: [Bloomberg Markets Wrap September 14 2026](https://www.bloomberg.com/news/articles/2026-09-13/us-stock-futures-fall-on-ai-warning-oil-gains-markets-wrap) \| [Parameter: SoftBank Plunges on OpenAI IPO](https://parameter.io/softbank-9984-shares-plunge-11-as-openai-abandons-2026-ipo-timeline/) \| [CNBC: Stock Market Outlook Sept 14-18 2026](https://www.cnbc.com/2026/09/11/stock-market-next-week-outlook-for-sept-14-18-2026.html) \| [IG: Week Ahead September 14 2026](https://www.ig.com/ae/news-and-trade-ideas/week-ahead--14-september-2026-260911)
**Categories:** Banking
---
### [Markets Today September 11 2026: CPI Report at 8:30 AM as Yields Hit 4.96% and Brent Tops $107](https://df.media/markets-today-september-11-2026-cpi-yields-oil-bitcoin-fed/)
**Published:** September 11, 2026
**Author:** Vishnu Priya
**Content:**
Markets today September 11 2026 are on a knife-edge: the August CPI report drops at 8:30 AM ET and it will either lock in a Federal Reserve rate hike on September 15 or give the market a brief reprieve. Brent crude has surged above $107 a barrel after US forces destroyed five Iranian tankers this week, the 10-year Treasury yield is touching 4.96% — just four basis points from the psychologically critical 5% level — and Bitcoin is hovering at $77,200 waiting for the inflation print to set its direction. This is the most important morning for US markets in 2026. What happens on markets today September 11 2026 will set the tone for the rest of Q3.
## Markets Today September 11 2026: Everything Hinges on 8:30 AM
The most important data release on markets today September 11 2026 is the August CPI report — the single most consequential data point before the September 15-16 Federal Reserve meeting. Market consensus calls for headline CPI to rise 0.4% month over month, leaving annual inflation at 3.4%. Core CPI is expected at 0.2% MoM, with the annual rate edging down slightly to 2.4% from 2.5% in July. A print at or above those levels — especially after August PPI came in at 5.4% annually, up sharply from 4.8% — would almost certainly cement a 25-basis-point hike next week. A meaningful undershoot could shift the calculus back toward a hold, though the window for that is narrowing fast.
## 10 Year Treasury Yield at 4.96%: Approaching 5% for the First Time Since 2023
The bond market alarm is the defining backdrop for markets today September 11 2026. The 10-year Treasury yield rose 18 basis points this week to 4.96% on Friday — the highest level since 2023 and just four basis points away from the 5% threshold that would mark a significant psychological and technical milestone. The global bond selloff is being driven by three compounding forces: hot PPI data, surging oil prices from the US-Iran conflict, and investor demand for higher yields to compensate for elevated inflation risk. MSCI’s Asia Pacific Index fell 1.7% on Thursday — its steepest single-day drop in three weeks — as the rising yield environment rippled through global equity markets.
Markets today September 11 2026: a breach of 5% on the 10-year would carry real consequences. It would further compress equity multiples, particularly in the Nasdaq and high-multiple growth names. It would increase the US government’s borrowing costs on the trillions in debt it needs to roll over. And it would signal to the Fed that the bond market — independent of central bank action — is tightening financial conditions on its own.
## Fed Hike Odds Hit 70% After Hot PPI
Markets today September 11 2026 show Fed funds futures now implying a 70-71% chance the Fed would hike — a complete reversal from Jackson Hole when markets priced a 70% chance the Fed would hold. That has completely flipped. Fed funds futures now imply a 70-71% probability of a 25-basis-point rate hike at the September 15-16 FOMC meeting, up from 59% earlier this week, after August PPI came in at 5.4% annually — well above the 4.8% reading in July. New York Fed President John Williams set the tone: “If inflation comes in hot, I would consider a rate hike.” Today’s CPI print will either confirm or complicate that framing.
The Fed is in a structurally difficult position on markets today September 11 2026. The main inflation drivers — energy prices from the Iran war and tariff pass-through — are supply-side shocks that monetary policy cannot directly resolve. Hiking rates slows demand but does nothing to reopen the Strait of Hormuz or reverse tariff policy. Yet the Fed cannot afford to be seen ignoring inflation either, especially with the 10-year yield threatening 5%. The September 15 decision will define the Fed’s credibility for the remainder of 2026 and well into 2027.
## Brent Crude Above $107 After US Destroys Five Iranian Tankers
The biggest commodity story on markets today September 11 2026: the oil price surge stems from the US-Iran maritime conflict that escalated sharply on Tuesday when US military forces destroyed five Iranian crude oil tankers in retaliation for attempted attacks on an American warship. Brent crude surged above $107 a barrel on Thursday — a new high for this conflict cycle — adding fresh inflationary pressure on top of already-elevated energy costs. The Strait of Hormuz continues to operate at a fraction of its normal capacity, with Kpler data showing tanker traffic near its lowest levels since May. Iran has signaled it will announce a formal restricted maritime zone outside the strait, which could push Brent toward $110 or higher if implemented.
As of markets today September 11 2026, ANZ analysts expect Iranian oil exports to remain constrained through the rest of 2026. OPEC+ declined to increase production at its September Sunday meeting, offering no supply buffer. The oil story has months left to run and is the single most powerful variable feeding US and global inflation right now.
## Bitcoin at $77,200: Hot CPI or Cool CPI Decides the Next Move
On markets today September 11 2026, Bitcoin briefly dipped below $77,000 after the hot August PPI print earlier this week, recovering to approximately $77,200 at the time of writing. BTC has traded in a $76,670 to $78,520 range over the past 24 hours — a tight band that reflects the market’s reluctance to commit to a direction before the CPI data. The binary outcome is clear: a hot CPI print above 3.4% annual would cement the Fed hike and likely push Bitcoin toward the $74,000-$75,000 range. A cool undershoot could trigger a relief rally back toward $80,000, the level Bitcoin failed to reclaim after August’s 25% surge.
On markets today September 11 2026, Fundstrat’s Tom Lee has maintained his $150,000 Bitcoin target contingent on a “hike-and-done” signal from the Fed, arguing that clarity on the rate path — even if it means one more hike — would ultimately be bullish for hard assets. For now, the $77,000 level is the line in the sand. Bitcoin ETF inflows have slowed as macro uncertainty peaks, but institutional positioning has not reversed.
## Oracle Beats: The One Bright Spot
Markets today September 11 2026 is not all red: Oracle reported stronger-than-expected cloud revenue growth in after-hours trading on Wednesday, offering a rare bright spot in a risk-off week. The result reinforces the broader AI infrastructure spending thesis — enterprise demand for cloud compute and AI workloads remains strong even as the macro backdrop deteriorates. Oracle joins Nvidia in demonstrating that the AI capex cycle has not slowed, even as equity markets struggle under rising rates and oil prices.
## Key Market Data: September 11 2026
The snapshot of markets today September 11 2026, ahead of the CPI print at 8:30 AM ET:
| Asset / Indicator | Level | Direction |
|---|---|---|
| 10-Year Treasury Yield | 4.96% | ↑ Highest since 2023 |
| Brent Crude | $107+ /barrel | ↑ New conflict high |
| Bitcoin (BTC) | ~$77,200 | → Watching CPI |
| Fed Hike Odds (Sept 15) | 70-71% | ↑ After hot PPI |
| August CPI (expected) | 3.4% annual | Due 8:30 AM ET today |
| August PPI (actual) | 5.4% annual | ↑ vs 4.8% in July |
| MSCI Asia Pacific | -1.7% (Thu) | ↓ Steepest drop in 3 weeks |
| Oracle Cloud Revenue | Beat estimates | ↑ After-hours |
## What Traders Are Watching Today
- August CPI at 8:30 AM ET: Above 3.4% = near-certain hike. Below 3.2% = hold scenario reopens. This is the number of the week
- 10-year yield at 5%: A breach of this level intraday would trigger equity selling across growth and tech
- Bitcoin $77K: Key support — a sustained break below on a hot CPI print would target $74K-$75K
- Brent crude $110: Watch for Iran’s restricted zone announcement which could push oil to a new high
- Oracle follow-through: Can AI/cloud stocks hold gains against the macro headwind?
- Fed pre-meeting blackout: FOMC members cannot speak publicly after today — this is the last window for guidance before September 15
For the full context on this week’s market deterioration, see our [Markets Today September 10 2026](https://df.media/markets-today-september-10-2026-stocks-yields-fed-bitcoin/) recap on the third consecutive day of stock losses, and [Markets Today September 7 2026](https://df.media/markets-today-september-7-2026-oil-iran-hormuz-canada/) on the Hormuz ship strikes that started this oil surge.
Follow coverage of markets today September 11 2026 via: [Bloomberg — Global Bond Selloff Sends 10-Year Yields to Cusp of 5%](https://www.bloomberg.com/news/articles/2026-09-11/global-bond-selloff-sends-10-year-treasury-yields-to-cusp-of-5) \| [KuCoin — US CPI Report September 11](https://www.kucoin.com/news/flash/us-cpi-report-on-september-11-to-influence-fed-policy-and-crypto-markets) \| [TradingKey — Bitcoin drops on PPI beat](https://www.tradingkey.com/analysis/cryptocurrencies/btc/262162311-crypto-bitcoin-btc-ppi-cpi-fed-fomc-tradingkey)
## Markets Today September 11 2026: Bottom Line for Investors
Markets today September 11 2026 present a rare triple-threat setup: an inflation print that moves Fed policy, an oil shock that adds to that inflation, and a bond market already pricing in the worst. Investors waiting for a clear signal will get one by 9:00 AM ET — either CPI misses to the downside and risk assets rally hard, or it confirms the 0.4% consensus and the Fed hikes September 15 with near-certainty.
Equity futures are flat on markets today September 11 2026, reflecting genuine uncertainty, not complacency. The key question for long-term holders is not the immediate price reaction but whether the Fed can engineer a soft landing with Brent above $100. History says that task is nearly impossible. Stay positioned defensively in energy and short-duration bonds. The next 90 minutes define the trading week — and possibly the next quarter.
### What is the August CPI expected to show on September 11 2026?
Consensus expects headline CPI at 3.4% annually (0.4% MoM) and core CPI at 2.4% annually (0.2% MoM). August PPI already came in hot at 5.4% annually, raising the risk of an above-consensus CPI print that would lock in a Fed rate hike on September 15.
### What are the Fed rate hike odds for September 15 2026?
Fed funds futures are pricing a 70-71% probability of a 25-basis-point rate hike at the September 15-16 FOMC meeting, up from 59% earlier in the week after the hot PPI report. Today’s CPI data is the final major input before the decision.
### Why is the 10 year Treasury yield near 5%?
The 10-year yield rose to 4.96% — its highest since 2023 — driven by hot PPI data, surging oil prices from the US-Iran conflict, and increased Treasury supply. A breach of 5% would be a major psychological and market milestone.
### Where is Bitcoin on September 11 2026?
Bitcoin is trading around $77,200, having briefly dipped below $77,000 after the hot PPI print. The key levels to watch are $77K support on the downside and $80K resistance on the upside, with today’s CPI report likely to decide the near-term direction.
**Categories:** Banking
---
### [Markets Today September 10 2026: Stocks Fall for Third Day as Yields Hit 19-Month High](https://df.media/markets-today-september-10-2026-stocks-yields-fed-bitcoin/)
**Published:** September 10, 2026
**Author:** Vishnu Priya
**Content:**
Markets today September 10 2026 are under sustained pressure for a third consecutive session: the S&P 500 fell 0.48% to 7,636, the Nasdaq dropped 0.64%, the 10-year Treasury yield just hit 4.857% — its highest level since November 2023 — and the Federal Reserve’s September 15 rate decision is now five days away with a 59% probability of a hike priced in. Here is the complete picture of what is moving US finance today.
## Markets Today September 10 2026: Three Days of Losses and Counting
Wednesday marked the third straight session of declines across all three major US indexes. The Dow Jones Industrial Average dropped 405 points, or 0.77%. The S&P 500 shed 0.48%, closing at 7,636.36. The Nasdaq Composite fell 0.64% to 26,253.34. The twin forces driving the selloff are the same ones that have dominated markets all month: rising Treasury yields and escalating oil prices from the US-Iran conflict, both of which feed directly into inflation expectations and the Fed’s September 15 calculus.
## 10-Year Treasury Yield Hits 4.857%: Highest Since November 2023
The 10-year Treasury note yield jumped to 4.857% on Wednesday — the highest level since November 2023 — after the US Treasury Department announced it would triple its buyback operation of longer-dated government debt to $6 billion. The 30-year yield is also pushing higher, tightening the financial conditions that growth and tech stocks depend on. This is not just a bond market story: rising real yields mean a higher discount rate on future earnings, which mechanically compresses equity valuations, particularly for high-multiple names in the Nasdaq.
The yield move is significant because it happened without a catalyst from the Fed itself. It was a Treasury supply signal — the government needs to finance more debt at longer maturities — and that is pushing rates higher independent of whatever the Fed decides on September 15. Investors are now contending with both monetary tightening (potential Fed hike) and fiscal pressure (Treasury issuance) simultaneously.
## Fed Rate Hike September 15: 59% Probability and Climbing
Fed funds futures are pricing a 59% probability that the Federal Reserve will hike interest rates by 25 basis points at its September 15-16 meeting. That number has been climbing steadily since Fed Chair Kevin Warsh’s hawkish Jackson Hole speech shifted market expectations from a 70% chance of a hold to a majority probability of a hike. New York Fed President John Williams added more fuel this week, stating: “If inflation comes in hot, I would consider a rate hike” — pointing directly to this week’s August CPI and PPI data as the decisive inputs.
The biggest inflation drivers according to the San Francisco Federal Reserve are “acyclical factors” — residual tariff impacts and higher energy prices from the Iran war. These are supply-side pressures that rate hikes cannot easily fix, which is why the Fed is in a difficult position. Hiking into a supply shock risks slowing the economy without meaningfully reducing inflation. Not hiking risks unanchoring inflation expectations. Either way, the September 15 decision will define the Fed’s credibility for the rest of 2026.
August CPI data — the single most important piece of economic data before the Fed meeting — is due this week. A hot reading above consensus would almost certainly lock in a hike. A cool reading might keep the rate on hold at the current 3.50%–3.75% range. Markets are on edge.
## Oil and Iran: The Inflation Driver Markets Cannot Control
Brent crude remains elevated above $97 a barrel as US-Iran strikes on vessels in and around the Strait of Hormuz continue to escalate. Last week alone, Brent rose 7.8% and WTI gained nearly 10%. Hormuz tanker traffic fell to just 10 ships per day — the lowest since May — after the US struck three Iranian oil tankers and Iran’s IRGC retaliated by targeting six vessels on Saturday, September 6. Iran has also signaled it will announce a restricted maritime zone outside the strait within days.
ANZ analysts expect Iranian oil exports to remain constrained through the rest of 2026, with a full return to pre-war throughput not expected until late Q1 or early Q2 2027. OPEC+ held its October output policy unchanged at its Sunday meeting, removing any near-term production buffer. The oil story is not going away — and as long as energy prices stay elevated, the Fed’s inflation fight stays harder.
## Bitcoin at $78,136: Holding Steady Ahead of Fed Week
Bitcoin was trading at $78,136 as of September 9, slightly above the $77,900 level from earlier in the week. The crypto market is in a holding pattern ahead of the Fed decision — neither selling off aggressively nor rallying. August was Bitcoin’s strongest month of 2026 with a 25% gain driven by spot ETF inflows and CLARITY Act optimism, but September has been flat to slightly down as risk-off sentiment and rate hike fears weigh on the asset class. The key technical level to watch is $77,000 — a sustained break below that ahead of September 15 could signal a more significant correction.
Fundstrat’s Tom Lee has maintained his $150,000 price target for Bitcoin, contingent on the Fed delivering a “hike-and-done” signal at September 15 that clarifies the rate path going forward. Hard assets like Bitcoin and gold tend to outperform once rate uncertainty resolves, regardless of the direction of the hike itself.
## Canada: Tariff Retaliation Hits and Bank of Canada Holds
Canada moved forward with retaliatory measures against US 50% tariffs on September 8, adding pressure to North American manufacturing, automotive, and agricultural supply chains. The Bank of Canada held its policy rate at 2.25% at its September 2 meeting, noting that “upside risks to inflation have increased” while new US tariffs make growth prospects more uncertain. The Bank’s next scheduled rate decision is October 28, 2026. The loonie has been under pressure, and Canadian equities in tariff-exposed sectors are underperforming.
## Key Market Data: September 10 2026
| Asset / Indicator | Level | Direction |
|---|---|---|
| S&P 500 | 7,636.36 | ↓ -0.48% |
| Nasdaq Composite | 26,253.34 | ↓ -0.64% |
| Dow Jones | -405 pts | ↓ -0.77% |
| 10-Year Treasury Yield | 4.857% | ↑ Highest since Nov 2023 |
| Brent Crude | $97+ /barrel | ↑ |
| Bitcoin (BTC) | $78,136 | → Holding |
| Fed Hike Odds (Sept 15) | 59% | ↑ |
| Fed Funds Rate (current) | 3.50%–3.75% | Hold (for now) |
| Bank of Canada Rate | 2.25% | Hold |
## What Traders Are Watching This Week
- August CPI report: The single most important data point before September 15 — a hot reading locks in a Fed hike, a cool reading keeps a hold in play
- August PPI data: Producer prices feed into future consumer inflation — another read the Fed will use to calibrate its decision
- Treasury yields: The 10-year approaching 4.9% is the key level — breaching it could accelerate equity selling
- Iran restricted zone announcement: Any formal maritime exclusion zone declaration will push Brent toward $100 and spike inflation expectations further
- Bitcoin $77K support: The line between pre-Fed consolidation and a sharper risk-off selloff
- Canada retaliation fallout: Sector-specific damage to auto, agriculture, and manufacturing supply chains will take time to price in
For the full context on how we got here, see our recent recaps: [Markets Today September 7 2026](https://df.media/markets-today-september-7-2026-oil-iran-hormuz-canada/) on the Hormuz ship strikes and [Markets Today September 2 2026](https://df.media/markets-today-september-2-2026-iran-war-oil-fed-hike-bitcoin/) on the Fed hike odds shift post-Jackson Hole.
For live market data and Fed rate tracking, see [Yahoo Finance live markets](https://finance.yahoo.com/markets/live/stock-market-today-wednesday-september-2-dow-sp-500-nasdaq-082624175.html) and [CNBC stock market live updates](https://www.cnbc.com/2026/09/08/stock-market-today-live-updates.html).
### Why are US stocks falling on September 10 2026?
US stocks fell for a third consecutive session as the 10-year Treasury yield hit 4.857% — a 19-month high — after the Treasury tripled its debt buyback operation. Rising yields compress equity valuations, with the S&P 500 down 0.48% and the Nasdaq down 0.64%.
### What are the Fed rate hike odds for September 15 2026?
Fed funds futures are pricing a 59% probability of a 25-basis-point rate hike at the September 15-16 Fed meeting. NY Fed President John Williams said he would consider a hike if August inflation comes in hot. August CPI data this week is the key trigger.
### Where is Bitcoin trading on September 10 2026?
Bitcoin is trading at approximately $78,136, holding steady above the key $77K support level ahead of the September 15 Fed decision. The crypto market is in a wait-and-see mode after a strong 25% August rally.
### Why are Treasury yields rising in September 2026?
The 10-year Treasury yield rose to 4.857% after the US Treasury announced it would triple its buyback of longer-dated debt to $6 billion, increasing supply pressure. Rising oil prices and Fed rate hike expectations are adding further upward pressure on yields.
---
### [Markets Today September 7 2026: Oil Hits $97.50 as US and Iran Exchange Ship Strikes](https://df.media/markets-today-september-7-2026-oil-iran-hormuz-canada/)
**Published:** September 7, 2026
**Author:** Vishnu Priya
**Content:**
Markets today September 7 2026 are opening to a dramatically changed oil market: Brent crude is at $97.48 a barrel and climbing after the United States and Iran exchanged direct strikes on commercial vessels over the weekend, driving Hormuz tanker traffic to its lowest level since May. With Canada set to retaliate against US tariffs tomorrow and the Fed’s September 15 meeting now eight days away, this is the most consequential Monday for global markets in months.
## Markets Today September 7 2026: The Weekend That Changed Oil Markets
The US-Iran maritime conflict entered a dangerous new phase on Saturday. US Central Command confirmed that American forces struck three Iranian oil tankers, including one off the coast of Kharg Island — Iran’s key oil export hub. In retaliation, Iran’s Islamic Revolutionary Guard Corps (IRGC) navy said it targeted three oil tankers travelling through unauthorized routes in the Strait of Hormuz, plus three additional US vessels in other areas. Six vessels struck in a single day. Maritime intelligence firm Marisks called it a “major escalation in the maritime conflict.”
“Commercial tankers are now being deliberately used as instruments of reciprocal economic pressure, substantially weakening the previous distinction between military confrontation and commercial shipping,” Marisks said.
## Brent at $97.48 After the Worst Week for Oil Supply in Years
Brent crude futures climbed $1.20, or 1.25%, to $97.48 a barrel by early Monday morning. US West Texas Intermediate (WTI) rose $1.14, or 1.25%, to $92.62. But these Monday gains are only the latest chapter in a brutal week for energy markets: Brent rose 7.8% last week and WTI gained nearly 10% as US-Iran strikes on vessels caused a measurable reduction in oil flows through the Strait of Hormuz.
The Strait of Hormuz is the world’s most critical energy chokepoint. Roughly one-fifth of the global oil supply used to transit through it daily. That volume is now shrinking fast. Data from analytics firm Kpler showed that an average of just 10 commodity ships transited the strait per day over the past 10 days — the lowest level since May.
“If tanker traffic begins to slow materially, the market could price in a much larger supply shock. And there are already signs that this is happening,” said Priyanka Sachdeva, head of market insights at Phillip Nova.
## Iran Plans a Restricted Zone Outside the Strait
The situation is set to deteriorate further. Mohsen Rezaei, secretary of Iran’s Supreme National Security Council, said on Sunday that a restricted zone will be announced outside the Strait of Hormuz within days, according to Iranian state media. That announcement alone could push Brent toward $100 a barrel or beyond, as it would effectively formalize Iran’s control over an expanded maritime exclusion area that catches vessels rerouting around the strait.
ANZ analysts described the most likely scenario as “a prolonged standoff, punctuated by calibrated military action by the US and Iran.” They expect Iranian oil exports to remain constrained through the rest of 2026, with a gradual reopening only possible late in Q4 2026. A full return to pre-war throughput is not expected until late Q1 or early Q2 2027 — meaning this supply shock has months left to run.
## OPEC+ Holds Output Unchanged for October
OPEC+ met on Sunday and kept its oil output policy unchanged for October. The group said it needs to agree on new quotas before deciding its next production steps. The decision to hold — rather than increase supply to offset the Iran disruption — removes a potential price ceiling for crude. With Hormuz throughput at May lows and OPEC+ standing pat, the supply-demand math for oil is turning sharply more bullish heading into the fall.
## Canada Retaliates Against US Tariffs Tomorrow
Monday’s oil story is not the only geopolitical risk in play. Canada is set to announce retaliatory measures against US 50% tariffs on September 8 — tomorrow. North American supply chains, particularly in automotive, agriculture, and manufacturing, are directly in the crossfire. Canadian equities and the loonie will be under pressure today as markets price in the retaliation before the announcement. This US-Canada trade war has been escalating since summer and represents a separate but compounding risk for North American equities already under pressure from oil and rising yields.
## Fed, Bitcoin and Stocks with 8 Days Until September 15
The Federal Reserve’s September 15 meeting is now eight days away. As of last week, CME FedWatch was pricing a 66% probability of a 25-basis-point rate hike. The oil surge only adds to that pressure: energy-driven inflation makes it harder for the Fed to justify a hold. The 10-year Treasury yield has been climbing — sitting at 4.79% as of Friday — and is likely to push higher again today given the weekend escalation.
Bitcoin was trading near $77,900 heading into the weekend, down from its August peak near $80K. A risk-off Monday with surging oil and rising yields is not a constructive setup for crypto. The $77K support level remains key — a break below could accelerate selling in the week leading into the Fed decision. Equities face a similar dynamic: the S&P 500 and Nasdaq were already under pressure last week, and the oil shock adds a new inflation layer that the market has not yet fully priced.
## Key Market Data for September 7 2026
| Asset / Indicator | Level | Move |
|---|---|---|
| Brent Crude | $97.48 /barrel | ↑ +1.25% (+7.8% last week) |
| WTI Crude | $92.62 /barrel | ↑ +1.25% (+10% last week) |
| Hormuz Daily Ship Transits | ~10 ships/day | ↓ Lowest since May |
| Fed Hike Odds (Sept 15) | 66% | ↑ vs 30% pre-Jackson Hole |
| 10-Year Treasury Yield | 4.79% | ↑ |
| Bitcoin (BTC) | ~$77,900 | ↓ from $80K Aug peak |
| Canada Tariff Retaliation | Sept 8 | Tomorrow |
| OPEC+ October Output | Unchanged | No supply increase |
## What Traders Are Watching Today
- Iran restricted zone announcement: Any formal declaration of a maritime exclusion zone outside the Strait of Hormuz will immediately push Brent toward $100
- Hormuz tanker traffic: Daily ship counts from Kpler are the real-time gauge of supply disruption severity
- Canada retaliation details on September 8: The specific sectors targeted will determine which North American equities move hardest
- Fed commentary: Any FOMC member remarks before the September 15 media blackout period will move rate hike odds
- Bitcoin $77K support: Watch this level as the line between consolidation and a sharper pre-Fed selloff
- Nvidia and AI stocks: AI infrastructure demand remains strong but rising rates and oil are a headwind for multiples
For context on how this escalation developed through last week, see our [Markets Today September 2 2026 recap](https://df.media/markets-today-september-2-2026-iran-war-oil-fed-hike-bitcoin/) and [Markets Today August 26 2026](https://df.media/markets-today-august-26-2026-nvidia-earnings-pce-inflation-bitcoin-jackson-hole/) on Nvidia earnings and Jackson Hole.
Source reporting: [Reuters — Oil extends gains after US and Iran exchange attacks on ships](https://www.reuters.com/business/energy/oil-extends-gains-after-us-iran-strike-ships-2026-09-07/) by Florence Tan and Sam Li, September 7 2026.
### Why is oil near $97.50 today September 7 2026?
Brent crude rose to $97.48 a barrel after the US struck three Iranian oil tankers on Saturday and Iran retaliated by targeting six vessels in and around the Strait of Hormuz. Hormuz tanker traffic fell to its lowest level since May, raising fears of a prolonged supply disruption.
### What happened at the Strait of Hormuz over the weekend?
US Central Command struck three Iranian oil tankers on Saturday including one near Iran’s Kharg Island oil hub. Iran’s IRGC navy retaliated by targeting three oil tankers and three US vessels. Only 10 commodity ships per day are now transiting the strait, the lowest since May, per Kpler data.
### What did OPEC+ decide for October 2026?
OPEC+ kept its oil output policy unchanged for October at a Sunday meeting, declining to increase production to offset the Iran-related supply disruption. The group said it needs to agree on new quotas before deciding next steps.
### When does Canada retaliate against US tariffs?
Canada is set to announce retaliatory measures against US 50% tariffs on September 8, 2026, putting North American automotive, agricultural, and manufacturing supply chains under immediate pressure.
**Categories:** Banking
---
### [Markets Today September 2 2026: Iran War Drives Oil Past $95 as Fed Hike Odds Hit 66%](https://df.media/markets-today-september-2-2026-iran-war-oil-fed-hike-bitcoin/)
**Published:** September 2, 2026
**Author:** Laura Anderson
**Content:**
Markets today September 2 2026 are opening under significant pressure: Brent crude has crossed $95 a barrel, the Federal Reserve’s September 15 meeting is now priced as more likely than not to deliver a rate hike, and Bitcoin is pulling back from its best August ever. Meanwhile, Nvidia just delivered a $96.2 billion quarter that beat Wall Street by a wide margin. Here is the full breakdown of what is moving global finance this Wednesday.
## Markets Today September 2 2026: The Overnight Snapshot
While US investors slept, three major developments shifted the market outlook for the week. Fresh US-Iran military escalation sent Brent crude above $95 a barrel. The IRGC threatened to block commercial shipping through the Strait of Hormuz, rattling Asian energy markets. And Treasury yields continued their climb: the 10-year hit 4.79% and the 30-year touched 5.27%, compressing valuations across growth and tech stocks.
Asian equities fell broadly. European markets opened in the red. US futures pointed lower ahead of the open, with the Invesco QQQ Trust (QQQ) down 0.59% in premarket. Inflation expectations over a one-year horizon have crept up to 2.5%, and investors are recalibrating their entire rate and risk model for the fall.
## Oil Tops $95 as Iran War Escalates
Brent crude punched through $95 a barrel overnight as the US-Iran conflict entered a dangerous new phase. A US submarine reportedly sank an Iranian warship, triggering immediate IRGC threats to block the Strait of Hormuz — the chokepoint through which 20% of global oil flows each day. WTI crude gained more than 3% in early Asian trading, and traders are now pricing in the possibility of Brent reaching $109 or higher if shipping through the Gulf is fully disrupted.
President Trump offered naval escorts for commercial vessels transiting the Persian Gulf, and Treasury Secretary Scott Bessent outlined additional stabilization measures for Gulf energy markets. But traders are not convinced the risk is contained. This supply shock is arriving at the worst possible time: US consumer prices are up 3.4% year over year, and the Fed’s preferred PCE measure sits at 3.7%. A sustained oil surge feeds directly into headline and core inflation — exactly the signal the Fed is watching ahead of September 15.
Energy stocks are the lone standout in an otherwise weak tape. Major oil producers and refiners are outperforming as the crude price surge flows directly to margins. For the broader market, this is a stagflationary warning: rising input costs at a time when rate-sensitive sectors are already under pressure from climbing yields.
## S&P 500 and Nasdaq Under Pressure as Bond Yields Climb
The S&P 500 fell 0.7% and the Nasdaq Composite dropped 1.3% on Tuesday, and US equity futures are pointing lower again on Wednesday. The 10-year Treasury yield at 4.79% and the 30-year at 5.27% are functioning as a ceiling on equity multiples, particularly for tech and growth stocks valued on long-duration cash flows. The QQQ was down 0.59% in premarket.
One-year ahead inflation expectations have climbed from under 2% in recent weeks to 2.5%, a move that directly affects how bond markets price Fed policy. Rising real yields are attracting capital away from equities and into fixed income, adding another layer of pressure on already-stretched tech valuations. Defensive sectors — utilities, consumer staples, energy — are outperforming on a relative basis, while semiconductors and software are lagging.
## Fed Rate Hike September 15: Odds Now at 66%
Before Jackson Hole, markets priced a 70% probability that the Fed would hold rates steady at the September 15 meeting. That has now completely reversed. Fed Chair Kevin Warsh used his keynote at the annual Jackson Hole symposium to signal he was “committed to fighting inflation,” and futures markets responded by pricing a 66% probability of a 25-basis-point hike per CME FedWatch. Prediction markets on Kalshi put the odds at 48%, but the direction of travel is clearly toward a hike.
Two forces have lowered the bar for the Fed to act. First, the ongoing Iran conflict is keeping energy prices elevated, making it harder for headline inflation to fall toward the 2% target. Second, the Fed’s decision to hold rates in July — when many expected a hike — eroded confidence in the institution’s willingness to act preemptively. Warsh’s Jackson Hole remarks appear designed to restore that credibility before the September decision.
The September 15 decision will be the most closely watched Fed meeting of 2026. A hike would mark a resumption of the tightening cycle after July’s pause. A hold would be seen as dovish capitulation in the face of energy-driven inflation, potentially damaging the Fed’s credibility further. Either way, the next two weeks are the most important for markets this year.
## Nvidia Crushes Earnings: Revenue of $96.2 Billion and Stock Up 8.7%
Nvidia reported $96.2 billion in Q2 FY27 revenue on August 26, up 106% year over year and well above the $92.2 billion consensus estimate. Earnings per share came in at $2.22 against a $2.09 estimate. Gross margins expanded to 75.0%, up from 72.7% a year ago. The stock jumped 8.7% the following session — its best single-day gain since April 2025. With Nvidia controlling an estimated 80 to 90% of the AI accelerator market, the result confirmed that enterprise and hyperscaler AI spending is still accelerating at a remarkable pace.
The results matter well beyond Nvidia itself. The company’s earnings are a real-time indicator of how much capital Microsoft, Alphabet, Amazon, and Meta are directing toward AI infrastructure. A $96 billion revenue quarter means those capex budgets are not just holding but growing. The broader AI trade remains cautious given rising rates and geopolitical risk, but Nvidia has now delivered four consecutive quarters of triple-digit revenue growth.
## Bitcoin Slides to $78K as September Opens Soft
Bitcoin opened September at around $78,500, sliding toward $77,900 as risk-off sentiment and rising rate expectations weighed on crypto assets. August was Bitcoin’s best month of the year — prices rose 25% — driven by optimism around the Trump administration’s CLARITY Act and record inflows into spot Bitcoin ETFs. That momentum has not carried into September.
The macro setup entering September is less friendly: a 66% probability of a Fed hike on September 15, oil-driven inflation, and rising real yields all weigh on risk assets including crypto. Fundstrat’s Tom Lee maintains his $150,000 price target, arguing that a hike-and-done scenario would ultimately be bullish for hard assets like Bitcoin. For now, $77K is the key support level — a sustained break below it could accelerate selling going into the Fed meeting.
## Key Market Data for September 2 2026
| Asset / Indicator | Level | Direction |
|---|---|---|
| Brent Crude | $95+ /barrel | ↑ +3%+ |
| WTI Crude | ~$90 /barrel | ↑ +3% |
| 10-Year Treasury Yield | 4.79% | ↑ |
| 30-Year Treasury Yield | 5.27% | ↑ |
| S&P 500 (Tue close) | -0.7% | ↓ |
| Nasdaq (Tue close) | -1.3% | ↓ |
| Bitcoin (BTC) | ~$77,900 | ↓ |
| Fed Hike Odds (Sept 15) | 66% | ↑ |
| Nvidia Q2 FY27 Revenue | $96.2B | ↑ +106% YoY |
## What Traders Are Watching Today
- Oil and Strait of Hormuz: Any IRGC escalation or de-escalation signal will immediately move energy and broader risk markets
- Bond yields: The 10-year holding above 4.79% is the main pressure point for equity valuations heading into the open
- Fed speakers: Any additional FOMC commentary ahead of September 15 will move rate hike odds sharply
- Bitcoin: Watch the $77K support level — sustained selling below it could trigger a move toward $74K before the Fed meeting
- AI and tech stocks: Post-Nvidia follow-through and whether enterprise optimism can hold against the rising rate backdrop
- US-Canada trade: Canada retaliates September 8, which could add further supply chain pressure to North American equities
For context on last week’s catalysts — Nvidia earnings day, PCE inflation, and the start of Jackson Hole — see our [Markets Today August 26 2026 recap](https://df.media/markets-today-august-26-2026-nvidia-earnings-pce-inflation-bitcoin-jackson-hole/).
For live oil market coverage on the Iran escalation, see [Al Jazeera’s oil prices tracker](https://www.aljazeera.com/news/2026/7/8/oil-prices-surge-as-us-strikes-iran-reversing-fall-to-pre-war-levels) and [Yahoo Finance live markets coverage](https://finance.yahoo.com/markets/live/stock-market-today-wednesday-september-2-dow-sp-500-nasdaq-082624175.html).
### Why is oil above $95 today September 2 2026?
Brent crude surged past $95 a barrel after the US-Iran conflict escalated, with the IRGC threatening to block the Strait of Hormuz, through which 20% of global oil flows. A US submarine reportedly sank an Iranian warship, triggering the surge.
### What are the Fed rate hike odds for September 15 2026?
Following Kevin Warsh’s hawkish speech at Jackson Hole, CME FedWatch futures now price a 66% probability of a 25-basis-point rate hike at the September 15 Fed meeting. Before Jackson Hole, odds of a hold were near 70%.
### What did Nvidia earn in Q2 FY27?
Nvidia reported $96.2 billion in Q2 FY27 revenue, up 106% year over year, with EPS of $2.22, both beating Wall Street estimates. The stock jumped 8.7% after the August 26 report.
### Where is Bitcoin trading on September 2 2026?
Bitcoin is trading around $77,900, down from its August high near $80K, as rising Fed rate hike odds and risk-off sentiment weigh on crypto prices. Key support is at $77K.
**Categories:** Banking
---
### [Oil Prices Rise as US-Iran Tensions Push Global Stock Markets Lower](https://df.media/oil-prices-rise-as-us-iran-tensions-push-global-stock-markets-lower/)
**Published:** September 1, 2026
**Author:** Laura Anderson
**Content:**
**Oil prices climbed on Tuesday, September 1, 2026, as renewed US-Iran tensions raised concerns about energy supplies and a wider escalation of the Iran conflict.** Crude oil gained around 1.5%, extending the previous session’s increase of more than 2%.
At the same time, global stock markets mostly moved lower as investors assessed the potential economic impact of higher energy costs, renewed geopolitical risks and inflation ahead of the next US Federal Reserve policy meeting.
The **Strait of Hormuz** remains the biggest concern for energy markets because prolonged disruption in the strategic waterway could affect global oil supplies and send crude prices significantly higher.
## Why Are Oil Prices Rising?
The latest increase in **oil prices** is largely linked to renewed military activity between the United States and Iran.
The United States reportedly carried out strikes on Iran’s Larak Island on Sunday. US officials said the operation targeted rocket launchers and was intended to prevent Iran from placing mines in the Strait of Hormuz.
Iran responded by targeting US military positions in Jordan and the United Arab Emirates.
The exchange of attacks came after several weeks of relative calm, increasing fears that the **Iran conflict** could enter another period of escalation.
US President Donald Trump has warned that Washington would respond strongly to further Iranian action.
For oil traders, the key issue is whether the latest confrontation remains limited or develops into a broader conflict capable of disrupting energy transportation.
## Why Is the Strait of Hormuz Important?
The **Strait of Hormuz** is a strategically important waterway connecting the Persian Gulf with the Gulf of Oman and international shipping routes.
Any prolonged disruption could have significant consequences for the global economy.
A major disruption could lead to:
- Higher crude oil prices
- Increased gasoline and diesel costs
- Higher shipping expenses
- Greater inflationary pressure
- Increased manufacturing costs
- Pressure on airline and transportation businesses
- Changes in central bank interest-rate expectations
This is why investors are closely monitoring developments around the waterway.
Even the possibility of prolonged disruption can cause traders to price additional geopolitical risk into energy markets.
## How Much Have Oil Prices Increased?
Both major crude oil benchmarks gained approximately **1.5% on Tuesday**, following increases of more than 2% during the previous trading session.
The consecutive gains indicate that traders are becoming increasingly concerned about the potential impact of renewed **US-Iran tensions** on global energy supplies.
However, the longer-term direction of oil prices will depend on whether the situation escalates further.
A diplomatic breakthrough could reduce the geopolitical premium currently reflected in crude prices. Further military action or disruption to shipping could have the opposite effect.
## How Could the Iran Conflict Affect Inflation?
The **Iran conflict** could increase inflation if it causes oil prices to remain elevated for an extended period.
Crude oil affects a wide range of industries. Higher energy costs can increase transportation, manufacturing, logistics and production expenses.
Businesses may eventually pass some of these additional costs on to consumers.
That creates a difficult environment for central banks because higher energy prices can slow economic growth while simultaneously increasing inflation.
For investors, the combination of higher inflation and weaker growth is particularly concerning.
## What Are US Officials Saying About Iran?
The Trump administration is continuing to apply both economic and strategic pressure on Tehran.
US Treasury Secretary Scott Bessent said Washington would continue exerting pressure on Iran and indicated that the campaign could reach an important turning point within weeks or months.
The administration has increasingly focused on economic pressure alongside military deterrence.
The latest exchange of attacks, however, demonstrates that the risk of further escalation remains.
Markets are therefore watching for signs of renewed negotiations as well as any additional military activity.
## Why Are Global Stock Markets Falling?
**Global stock markets** mostly declined on Tuesday as investors reacted to geopolitical uncertainty and higher oil prices.
Asian markets including Tokyo, Hong Kong, Shanghai, Sydney, Singapore, Mumbai, Bangkok and Wellington moved lower.
However, Seoul, Taipei, Manila and Jakarta recorded gains.
European markets were also mixed.
London stocks declined after reopening following a long weekend, while Frankfurt also moved lower. Paris edged higher.
The market reaction reflects concerns that sustained increases in energy prices could affect corporate earnings, consumer spending and economic growth.
## What Does the US-Iran Conflict Mean for Investors?
The main concern for investors is the possibility of a prolonged energy shock.
If **US-Iran tensions** remain elevated but shipping through the Strait of Hormuz continues without major disruption, markets may eventually stabilise.
However, a significant interruption to energy transportation could produce a much stronger reaction.
The potential chain reaction is straightforward:
**US-Iran tensions → energy supply concerns → higher oil prices → increased inflation → pressure on interest rates → potential weakness in global stock markets.**
The actual impact will depend on the severity and duration of any disruption.
## What Is Trump Doing About US Gas Prices?
Higher energy prices are also becoming an important issue in the United States.
President Trump is expected to meet oil refining executives as his administration looks for ways to address rising domestic gasoline prices.
The issue could become increasingly significant ahead of the November US midterm elections.
The administration therefore faces a delicate balancing act: maintaining pressure on Iran while attempting to prevent geopolitical tensions from driving US fuel prices substantially higher.
## What Happens Next for Oil Prices?
The direction of **oil prices** will depend heavily on developments surrounding the **Iran conflict** and the Strait of Hormuz.
Three possible scenarios are being watched by markets:
### 1. Diplomatic De-escalation
If Washington and Tehran return to meaningful negotiations, geopolitical risk could decline and oil prices could come under pressure.
### 2. Continued Limited Conflict
If military exchanges remain contained, oil markets could remain volatile while traders assess the risk of further escalation.
### 3. Major Escalation
A broader conflict or serious disruption to the Strait of Hormuz could create a much larger energy-market shock and push crude prices significantly higher.
## What Should Investors Watch This Week?
Investors are likely to focus on several developments:
- New US-Iran military activity
- Conditions around the Strait of Hormuz
- Crude oil price movements
- US inflation data
- Employment and economic indicators
- Federal Reserve interest-rate expectations
- US gasoline prices
- Developments in Iran-related negotiations
The Federal Reserve’s September 16 meeting is particularly important because policymakers will be assessing the latest inflation and economic data.
## Frequently Asked Questions
### Why are oil prices rising today?
Oil prices are rising because renewed US-Iran tensions have increased concerns about potential disruptions to energy supplies and shipping through the Strait of Hormuz.
### Why is the Strait of Hormuz important to oil markets?
The Strait of Hormuz is a major energy transportation route. Any prolonged disruption could reduce the flow of oil to international markets and increase crude prices.
### Are global stock markets falling because of the Iran conflict?
The Iran conflict is one of the factors affecting global stock markets. Investors are also responding to higher oil prices, inflation concerns and uncertainty about interest rates.
### Could US-Iran tensions increase inflation?
Yes. If US-Iran tensions cause oil prices to remain high, higher transportation and production costs could increase inflationary pressure.
### Will oil prices continue to rise?
Oil prices could remain volatile. Further escalation around the Strait of Hormuz could push prices higher, while diplomatic progress could reduce the geopolitical risk premium.
### When is the next Federal Reserve meeting?
The Federal Reserve’s next policy meeting is scheduled for September 16, 2026. Investors will be watching inflation and economic data ahead of the meeting.
## Key Takeaways
- **Oil prices** gained around 1.5% on September 1, extending the previous day’s rally.
- Renewed **US-Iran tensions** have increased concerns about global energy supplies.
- The **Strait of Hormuz** remains a critical risk for international oil markets.
- The **Iran conflict** could increase inflation if energy prices remain elevated.
- **Global stock markets** mostly declined as investors assessed geopolitical and economic risks.
- The Federal Reserve’s September 16 meeting could provide another major market catalyst.
- US gasoline prices are becoming an increasingly important economic and political issue.
**Categories:** Banking
---
### [Markets Today August 26 2026: Nvidia Earnings Day, PCE Inflation Drops and Bitcoin Holds 79K as Jackson Hole Begins](https://df.media/markets-today-august-26-2026-nvidia-earnings-pce-inflation-bitcoin-jackson-hole/)
**Published:** August 26, 2026
**Author:** Vishnu Priya
**Content:**
**Markets today August 26, 2026** are defined by two events that could move every major asset class simultaneously: Nvidia reports its most anticipated earnings in history after the close today, and the US government releases the July PCE inflation reading at 8:30 AM ET. Add in Bitcoin holding near $79,000 after a stunning 23% weekly rally, a full-scale US-Canada trade war escalating fast, and the Jackson Hole symposium kicking off tomorrow — and this is one of the most consequential days in markets this year.
## Market Scorecard for August 26 2026
| Asset | Level | Move |
|---|---|---|
| S&P 500 | 7,677 | ▲ 0.32% yesterday |
| Nasdaq Composite | 26,151 | ▲ 0.66% yesterday |
| Nasdaq-100 Futures | Near flat | ▼ 0.2% premarket |
| Bitcoin (BTC) | ~$79,000 | Slight pullback |
| Core PCE Expected | 3.0% YoY | Data at 8:30 AM ET |
| Nvidia Revenue Estimate | $92.2B | Reports after close |
| Oil | Easing | Inflation relief |
| Gold | Elevated | Near 3-month highs |
## Nvidia Reports Today and the Entire Market Is Watching
Nvidia releases its fiscal Q2 2027 earnings after the market close today, and this is the most watched earnings report of 2026. Analysts forecast revenue of **$92.2 billion**, up 97% year over year, and EPS of $2.09, nearly double the prior year. Full-year guidance is expected in the $103 billion to $105 billion range.
The challenge for Nvidia is not whether it can beat the numbers — it is whether it can beat the expectations baked into those numbers. A clean beat with strong AI chip demand signals could reignite the Nasdaq rally. A miss or cautious guidance could send tech stocks sharply lower. Markets have already seen Intuit slide 10% in premarket today — a reminder of how unforgiving earnings season can be when expectations run high. Nvidia faces infinitely more scrutiny.
## PCE Inflation at 8:30 AM Could Decide the September Rate Hike
The Federal Reserve’s preferred inflation measure — the Personal Consumption Expenditures index — is released at 8:30 AM ET today. Core PCE is expected at **3.0% year over year** for July, slightly above June’s 2.9%. Tariff-driven price pressures from the US-Canada trade war are expected to keep inflation well above the Fed’s 2% target for months ahead.
Markets currently price roughly a 40% probability of a September 16 rate hike. A hotter-than-expected PCE reading today could push those odds above 50%, strengthening the dollar and pressuring both equities and crypto. A softer reading eases hike fears and supports gold and bonds. This number sets the tone for everything that follows this week including Warsh’s keynote Friday.
## Bitcoin Holds Near 79K After a Historic 23 Percent Weekly Rally
Bitcoin is trading just under **$79,000**, pulling back slightly after one of its most explosive weekly surges of 2026. President Trump met with crypto executives last week and publicly pushed Congress to pass the **CLARITY Act**, a landmark regulatory framework for digital assets. That regulatory clarity drove Bitcoin up 23% in a single week and lifted the entire crypto market.
Ethereum and Solana slipped about 4% today as traders banked gains from the weekly rally. Bitcoin is holding its ground and the key test comes from today’s PCE data and Friday’s Warsh speech. A hawkish surprise on either could push BTC back below $75,000. A benign outcome keeps the path open toward $82,000 to $85,000.
## US-Canada Trade War Escalates With Carney Declaring Economic War
President Trump imposed **50% tariffs on $20 billion in Canadian goods** after trade talks collapsed. Canadian Prime Minister Mark Carney declared that Canada is “at war” with the United States and announced matching retaliatory tariffs effective September 8. Canada will double tariffs on American steel and aluminium to 50% and add levies on approximately 700 other US products.
This escalation adds structural inflationary pressure to the US economy at exactly the wrong moment. Higher import costs from America’s largest trading partner feed directly into consumer prices, complicating the Fed’s path and making rate cuts in 2026 even less likely. The Canadian dollar weakened on the news as the trade standoff enters its most dangerous phase yet.
## Jackson Hole Starts Tomorrow With Warsh on Stage Friday
The Jackson Hole Economic Symposium runs August 27 to 29, 2026, with Fed Chair Kevin Warsh delivering his **first keynote as Fed chair on Friday August 28**. Bloomberg describes the event as offering “Warsh a prime stage to rebut his critics” following months of controversy over Fed policy and the Treasury’s surprise bond buyback expansion. Warsh is expected to focus on balance sheet reduction rather than give explicit rate forward guidance — but any signal on September hike odds will instantly move markets.
## Oil Eases and Gives Inflation Bulls a Moment to Breathe
Oil prices pulled back today after the initial Iran sanctions shock on Monday, giving equity markets a small relief valve. Asian stocks rose on the easing crude prices as lower oil directly reduces near-term inflation expectations. Brent crude remains elevated versus pre-Iran-ceasefire levels, but today’s dip is a marginal positive for stocks and the Fed’s inflation fight heading into the PCE print.
## What Happens Next
- **Today 8:30 AM ET:** July PCE inflation data
- **Today after close:** Nvidia Q2 FY27 earnings
- **Tomorrow Aug 27:** Jackson Hole begins
- **Friday Aug 28:** Fed Chair Warsh first Jackson Hole speech
- **September 8:** Canada retaliatory tariffs take effect
- **September 16:** Federal Reserve rate decision
## Frequently Asked Questions
### What time does Nvidia report earnings today August 26 2026?
Nvidia reports fiscal Q2 2027 earnings after the close on August 26, 2026, around 4:20 to 4:30 PM Eastern Time. Analysts expect $92.2 billion in revenue and EPS of $2.09, nearly double year over year.
### What is PCE inflation expected to show today?
Core PCE is expected at 3.0% year over year for July 2026, released at 8:30 AM ET on August 26. A reading above 3.0% would push September Fed rate hike odds above 40% and pressure risk assets.
### Why did Bitcoin rally 23 percent last week?
Bitcoin surged 23% last week after President Trump met with crypto executives and pushed the CLARITY Act through Congress, providing regulatory clarity for digital assets. Institutional buying accelerated on the news, pushing Bitcoin to $79,000.
### What is the US-Canada trade war status today?
The US imposed 50% tariffs on Canadian goods in August 2026. Canada announced matching retaliatory tariffs effective September 8, 2026, covering steel, aluminium and 700 other products. PM Carney called it a state of economic war between the two countries.
**Stay ahead of every market move.** [Bookmark Daily Finance](https://df.media) for real-time market data, earnings coverage and the financial analysis that matters every trading day.
**Categories:** Banking
---
### [Markets Today August 24 2026: Gold at a 3-Month High as Iran Sanctions and Nvidia Shake Markets](https://df.media/markets-today-august-24-2026-gold-iran-nvidia/)
**Published:** August 24, 2026
**Author:** Laura Anderson
**Content:**
**Markets today August 24, 2026** are opening the week with gold surging to a three-month high, oil easing on profit-taking ahead of landmark Iran sanctions, and the entire investment world pivoting toward two events that could define the rest of the year: Nvidia earnings on Wednesday and Federal Reserve Chair Kevin Warsh’s address at the Jackson Hole symposium on Friday.
## Market Scorecard for August 24 2026
| Asset | Level | Change |
|---|---|---|
| Spot Gold | $4,643.63/oz | ▲ 0.9% |
| Gold Futures (US) | $4,699.10 | ▲ 0.4% |
| Silver | $69.03/oz | ▲ 0.1% |
| Platinum | $1,887.28 | ▲ 0.5% |
| Palladium | $1,353.34 | ▲ 0.3% |
| Oil (Brent) | Slipping | ▼ profit-taking |
| US Dollar Index | Near multi-month lows | ▼ weakening |
| Fed Rate Hike Odds (Sep) | ~40% | Rising |
## Gold Surges to a 3-Month High as the Dollar Slides
Spot gold climbed 0.9% to **$4,643.63 per ounce** on Monday, its highest level since mid-May, extending a stunning 5% gain from last week. US gold futures added 0.4% to $4,699.10. The primary driver is a weakening US dollar, which has fallen to multi-month lows as markets absorb the Treasury Department’s surprise announcement of a major expansion in long-bond buybacks.
A weaker dollar makes gold more affordable for international buyers, and right now that tailwind is powerful. Beyond the currency move, gold is drawing strength from policy uncertainty around the Federal Reserve, concerns about rising US debt, and simmering geopolitical risk tied to Iran. As KCM Trade chief market analyst Tim Waterer noted, gold is “taking its cues primarily from the softer dollar and focusing on what higher yields may be signaling about underlying economic strains and policy uncertainty.”
## Iran Sanctions Set to Drop as the US Threatens an Economic Offensive
The United States has threatened Iran with what officials described as **“the greatest financial offensive ever marshalled”**, preparing to roll out sweeping economic sanctions targeting Iran’s trade partners. Treasury Secretary Scott Bessent is expected to detail the measures later Monday. Oil prices eased slightly as traders took profits ahead of the announcement, though energy markets remain alert to any supply disruption risk.
The sanctions come as the 60-day Iran ceasefire has fully expired and diplomatic talks have stalled. Any escalation near the Strait of Hormuz would send oil and gold sharply higher. Markets are pricing the Iran situation as unresolved and dangerous, which is one reason safe-haven demand for gold has accelerated this week.
## Nvidia Earnings on Wednesday Could Move the Entire Market
The technology sector is holding its breath ahead of **Nvidia’s quarterly earnings on Wednesday**. Analysts expect quarterly revenue to nearly double to approximately $92 billion, with full-year earnings guidance forecast in the range of $103 billion to $105 billion. These are extraordinary numbers and that is exactly the problem.
Investors are acutely aware that Nvidia must not only beat expectations, it must beat “stratospheric expectations” — as one market observer put it. A miss or a cautious outlook could trigger a fresh chip stock selloff, following the 5.5% semiconductor crash seen just days ago. A beat with strong guidance, on the other hand, could reignite the AI rally and lift the Nasdaq sharply. Nvidia results will define tech sentiment for the weeks ahead.
## Jackson Hole and Fed Chair Warsh: Every Word Will Be Weighed
Federal Reserve Chair Kevin Warsh speaks at the **Jackson Hole Economic Symposium on Friday**, and markets are hanging on every signal. The stakes are unusually high: markets currently price in roughly a **40% probability of a September rate hike**, with a move fully priced in by December. Core inflation is forecast at 3.3% for July, and the PCE data this week will either cool or inflame rate hike expectations before Warsh takes the podium.
JPMorgan chief economist Bruce Kasman cautioned markets not to expect too much. “There are several reasons to expect to be underwhelmed,” Kasman said, noting Warsh may focus on his “regime change” agenda around balance sheet reduction rather than give explicit forward guidance on rates. Still, even a carefully worded speech could move bond markets if it hints at flexibility or firmness on the rate path.
Warsh’s well-known resistance to telegraphing Fed decisions in advance means Friday’s speech could disappoint traders hoping for clarity. But any comment touching on the Treasury buyback program, balance sheet policy, or September odds will move markets instantly.
## Treasury Buybacks and the Dollar Debasement Trade
Last week’s surprise announcement by Treasury Secretary Bessent at least doubling bond buybacks to restrain the surge in long-term yields has unleashed a dollar debasement narrative in currency and commodities markets. The dollar fell sharply on the news, and gold responded immediately. The buyback program is designed to ease financial conditions, but it has also raised questions about fiscal discipline and longer-term inflation risks.
Investors are reading rising long-term yields not just as a rate signal, but as a warning about underlying economic strains — too much government debt, too much AI-sector borrowing, and a Federal Reserve that may be running out of easy options.
## Canada Trade War Risk Adds to the Uncertainty
The Canadian dollar dipped Monday as a fresh trade confrontation with the United States looms. Canadian Prime Minister Carney announced new retaliatory tariffs on US goods set to take effect September 8, escalating a trade dispute that adds another layer of macro risk for North American markets this week.
## What to Watch the Rest of This Week
- **Monday:** US Iran sanctions detail from Treasury Secretary Bessent
- **Tuesday:** Consumer confidence data
- **Wednesday:** Nvidia earnings — the single most important event for tech stocks
- **Thursday:** US July PCE inflation data — key for Fed rate path
- **Friday:** Fed Chair Warsh speech at Jackson Hole — market mover
## Frequently Asked Questions
### Why is gold hitting a 3-month high today?
Gold is surging on August 24, 2026 because the US dollar has weakened to multi-month lows following the Treasury’s bond buyback announcement, Iran geopolitical risk remains elevated, and investors are seeking safe-haven assets ahead of major events including Nvidia earnings and the Jackson Hole Fed speech.
### What are the US Iran sanctions announced this week?
The United States has threatened what it called “the greatest financial offensive ever marshalled” against Iran, targeting Iran’s trade partners with sweeping economic sanctions. Treasury Secretary Scott Bessent is expected to detail the full package on Monday August 24, 2026.
### What is the market expecting from Nvidia earnings?
Analysts expect Nvidia to report quarterly revenue of approximately $92 billion, nearly double the prior year, with full-year guidance of $103 billion to $105 billion. Nvidia reports on Wednesday August 27, 2026. Investors fear a miss against these high expectations could trigger a fresh tech selloff.
### What will Fed Chair Warsh say at Jackson Hole?
Fed Chair Kevin Warsh speaks at the Jackson Hole symposium on Friday August 29, 2026. Markets expect him to address balance sheet policy and rate outlook amid 40% odds of a September rate hike. Warsh is known for avoiding explicit forward guidance, so traders should prepare for a cautious, non-committal speech.
**Stay ahead of every market move.** [Bookmark Daily Finance](https://df.media) for breaking financial news, real-time market data, and the analysis that matters every trading day.
**Categories:** Banking
---
### [Markets Today August 19 2026: Iran Truce Expires, 30-Year Yields Hit 19-Year High and Chip Stocks Crash](https://df.media/markets-today-august-19-2026-iran-truce-yields-chip-stocks/)
**Published:** August 19, 2026
**Author:** Vishnu Priya
**Content:**
**Markets today August 19, 2026** opened the week under heavy pressure as a trio of macro shocks hit simultaneously: the 60-day U.S.–Iran ceasefire expired without a deal, the 30-year Treasury yield surged to a **19-year high**, and semiconductor stocks crashed more than 5%. Bitcoin held near $64,000, but traders sat on their hands ahead of Wednesday’s Federal Reserve minutes.
## Market Scorecard for August 19 2026
| Index / Asset | Level | Change |
|---|---|---|
| S&P 500 | ~5,410 | ▼ 0.6% |
| Nasdaq Composite | ~17,200 | ▼ 1.3% |
| Dow Jones | ~40,100 | ▼ 0.2% |
| 10-Year Treasury Yield | 4.72% | ▲ rising |
| 30-Year Treasury Yield | 5.33% | ▲ 19-yr high |
| Brent Crude | $89.19/bbl | ▲ 0.76% |
| Bitcoin (BTC) | ~$63,500 | → flat |
| Philadelphia Semiconductor Index | — | ▼ 5.5% |
## Iran Truce Expires as Geopolitical Risk Returns to Markets
The single biggest catalyst rattling markets today August 19 is the expiration of the 60-day U.S.–Iran ceasefire. With no permanent deal in place, Tehran announced it would shift to a **“fully offensive” military posture**. President Trump confirmed he had no interest in extending the truce, effectively ending months of diplomatic calm.
The news triggered an immediate flight to safety. Oil prices climbed, with Brent crude rising 0.76% to $89.19 a barrel and WTI adding 0.55% to $82.85. Fears of renewed Strait of Hormuz disruption are back on the table — a scenario that could push crude well above $90 if escalation continues. Equity markets fell broadly, with global stocks selling off in Asia and Europe before Wall Street opened lower.
## 30-Year Treasury Yield Hits a 19-Year High
The U.S. 30-year Treasury yield surged to **5.333%** — the highest level since June 2007, nearly two decades ago. The 10-year yield held at 4.72%, keeping pressure on equity valuations across all sectors. This is not a minor blip. A 30-year yield above 5.3% signals that bond markets are pricing in persistent inflation, a massive federal deficit, and a Federal Reserve that is nowhere near cutting rates.
Several structural forces are driving the bond selloff: AI companies are expected to issue up to **$1.5 trillion in debt** this year, the federal government continues running trillion-dollar deficits, and the Iran shock is adding an inflationary oil premium. [Fed Chair Kevin Warsh’s hawkish positioning](https://www.axios.com/2026/08/17/treasury-yields-warsh-bonds) has added to the uncertainty, with three Fed officials having already dissented in July in favor of a rate hike rather than a hold.
## Chip Stocks Crash 5.5 Percent as Semis Lead the Selloff
Semiconductor stocks bore the brunt of today’s risk-off mood. The Philadelphia Semiconductor Index plunged **5.5%**, the sector’s worst single-day drop in weeks. The carnage was broad:
- **Western Digital**: -7%
- **SanDisk**: -9%
- **Marvell Technology**: -8%
- **Seagate Technology**: -9%
This comes just weeks after Micron’s blowout earnings briefly reignited the AI chip rally in late June. The reversal is sharp, driven by rising funding costs (higher bond yields make growth stocks less attractive) and macro uncertainty from Iran. Investors are questioning whether AI capex can sustain itself if the cost of capital keeps rising.
## Bitcoin Holds Near 63K as All Eyes Turn to Fed Minutes Wednesday
Bitcoin is trading near **$63,500**, defending the psychologically important $62,000–$64,000 range as traders adopt a wait-and-see stance. Ethereum is testing $1,900 resistance, while XRP holds above $1. The crypto market is not crashing — but it is not rallying either.
The key catalyst for crypto this week is the **Federal Reserve’s July meeting minutes**, due Wednesday. If the minutes reveal a more hawkish tone than expected particularly given the three dissents in favor of a rate hike Bitcoin could break below $62,000.
Conversely, any dovish signal could push BTC back toward $65,000–$67,000. A White House meeting with crypto industry leaders this week is also keeping digital assets in focus.
## Oil Surges as Middle East Risk Flares Back
Energy is the one sector holding up in today’s selloff. Brent crude climbed to $89.19/bbl, its highest level since the original Iran truce was struck, as traders price in a renewed risk premium for Middle East oil supply disruptions.
WTI crude added 0.55% to $82.85. If Iran follows through on its “offensive posture” threat, analysts warn Brent could retest $95–$100/bbl quickly adding fuel to an already hot inflation fire and putting the Fed in an even more difficult position.
## Fed Chair Warsh and the Rate Hike Ghost
Markets are increasingly nervous about the Federal Reserve under Chair Kevin Warsh. In July, the Fed held rates steady but **three officials dissented in favor of a rate hike**. That kind of dissent is rare and signals that the rate hike debate is very much alive inside the FOMC.
With oil now rising again, bond yields at multi-decade highs, and inflation risks returning, the odds of a September rate hike are climbing. Wednesday’s Fed minutes will be parsed for every signal.
## What to Watch This Week
- **Wednesday:** Federal Reserve July meeting minutes — key for rate hike probability
- **Wednesday:** White House crypto industry meeting
- **Ongoing:** Iran–U.S. diplomatic status; any military escalation near the Strait of Hormuz
- **Thursday/Friday:** Jackson Hole Economic Symposium begins — Warsh expected to speak
## Frequently Asked Questions
### Why are markets falling today August 19, 2026?
Markets are falling today because the U.S.–Iran 60-day ceasefire expired without a deal, pushing oil prices higher and triggering risk-off selling. Rising 30-year Treasury yields at a 19-year high are adding pressure on equity valuations, and chip stocks are leading the Nasdaq lower.
### What is the 30-year Treasury yield today?
The 30-year U.S. Treasury yield hit 5.333% on August 18–19, 2026, the highest level since June 2007 — nearly 19 years. The 10-year yield is at 4.72%.
### Where is Bitcoin trading today?
Bitcoin is trading around $63,500 on August 19, 2026, holding in the $62,000–$64,000 range. Traders are waiting for the Federal Reserve’s July meeting minutes on Wednesday before making major moves.
### Why did chip stocks fall today?
Semiconductor stocks fell 5.5% on August 18–19, 2026 due to a combination of rising bond yields (which hurt high-multiple growth stocks), geopolitical uncertainty from the Iran truce expiration, and profit-taking following the Micron-driven AI rally in late June.
**Stay ahead of every market move.** [Bookmark Daily Finance](https://df.media) for real-time market analysis, breaking financial news, and the data you need to trade smarter every day.
**Categories:** Banking
---
### [Fed Rate Hike Odds Sink to 30 Percent as Dollar Slides, Stocks Rise](https://df.media/fed-rate-hike-odds-fall-dollar-slides-stocks-rise/)
**Published:** August 17, 2026
**Author:** Laura Anderson
**Content:**
Wall Street enters the week on firmer footing after a run of soft US economic data pushed traders to slash the odds of a Federal Reserve rate hike next month. Futures pointed higher, the dollar slipped toward two month lows, and global shares edged up as investors bet the central bank has less room to tighten than they thought just a week ago.
## Fed Rate Hike Odds Sink to 30 Percent
A September rate hike is now priced at just 30 percent, down sharply from roughly 50 percent a week earlier, according to CME Group’s FedWatch tool. The shift followed an unexpected drop in US retail sales for July, the first decline in nine months, along with a sharper than expected slide in consumer sentiment. Both readings landed on top of already soft inflation data, giving the Fed more reason to hold steady.
With Fed rate hike odds fading fast, Nasdaq futures firmed 0.5 percent and S&P 500 futures added 0.2 percent ahead of Monday’s open, extending a bullish run built almost entirely on fading rate hike risk. For more on how markets were positioning into this data heavy week, see our earlier coverage of [Wall Street awaiting the CPI report](https://df.media/global-finance-news-today-oil-gold-cpi-wall-street/).
## Dollar Slides as Euro Hits Two Month High
The dollar bore the brunt of the shift, with the euro touching a two month high of 1.1588 dollars. The Australian and New Zealand dollars each climbed to 10 week peaks, at 0.7105 dollars and 0.5910 dollars respectively. A softer greenback typically supports commodity prices and gives US multinationals a modest earnings tailwind, a dynamic investors will be watching closely as second quarter results continue to roll in.
## Treasury Yields Ease, Earnings Season Presses On
US Treasury yields slipped after a mixed finish last week. The two year yield eased 2 basis points to 4.154 percent, not far from a seven week low of 4.0977 percent touched last week. The 10 year yield also slipped 2 basis points, to 4.680 percent.
Earnings are lighter this week, but three major US retailers report: Home Depot, Target and Walmart. Investors will scrutinize each for signs of how resilient American consumers remain after the retail sales miss. The week’s biggest data point lands Thursday with the August S&P Purchasing Managers Indexes, which will show whether the summer’s pickup in business activity has legs.
## Oil Holds Near 82 Dollars as Middle East Risk Lingers
US crude slipped 0.7 percent to 81.91 dollars a barrel, giving back a small piece of last week’s 5.4 percent surge. Brent crude was roughly flat on the day after climbing 6 percent last week. The moves came after Iran called on the United States to accept defeat in the standoff over the Strait of Hormuz, while President Trump urged Americans to accept higher gasoline prices while the conflict continues.
> “While there is still no resolution to the Iran and Hormuz impasse, our base case remains that oil prices will stay in a 70 to 100 dollar range, with Iran preventing it going lower and the US moving to try and calm things down whenever it gets above 100,” said Shane Oliver, chief economist at AMP.
Oliver added that the risk of a durable peace deal failing to materialize remains real, and that with Middle East oil flows still running 10 to 15 percent below normal levels, higher prices could return as reserves are drawn down. For background on how the Hormuz standoff has moved energy markets in recent weeks, read our report on [global stocks and oil holding near 83.50 dollars](https://df.media/global-stocks-rise-as-oil-holds-near-83-50/).
## Gold Extends Its Climb
Gold bounced 0.5 percent to 4,397 dollars an ounce, adding to a 0.8 percent gain last week. Falling Treasury yields and a weaker dollar have both worked in the metal’s favor, alongside steady safe haven demand tied to the Middle East standoff.
## Asia and Europe Trade Higher
The STOXX 600 rose 0.21 percent in early European trading, while MSCI’s broadest index of Asia Pacific shares outside Japan gained 0.5 percent and Japan’s Nikkei edged up 0.3 percent. Chinese blue chips rose 0.8 percent and Hong Kong’s Hang Seng climbed 1.6 percent ahead of China’s July activity data, with economists expecting industrial output growth to slow to 4.8 percent from 5.3 percent, though some investors are braced for an upside surprise after last month’s export boom tied to strong global AI demand.
---
### What to Watch This Week for Fed Rate Hike Odds
- Fed rate hike odds for September now sit at 30 percent, down from roughly 50 percent a week ago.
- Retail earnings from Home Depot, Target and Walmart test the strength of the US consumer.
- August S&P PMI data due Thursday, the week’s key gauge of US business activity.
- US crude near 82 dollars a barrel, Brent little changed after last week’s 6 percent surge.
- Gold at 4,397 dollars an ounce as Treasury yields ease and the dollar weakens.
Source: Reporting by Lawrence White and Stella Qiu for Reuters, “Shares rise, dollar slips as markets pare Fed rate risks,” August 17, 2026. Read the original report on [Reuters](https://www.reuters.com/markets/).
---
### Track Every Fed Move With Daily Finance
Rate odds can swing in a single trading session. Subscribe to Daily Finance for real time alerts on Fed policy, Treasury yields, and the data that moves US markets.
[Subscribe to Daily Finance](https://df.media/newsletter/)
**About the author:** Laura Anderson is a markets and currency correspondent at Daily Finance, covering FX intervention, central bank policy, and global macro trends.
**Categories:** Banking
---
### [Global Finance News Today: Oil Rallies, Gold Climbs as Wall Street Awaits CPI](https://df.media/global-finance-news-today-oil-gold-cpi-wall-street/)
**Published:** August 12, 2026
**Author:** Laura Anderson
**Content:**
Global finance news today centers on a market on edge, with oil extending a six day rally, gold climbing toward record territory, and Wall Street bracing for the most closely watched inflation report of the summer. The July Consumer Price Index lands at 8:30am Eastern, and traders across Asia, Europe and the United States are treating it as the next major signal for the Federal Reserve.
## Oil Rallies as Strait of Hormuz Deal Stays Out of Reach
Brent crude pushed above 89 dollars a barrel, capping a rally of roughly 12 percent over five sessions, while West Texas Intermediate traded near 84 dollars. The gains came as talks between Iran and Oman over reopening the Strait of Hormuz dragged on without a breakthrough. Iran’s Foreign Ministry said the conditions for reopening the waterway do not exist while the United States naval blockade continues.
Shipping through the strait, once responsible for roughly a fifth of global oil supply, has effectively collapsed since the conflict began in late February. Ship tracking data shows as few as eight vessels crossing on some recent days, compared with around 130 transits before the war. For more on how the standoff has whipsawed energy markets, see our earlier report on [global stocks and oil holding near 83.50 dollars on Hormuz plans](https://df.media/global-stocks-rise-as-oil-holds-near-83-50/).
## Wall Street Slips Ahead of the CPI Print
US stocks closed lower on Tuesday as the standoff between Washington and Tehran intensified. The Dow Jones Industrial Average fell 184.13 points, or 0.3 percent, to 53,791.85. The S&P 500 dropped 24.91 points, also 0.3 percent, to 7,728.20. The Nasdaq Composite lost 159.91 points, or 0.6 percent, to 26,445.45, weighed down in part by a slide in Alphabet shares.
Attention now shifts to the Federal Reserve, which has held its benchmark rate at 3.50 to 3.75 percent since June. A hotter than expected inflation print could revive talk of a rate hike, while a softer reading would give policymakers more room to hold steady. For background on how markets have been positioning into record territory, read our coverage of [Wall Street eyeing record highs](https://df.media/european-stocks-rise-wall-street-record-highs/).
## Gold and Silver Climb as Safe Haven Demand Builds
Gold futures rose 0.35 percent to 4,456.70 dollars an ounce, while silver gained 0.49 percent to 65.25 dollars. The move tracked a broader flight to safety tied to the Hormuz standoff, a fresh North Korean missile launch, and renewed tension involving Yemen aligned Houthi forces. Investors have used precious metals as a hedge against both geopolitical risk and the uncertainty hanging over Wednesday’s inflation data.
## Europe Holds Near Records, Asia More Cautious
The pan European STOXX 600 finished little changed at 660.51 points, hovering near all time highs as strong corporate earnings offset concern over energy supply. Energy stocks jumped 1.7 percent and technology shares added 1.1 percent. Asian markets were more subdued, with futures pointing to a lower open across Australia and Hong Kong as traders held back from riskier bets ahead of the US inflation data.
## Bitcoin Slips as Risk Appetite Fades
Bitcoin traded at 63,495.84 dollars, down 0.66 percent on the day, as traders trimmed risk ahead of the CPI release. The cryptocurrency has shown an unusually tight correlation with the S&P 500 in recent weeks, and analysts pointed to outflows from spot bitcoin ETFs as an added source of pressure. A softer inflation print could support a bounce toward 65,000 dollars, while a hotter reading risks pushing the coin back toward 62,700 dollars.
## What Else to Watch in Global Finance News Today
- US Consumer Price Index for July, due at 8:30am Eastern, the day’s key catalyst for Fed policy expectations.
- Cisco Systems reports quarterly results, with investors focused on networking demand and AI infrastructure spending.
- Nebius Group and Cerebras Systems both report earnings, giving fresh signals on AI cloud and chip demand.
- Brent crude above 89 dollars a barrel as the Strait of Hormuz standoff continues.
- Gold near 4,457 dollars an ounce on safe haven buying.
---
Sources: [Bloomberg oil market wrap](https://www.bloomberg.com/news/articles/2026-08-11/latest-oil-market-news-and-analysis-for-aug-12), [CNBC](https://www.cnbc.com/2026/08/10/oil-prices-today-brent-wti-hormuz-trump-iran.html), [US Bureau of Labor Statistics](https://www.bls.gov/news.release/cpi.htm), [Yahoo Finance](https://finance.yahoo.com/markets/live/stock-market-today-tuesday-august-11-dow-sp-500-nasdaq-102827503.html), and [CaptainAltcoin](https://captainaltcoin.com/bitcoin-btc-price-prediction-for-today-august-12/).
---
### Never Miss a Market Moving Headline
From CPI surprises to oil shocks, markets can turn on a single data point. Subscribe to Daily Finance for real time alerts on the stories moving global markets.
[Subscribe to Daily Finance](https://df.media/newsletter/)
**About the author:** Laura Anderson is a markets and currency correspondent at Daily Finance, covering FX intervention, central bank policy, and global macro trends.
**Categories:** Banking
---
### [Global Stocks Edge Higher as Oil Holds Near $83.50 on Hormuz Plans](https://df.media/global-stocks-rise-as-oil-holds-near-83-50/)
**Published:** August 10, 2026
**Author:** Vishnu Priya
**Content:**
**August 10, 2026 \| Finance \| Global Markets**
Global stocks edged higher Monday as investors weighed signs of progress on shipping arrangements through the **Strait of Hormuz**, steady crude oil prices and growing expectations that the Federal Reserve may keep interest rates unchanged this year.
The **Stoxx 600 rose 0.1%**, while S&P 500 futures gained 0.2% and Nasdaq futures advanced 0.4%. Asian markets were stronger, led by a 2.1% gain in Japan’s Nikkei 225.
Brent crude, meanwhile, was little changed near **$83.50 a barrel**, as investors monitored Iran’s discussions with Oman over new shipping lanes through the strategic waterway.
The next major catalyst for markets is Wednesday’s **U.S. Consumer Price Index (CPI)** report, which could influence expectations for the Federal Reserve’s September policy decision.
## Global Stocks Rise as Investors Assess Fed and Oil Risks
Wall Street’s record-setting rally at the end of last week helped lift global equities into Monday’s session.
U.S. stocks finished at record highs Friday after a weaker-than-expected July jobs report caused investors to reduce expectations for additional Federal Reserve rate increases.
That shift has remained supportive for risk assets.
The MSCI global stock index was up about 0.1% Monday, while European shares posted modest gains.
Japan was the standout performer among major Asian markets, with the Nikkei climbing 2.1%. South Korea’s benchmark gained 0.7%.
The broader message from markets is straightforward: **investors are increasingly betting that slowing economic momentum will limit the need for additional U.S. rate hikes.**
## Why Oil Prices Are Critical for Global Markets
Oil remains the biggest geopolitical variable for investors.
Brent crude was trading around **[$83.50 per barrel](https://www.reuters.com/world/china/global-markets-global-markets-2026-08-10/)**, well below its late-April peak above $126.
The latest development centers on the Strait of Hormuz, where Iran said talks with Oman over new transit arrangements were approaching a final agreement.
However, the situation remains unresolved. Iran has indicated that reopening the waterway fully would depend on additional conditions involving the United States.
That leaves energy markets highly sensitive to further announcements.
### What Happens If the Strait of Hormuz Reopens?
A meaningful improvement in shipping through Hormuz could put downward pressure on oil prices by reducing fears of prolonged supply disruption.
Lower energy prices could also ease inflation pressures, particularly in the U.S. and other major economies that rely heavily on imported oil.
That would potentially give central banks more room to avoid additional interest-rate increases.
**For investors, the Hormuz situation therefore matters beyond oil. It could influence inflation, bond yields, interest-rate expectations and stock valuations.**
## U.S. CPI Report Is the Week’s Biggest Market Test
The biggest scheduled economic event this week is the **July U.S. CPI report**, due Wednesday.
Economists surveyed by Reuters expect:
| U.S. Inflation Indicator | July Forecast | June |
|---|---|---|
| Headline CPI | 3.4% | 3.5% |
| Core CPI | 2.5% | 2.6% |
The expected moderation in inflation is helping reinforce expectations that the Federal Reserve may not need to raise rates again this year.
Fed futures currently imply roughly a **45% probability of a September rate hike**, down sharply from about 67% one week ago.
### Why Does CPI Matter for Stocks?
A cooler-than-expected CPI reading could strengthen expectations for a more accommodative Fed and potentially support stocks, particularly growth and technology companies.
A hotter CPI reading could have the opposite effect.
Higher-than-expected inflation would likely push Treasury yields higher and force investors to reconsider how quickly monetary policy can ease.
**In short, Wednesday’s inflation report could determine whether the recent stock-market rally continues or loses momentum.**
## Strong Corporate Earnings Are Supporting the Rally
Economic data is only part of the story.
Corporate earnings have also helped push U.S. stocks toward record levels.
With roughly 90% of S&P 500 companies having reported results, analysts at Bank of America said earnings per share were approximately **30% higher year over year**, excluding investment gains at Alphabet and Amazon.
The S&P 500 earnings beat rate was around **76%**, matching its strongest level since 2021.
That earnings strength is giving investors another reason to remain bullish despite elevated valuations and geopolitical risks.
JPMorgan strategists have raised their 2026 S&P 500 earnings-per-share forecast to **$365**, representing projected annual growth of 35%.
The bank also increased its S&P 500 target to **8,000 from 7,800**.
The index was recently around 7,758.
## Treasury Yields Remain Closely Watched
The U.S. bond market was relatively quiet Monday.
The benchmark **10-year Treasury yield slipped one basis point to approximately 4.643%** as investors prepared for roughly $125 billion in new Treasury issuance this week.
Bond yields remain particularly important for equity investors.
If inflation falls, yields could decline and improve the relative attractiveness of stocks. But persistent inflation could keep yields elevated, increasing pressure on high-growth companies whose valuations depend heavily on future earnings.
## Dollar and Yen Face New Pressure
Currency markets were relatively stable, although the Japanese yen remained under scrutiny.
The euro was hovering near a seven-week high around **$1.156**, while the dollar gained 0.4% against the yen to approximately **158.48**.
Investors remain alert to potential Japanese intervention as the yen weakens.
The Bank of Japan is also facing growing inflation concerns.
A summary of opinions from its July meeting showed policymakers discussing the possibility that rising inflation could require a faster pace of interest-rate increases.
That has increased expectations for a possible **September Bank of Japan rate hike**.
## Three Things Investors Should Watch This Week
### 1. U.S. CPI
The inflation report is likely to be the biggest immediate catalyst for U.S. stocks, Treasury yields and the dollar.
### 2. Strait of Hormuz Developments
Any meaningful improvement in shipping could reduce the geopolitical premium in oil prices. A renewed disruption could send energy prices higher.
### 3. Corporate Earnings
Results from companies including **Applied Materials, Cisco and CoreWeave** will provide another test of whether strong corporate earnings can continue supporting elevated equity valuations.
## What Does This Mean for the Stock Market?
The current market environment is being driven by three competing forces:
**Bullish:** Strong corporate earnings and reduced expectations for Fed rate hikes.
**Neutral:** Oil prices remain relatively contained despite geopolitical risks.
**Risk:** A hotter U.S. CPI reading or renewed disruption in the Strait of Hormuz could quickly change investor sentiment.
For now, investors appear willing to look through geopolitical uncertainty as long as oil prices remain controlled and corporate earnings remain strong.
But Wednesday’s inflation report could provide the market with its next major direction signal.
---
# Frequently Asked Questions
### Why are global stocks rising today?
Global stocks are edging higher as investors respond to strong corporate earnings, reduced expectations for additional Federal Reserve rate hikes and developments around shipping through the Strait of Hormuz.
### What is happening with oil prices?
Brent crude is trading near **$83.50 a barrel** as investors monitor Iran’s discussions with Oman regarding shipping arrangements through the Strait of Hormuz.
### Why is the Strait of Hormuz important to financial markets?
The Strait of Hormuz is a major global energy transit route. Prolonged disruption could push oil prices higher, increasing inflation and potentially affecting interest-rate expectations and stock valuations.
### What will move U.S. stocks this week?
The **July U.S. CPI report on Wednesday** is likely to be the most important scheduled economic event. Corporate earnings and developments around Hormuz are also important market drivers.
### Is the Federal Reserve expected to raise rates in September?
Market pricing currently implies roughly a **45% probability of a September rate hike**, down from about 67% a week earlier. The CPI report could significantly change those expectations.
📌 **Stay ahead of markets, business and financial news with DF Media.**
[Visit DF Media for the latest finance and business news →](https://df.media/?utm_source=chatgpt.com)
**Categories:** Banking
---
### [Hackers Target Wall Street Giants: Citadel, Point72 and Two Sigma Hit in Cyberattack Wave](https://df.media/wall-street-cyberattack-citadel-point72-two-sigma/)
**Published:** August 6, 2026
**Author:** Laura Anderson
**Content:**
Hackers launched a wave of sophisticated attacks on some of Wall Street’s biggest hedge funds and private equity firms this week, according to people familiar with the matter, marking one of the boldest attempts yet to break into the systems that manage trillions of dollars in client money.
This Wall Street cyberattack wave did not rely on malware or code. Instead, attackers picked up the phone. Sources say cybercriminals called employees directly, posing as trusted contacts in an attempt to trick staff into handing over login credentials or granting remote access to internal systems.
## Point72 Confirms It Was Targeted
Point72 Asset Management, the hedge fund led by billionaire Steve Cohen, told investors on Wednesday that hackers had attempted to breach its systems. The firm said no customer information was stolen in the attempt and declined further public comment.
Point72 was not alone. Two Sigma Investments and Citadel, two of the largest quantitative hedge funds in the world, were also targeted by the same wave of attempted intrusions, according to the sources. Both firms declined to comment, and Two Sigma did not respond to requests for comment.
## The Phone Call Scam Behind the Attack
Security researchers call this tactic social engineering, and it remains one of the most effective tools in a hacker’s arsenal simply because it targets people, not code. Rather than searching for a software flaw, attackers exploit trust, urgency and confusion to talk their way past a company’s defenses.
The technique has become the signature move of Scattered Spider, a loose knit group of young, English speaking hackers that has racked up a long list of corporate victims in recent years, from casinos to airlines to major retailers. Their playbook is simple and brutally effective: call the help desk, sound convincing, and ask for a password reset.
> Attempts by hackers to break into major financial institutions are routine, cybersecurity experts say, but the scale and coordination of this latest wave stands out.
## AI Is Making Hackers More Dangerous
The Wall Street cyberattack lands at a moment when companies worldwide are already battling a surge in AI powered cyberattacks and ransomware. Criminal groups are increasingly using artificial intelligence to write more convincing phishing scripts, clone voices and speed up reconnaissance on potential targets, making old fashioned scams like phone based social engineering even harder to spot.
Earlier this year the White House announced a new working group bringing together AI developers and operators of critical infrastructure. The goal is to share threat intelligence faster and coordinate a unified response as attacks grow more sophisticated. For more on how artificial intelligence is reshaping markets and risk, see our coverage of [how the AI trade has been driving Wall Street gains](https://df.media/global-stocks-rally-microsoft-amazon-reignite-ai-trade/).
## Why the Wall Street Cyberattack Targeted Hedge Funds
Hedge funds and private equity firms sit on enormous pools of sensitive data, from trading strategies to investor identities to bank details, all of it valuable on the black market. A single successful breach can expose client funds, trigger regulatory scrutiny and shake investor confidence overnight.
This is not the first time a major financial name has faced a corporate security scare this year. Our earlier report on [TSMC’s trade secret leak investigation](https://df.media/tsmc-uncovers-possible-trade-secret-leak/) showed how even the most guarded companies remain exposed to insider and external threats alike. Markets have otherwise been in a bullish mood lately, with [Wall Street closing in on fresh record highs](https://df.media/european-stocks-rise-wall-street-record-highs/) just this week, underscoring how much money is riding on these firms staying secure.
---
### Key Takeaways
- This Wall Street cyberattack saw hackers attempt a coordinated wave of attacks on major hedge funds and private equity firms this week.
- Point72 confirmed it was targeted and said no customer data was stolen.
- Two Sigma and Citadel were also targeted, according to people familiar with the matter.
- Attackers used phone calls and social engineering rather than malware to try to gain access.
- The tactic mirrors the playbook used by the hacking group Scattered Spider.
- The White House launched a working group this year to help critical industries fight AI powered cyber threats.
Source: Reporting by [Pritam Biswas](https://www.reuters.com/authors/pritam-biswas/), [Raphael Satter](https://www.reuters.com/authors/raphael-satter/) and [Anirban Sen](https://www.reuters.com/authors/anirban-sen/) for Reuters, August 5, 2026.
---
### Stay Ahead of the Next Market Threat
Cybersecurity risk is now a market moving force. Subscribe to Daily Finance for real time alerts on the stories shaping Wall Street, from market swings to the security threats behind the headlines.
[Subscribe to Daily Finance](https://df.media/newsletter/)
**About the author:** Laura Anderson is a markets and currency correspondent at Daily Finance, covering FX intervention, central bank policy, and global macro trends.
**Categories:** Banking
---
### [European Stocks Rise as Wall Street Eyes Record Highs](https://df.media/european-stocks-rise-wall-street-record-highs/)
**Published:** August 4, 2026
**Author:** Laura Anderson
**Content:**
European stocks rise alongside U.S. futures on Tuesday, even as a rebound in oil prices reminded investors that the U.S. Iran standoff is far from resolved. The gains came on the heels of a blistering Wall Street session that pushed the S&P 500 within striking distance of its all time high and sent the Dow to a fresh record close.
## Oil Rebounds as Hormuz Tensions Resurface
Brent crude rose 1.4% to $84.95 a barrel, clawing back some of the previous session’s steep 7% slide to a three week low. The bounce followed a fresh attack on shipping in the Strait of Hormuz, a stark reminder that global energy flows remain exposed to the conflict even as diplomatic signals stay mixed. Traders are treating any talk of a quick resolution with caution.
## Wall Street Nears Record Territory
Europe’s STOXX 600 gained 0.55%, led by a 1.7% jump in technology shares. Nasdaq futures added 0.67% and S&P 500 futures rose 0.22% ahead of the open. That follows Monday’s 1.48% surge in the S&P 500 to 7,610.04, just shy of its record of 7,620.90, while the Dow Jones Industrial Average closed at an all time high of its own. MSCI’s global stocks index edged up 0.05% and Japan’s Nikkei added 0.32%.
> “We are adding risk to sectors which should be less impacted by higher rates. Tech and financials would be our favourite sectors to add back risk in the portfolio,” said Mohit Kumar, an economist at Jefferies.
Kumar pointed to the sheer volume of cash sitting on the sidelines as a key reason for his continued bullish stance, even with bond yields on the move.
## Earnings Season Delivers, Fed Watch Intensifies
Longer dated U.S. Treasury yields climbed to a 19 year high last week after comments from Federal Reserve Chairman Kevin Warsh stoked concern that the central bank may not move aggressively enough to keep inflation in check. Markets widely expect Warsh to hold off on a hike, and Tuesday’s first release of U.S. jobs data could hand him the cover he needs to stay put.
Earnings season is doing its part to keep sentiment upbeat. With almost two thirds of S&P 500 companies having reported second quarter results, 84% have topped analyst estimates, according to LSEG data.
> “The AI capex boom remains intact,” wrote Eastspring Investments analysts, including chief investment officer Vis Nayar.
Not every region shares the optimism. Some economists warn that Europe faces a tougher road ahead, with drought conditions hampering shipping on the Rhine and gas inventories running tighter than usual heading into the colder months.
## Yen Rally Loses Steam After Historic Intervention
The dollar gained 0.4% against the yen to trade at 157.80, rebuilding some strength after coordinated intervention by U.S. and Japanese authorities propped up the currency last week. Even so, the yen remains roughly 4% stronger against the greenback than it was a week ago, before the rare joint action that marked the first U.S. intervention in Japan’s currency market in 15 years.
Investors remain wary that Japan’s expansionary fiscal policy and the Bank of Japan’s unhurried pace of rate hikes could ultimately cap the currency’s gains.
> “The catalysts that can amplify the unwinding of short yen positions are, potentially, lower crude oil prices, BoJ policy tightening in September and thereafter, and some moderation in Prime Minister Sanae Takaichi’s fiscal plans, in order to bring debt sustainability back,” said Thierry Wizman, global forex and rates strategist at Macquarie Group.
The U.S. dollar index, which tracks the greenback against six major currencies, held steady at 99.98, not far from its lowest level in two months.
---
### What to Watch Today
- Brent crude at $84.95 a barrel, up 1.4% after Monday’s sharp pullback
- STOXX 600 up 0.55%, tech shares leading with a 1.7% gain
- S&P 500 closed Monday at 7,610.04, near its record high of 7,620.90
- Dollar/yen at 157.80, up 0.4% as intervention gains partly unwind
- First round of U.S. jobs data due later Tuesday
Reporting by Stefano Rebaudo and Gregor Stuart Hunter for Reuters. Additional context from Daily Finance markets desk.
**Categories:** Banking
---
### [Yen Jumps Third Day as Traders Eye More BOJ Intervention](https://df.media/yen-intervention-boj-oil-prices-drop/)
**Published:** August 3, 2026
**Author:** Vishnu Priya
**Content:**
The Japanese yen climbed for a third straight session on Monday, keeping traders on edge for signs of fresh **yen intervention** after Tokyo and Washington jointly stepped into the currency market last week to defend Japan’s battered currency. The move came as oil prices sank more than $4 a barrel following President Trump’s decision to hold off on a new strike against Iran, pulling support away from the safe-haven dollar.
### What is yen intervention?
Yen intervention is when Japan’s Ministry of Finance and the Bank of Japan buy yen in the open market to support its value, typically done to counter excessive volatility or rapid depreciation.
## Yen Intervention Fears Keep Traders on Alert
The yen advanced not just against the dollar but also the euro and sterling on Monday, reviving speculation that Japanese authorities could step back into the market. Japan’s finance ministry confirmed it coordinated a joint yen-buying operation with the United States on Friday, and Bank of Japan data suggests Tokyo may have spent close to $59 billion defending the currency last week alone.
The yen touched a three-month high of 155.20 per dollar during Asian trading hours before paring gains to trade at 156.65, up 0.45% on the day. That follows a rally of more than 3% over the final two sessions of last week — one of the sharpest short-term moves for the currency this year.
> “Dollar/yen 1.5-2 standard deviations above the long-term trend have been a useful guide for identifying when intervention risk enters the danger zone,” said Stephen Spratt, APAC rates strategist at Societe Generale.
SMBC chief forex strategist Hirofumi Suzuki pointed to a broader unwind of short-yen positioning as the real driver behind Monday’s surge, noting that a substantial build-up of bearish bets tends to accelerate appreciation once it starts to reverse.
## Oil Slides as Trump Holds Off on Iran Strike
Crude prices fell sharply Monday after Trump confirmed that planned strikes on Iran had been called off, with talks between the two nations set to resume. Brent crude dropped 5.2% to $83.39 a barrel, while West Texas Intermediate shed 6.2% to $79.45 — a dramatic reversal after weeks of war-driven gains. Iran, for its part, said it is not currently holding active talks with Washington, adding a layer of uncertainty to how durable the de-escalation will prove.
Falling energy prices are expected to weigh more heavily on large importers like the eurozone and Japan, while the U.S. economy is seen as comparatively insulated from oil-driven shocks. Treasury yields eased alongside oil, with the benchmark 10-year yield slipping 6 basis points to 4.68% as inflation anxiety cooled slightly.
## Dollar Index Steady as Fed Rate Path Stays in Focus
Despite the drop in oil, the dollar index was little changed at 99.79 Monday, after sliding more than 1.5% the previous week. The euro edged up 0.03% to $1.1525, having touched an 18-month high of $1.1559 in Asian trading.
> “It seems the only way the Fed can avoid hiking in September is if the U.S. data is poor enough,” said Chris Turner, global head of forex at ING.
Turner argued that falling oil prices should, in theory, weigh on the dollar — but the currency’s resilience reflects unresolved questions over whether the Fed could still hike rates in September if inflation data proves stubborn. This week’s jobs report is expected to be a critical input into that decision.
## What Comes Next for the Yen
Barclays analysts caution that even if the yen strengthens further in the near term, longer-term downward pressure remains firmly in place, driven by the Bank of Japan’s gradual approach to tightening and persistently wide yield differentials with the rest of the world. Goldman Sachs strategists have suggested that encouraging capital repatriation — rather than one-off intervention — is the most powerful lever Japan has for influencing the currency over the long run. Market participants also flagged Japan’s expansionary fiscal policy as an ongoing drag on the yen’s outlook.
For a deeper look at how the AI trade and yen volatility have been colliding in recent weeks, see our earlier coverage: [Global Stocks Rally as Microsoft and Amazon Earnings Revive AI Optimism, Yen Remains Volatile](https://df.media/global-stocks-rally-microsoft-amazon-reignite-ai-trade/). And for context on how the Iran conflict has whipsawed energy markets, read [US Iran Talks Oil Prices Crash: 7 Powerful Market Shifts Investors Must Watch](https://df.media/us-iran-talks-oil-prices-crash/).
Our earlier report on the dollar’s strength ahead of the Fed meeting also remains relevant background: [Markets Today: Nikkei Sets Record, Brent Crude Falls to $79, Gold at $4,163 as Dollar Surges](https://df.media/markets-today-june-19-nikkei-record-brent-oil-gold-dollar/).
---
### Key Takeaways
- The yen rose for a third straight session, hitting a three-month high of 155.20/dollar before settling near 156.65.
- Japan and the U.S. confirmed coordinated yen-buying intervention on Friday, with Tokyo spending an estimated $59 billion.
- Brent crude fell 5.2% and WTI fell 6.2% after Trump called off a planned Iran strike.
- The 10-year Treasury yield eased to 4.68% as inflation fears cooled.
- All eyes now turn to this week’s U.S. jobs report as a key input for the Fed’s September decision.
*Source: Reporting by Stefano Rebaudo and Rae Wee for Reuters, “Yen climbs for third straight session with traders on alert for intervention,” August 3, 2026. Read the original report on [Reuters](https://www.reuters.com/world/asia-pacific/dollar-suddenly-falls-against-yen-traders-alert-further-intervention-2026-08-03/).*
---
### Stay Ahead of the Next Market Move
Currency and oil volatility can shift portfolio risk overnight. Subscribe to Daily Finance for real-time market alerts, currency intervention tracking, and expert breakdowns delivered straight to your inbox.
[Subscribe to Daily Finance](https://df.media/newsletter/)
**About the author:** Laura Anderson is a markets and currency correspondent at Daily Finance, covering FX intervention, central bank policy, and global macro trends.
Analysts widely expect further yen intervention if the currency reverses course again, since Tokyo has signaled zero tolerance for another disorderly slide. The scale of this week’s yen intervention already ranks among the largest of the year, and traders say the threat of renewed yen intervention alone may be enough to keep speculators cautious in the sessions ahead.
For now, the yen intervention narrative remains the single biggest swing factor for USD/JPY traders this week.
**Categories:** Banking
---
### [Global Stocks Rally as Microsoft and Amazon Earnings Revive AI Optimism, Yen Remains Volatile](https://df.media/global-stocks-rally-microsoft-amazon-reignite-ai-trade/)
**Published:** July 31, 2026
**Author:** Laura Anderson
**Excerpt:** Global stocks gained as Microsoft and Amazon earnings revived AI optimism, while the Bank of Japan held rates and the yen remained volatile.
**Content:**
Global Stocks Rally moved higher on Friday as strong quarterly results from Microsoft and Amazon restored investor confidence in artificial intelligence related stocks. The upbeat earnings helped reignite interest in the AI sector after weeks of volatility, while currency markets remained focused on the Japanese yen following suspected government intervention and the Bank of Japan’s latest policy decision.
Technology shares led the advance, with Nasdaq 100 futures climbing more than 1%, while futures linked to the S&P 500 and Dow Jones Industrial Average also traded higher. European equities reached fresh record levels, and South Korea’s stock market staged an impressive recovery after sharp losses earlier in the week.
## AI Earnings Boost Global Market Sentiment
Investor confidence improved significantly after Microsoft projected continued strong cash generation through fiscal 2027, reinforcing expectations that its massive investments in artificial intelligence will deliver long term returns.
Amazon further strengthened market sentiment by reporting its fastest cloud computing revenue growth in more than four years. The results eased concerns that heavy spending on AI infrastructure might not translate into sustainable business growth.
The positive earnings from two of the world’s largest technology companies encouraged investors to return to AI focused stocks after recent market weakness.
## Global Markets Extend Gains
European stocks continued their strong performance, with the STOXX 600 index reaching another record high and remaining on track for a fourth consecutive month of gains.
In the United States, Nasdaq 100 futures rose approximately 1.05%, while S&P 500 futures gained 0.32% and Dow futures added 0.45%.
South Korea’s KOSPI index surged nearly 18%, marking one of its strongest rebounds after significant declines earlier in the week. Although the index remains well below its historical peak, the recovery highlights the sharp shifts in investor sentiment surrounding AI and semiconductor stocks.
The MSCI All Country World Index also advanced around 0.8%, putting global equities on course to end a two week losing streak despite remaining slightly lower for the month overall.
## Yen Swings After BOJ Policy Decision
Currency markets remained volatile after the Bank of Japan kept interest rates unchanged, a decision that initially strengthened the Japanese yen before the currency reversed course.
The U.S. dollar later traded around 160 yen, reflecting continued uncertainty over Japan’s currency outlook.
Market participants also continued to monitor reports that Japanese authorities intervened in the foreign exchange market on Thursday by purchasing yen and selling dollars in an effort to slow the currency’s depreciation.
Analysts, however, believe intervention alone is unlikely to provide lasting support without additional monetary tightening from the central bank.
## Bank of Japan Signals Future Rate Hikes
Although the Bank of Japan left interest rates unchanged, Governor Kazuo Ueda indicated that policymakers remain prepared to raise borrowing costs if inflation continues to strengthen.
The central bank acknowledged that inflation risks remain tilted to the upside, suggesting that further policy tightening remains possible if economic conditions support additional action.
Markets interpreted the comments as a sign that Japan’s ultra loose monetary policy may gradually move toward normalization.
## Geopolitical Risks Continue to Cloud Outlook
Despite improving confidence in technology stocks, investors remain cautious as geopolitical tensions in the Middle East continue to create uncertainty across global markets.
Crude oil prices have climbed steadily throughout July, with Brent crude heading toward its first monthly gain since March. Ongoing disruptions to shipping routes through the Strait of Hormuz and security concerns around the Bab el Mandeb Strait continue to raise concerns about global energy supplies.
Higher oil prices have also fueled worries that inflation could remain elevated, complicating the outlook for central banks worldwide.
## Bond Markets Watch Federal Reserve
In the United States, Treasury yields remained near multi year highs following the Federal Reserve’s latest policy meeting.
While the Fed kept interest rates unchanged earlier this week, investors remain uncertain about the timing of future rate cuts as inflation risks persist and energy prices continue to rise.
## Market Outlook
Strong earnings from Microsoft and Amazon have helped restore confidence in the AI investment story, lifting technology shares and supporting [global equity markets](https://www.reuters.com/world/china/global-markets-global-markets-2026-07-31/). However, uncertainty surrounding central bank policy, geopolitical tensions, and currency volatility continues to present challenges for investors.
The coming weeks will likely see markets closely monitoring additional corporate earnings, inflation data, Federal Reserve guidance, and developments in global energy markets to determine whether the current rally can be sustained.
**Stay ahead of global markets with DF Media.** Get the latest updates on stocks, AI, business, finance, and the global economy as they happen.
👉 Visit **[DF Media](https://df.media/)** for more breaking market news and expert insights.
**Categories:** Banking, Global News
**Tags:** AI stocks, Amazon, Bank of Japan, European Markets, Financial Markets, Global Economy, Global Stocks, Investing, Japanese Yen, microsoft, Nasdaq, Stock Market, Technology Stocks, Wall Street
---
### [Dollar Holds Firm Ahead of Fed Decision as Aussie Slips on Soft Inflation Data](https://df.media/dollar-steady-ahead-of-fed-decision-as-aussie-falls/)
**Published:** July 29, 2026
**Author:** Vishnu Priya
**Content:**
The U.S. dollar remained close to a one-month high on Wednesday as investors prepared for the [Federal Reserve’](https://www.reuters.com/world/asia-pacific/dollar-holds-steady-fed-decision-looms-2026-07-29/)s latest interest rate decision while renewed tensions in the Middle East boosted demand for safe-haven assets. Meanwhile, the Australian dollar weakened after softer-than-expected inflation data reduced expectations of further interest rate increases from Australia’s central bank.
## Dollar Supported by Fed Expectations
Currency markets were relatively quiet ahead of the Federal Open Market Committee (FOMC) meeting, with traders focusing on whether the Fed would maintain interest rates or deliver another 25 basis point hike. Market pricing suggested roughly a 33% probability of a rate increase.
Although many analysts expect the Fed to leave rates unchanged, investors are closely watching Chair Kevin Warsh’s comments for clues about future monetary policy.
According to Sim Moh Siong, currency strategist at OCBC, the Fed appears to be moving toward a more hawkish stance.
> “The messaging will likely matter more than the decision itself. If the Fed keeps rates unchanged but signals higher rates for longer, the U.S. dollar could remain well supported.”
The U.S. Dollar Index traded around **101.38**, remaining near its strongest level in a month.
## Middle East Tensions Boost Safe-Haven Demand
Investor caution also increased after the U.S. military reported intercepting multiple ballistic missiles launched by Iran toward American forces in the Middle East.
The renewed geopolitical uncertainty lifted oil prices, reinforcing concerns that higher energy costs could keep inflation elevated and complicate central bank decisions worldwide.
Rising geopolitical risks often encourage investors to move into safer assets such as the U.S. dollar, supporting the currency during periods of uncertainty.
## Australian Dollar Falls After Inflation Miss
The Australian dollar dropped **0.37% to $0.69475** after new inflation figures came in below economists’ expectations.
The weaker inflation reading reduced speculation that the Reserve Bank of Australia (RBA) would continue raising interest rates, placing additional pressure on the currency.
Lower inflation generally gives central banks more flexibility to pause monetary tightening, making a country’s currency less attractive relative to higher-yielding alternatives.
## Euro, Pound and Kiwi Remain Under Pressure
Other major currencies also traded cautiously:
- Euro: **$1.1389**, recovering only slightly after falling to a one-month low.
- British Pound: **$1.3287**, remaining near its weakest level since early July.
- New Zealand Dollar: **$0.5783**, edging lower as investors awaited the Fed announcement.
## Yen Near Multi-Decade Lows
The Japanese yen remained extremely weak, with the U.S. dollar trading near **163.74 yen**, close to levels not seen in decades.
Currency strategists believe any additional dollar strength following the Fed meeting could push USD/JPY toward **164**, increasing the likelihood of intervention by Japanese authorities.
Hirofumi Suzuki, Chief FX Strategist at SMBC, noted that Japan’s finance officials have recently intensified warnings against excessive currency movements, suggesting intervention remains a realistic possibility if the yen weakens further.
## What Markets Are Watching
The Federal Reserve’s policy announcement and Chair Kevin Warsh’s press conference are expected to set the tone for global financial markets over the coming weeks.
Investors will focus on:
- Whether the Fed keeps interest rates unchanged.
- Updated guidance on inflation and future rate decisions.
- Comments regarding economic growth and labor market conditions.
- The impact of geopolitical tensions on inflation expectations.
Even without an immediate rate increase, a hawkish message from the Fed could keep the U.S. dollar strong while maintaining pressure on global currencies and emerging markets.
## Bottom Line
Global currency markets are entering one of the most closely watched trading sessions of the month. The U.S. dollar remains supported by expectations that the Federal Reserve will maintain a restrictive policy stance, while softer Australian inflation has weakened the Aussie and renewed Middle East tensions continue driving demand for safe-haven assets. The Fed’s guidance later today is likely to determine the next major move across currency markets.
**FAQ**
1.**What is supporting the U.S. dollar?**
The dollar is being supported by expectations that the Federal Reserve will maintain a hawkish policy stance and by increased demand for safe-haven assets amid geopolitical tensions.
2.**Why did the Australian dollar fall?**
The Australian dollar declined after inflation data came in below expectations, reducing the likelihood of additional interest rate hikes by the Reserve Bank of Australia.
3.**Why is the Fed decision important for currency markets?**
The Federal Reserve’s interest rate decision and policy guidance influence global capital flows, bond yields, and the relative strength of the U.S. dollar against other major currencies.
4.**How do Middle East tensions affect financial markets?**
Rising geopolitical tensions often increase demand for safe-haven assets such as the U.S. dollar while also pushing oil prices higher, which can influence inflation expectations worldwide.
👉 Explore the latest financial news and market analysis at [Daily Finance](https://df.media/?utm_source=chatgpt.com) and never miss a major market-moving story.
**Categories:** Banking
---
### [Oil Surge Pushes Global Stocks Toward a Weekly Loss](https://df.media/oil-surge-pushes-global-stocks-toward-weekly-loss/)
**Published:** July 24, 2026
**Author:** Laura Anderson
**Excerpt:** World stocks head for a weekly loss as a Middle East driven oil spike sends bond yields to multi-decade highs and lifts Fed rate-hike odds.
**Content:**
Markets are ending the week the way they started it: nervous about oil, nervous about rates, and increasingly nervous about how much Big Tech is spending on AI with little to show for it yet.
World stocks are on track for a second straight weekly decline, and long-dated bond yields are sitting at levels not seen in decades. The common thread running through nearly every market move this week traces back to one thing: a nearly 40% surge in oil prices this month as the conflict in the Middle East escalates.
#### Oil Is the Real Story
Brent crude spiked 7% overnight Thursday to a two-month high of $102 a barrel before easing back 2% to settle near $98.70 on Friday. The swing followed Houthi attacks on Saudi tankers in the Red Sea, a second major chokepoint now at risk alongside Iran’s near-closure of the Strait of Hormuz.
President Trump raised the stakes further, vowing “major military punishment” for Iran and the Houthis. The U.S. military struck Iran late Thursday into early Friday, the 13th straight night of attacks. Every fresh escalation is pushing energy prices higher, and higher energy prices are exactly what central banks don’t want to see right now.
Shaniel Ramjee, co-head of multi-asset investment at Pictet Asset Management, pointed to how directly this is now feeding into currency and asset pricing, noting that days of sustained higher oil have finally started rippling across other markets rather than staying contained to energy alone.
#### Bond Yields Are Sending a Message
The clearest sign of how seriously investors are taking the inflation risk is in the bond market. The 10-year U.S. Treasury yield touched an 18-month high of 4.7135%, climbing nearly 16 basis points in a single week. The 30-year yield held near 5.176%, within striking distance of a 19-year peak.
It’s not just a U.S. story. German 10-year Bund yields, the benchmark for the eurozone, are hovering close to their highest level since 2011. When yields rise this fast across multiple economies at once, it usually means one thing: traders are pricing in stickier inflation and a longer wait for rate cuts, possibly even the opposite.
#### The Dollar Wins, the Yen Loses
Higher yields have been rocket fuel for the U.S. dollar. The dollar index climbed to 101.4, on pace for its biggest weekly gain in roughly a month, after touching its highest level of the month on Thursday.
The yen is bearing the brunt of it. It’s pinned near a 40-year low of 163.79 per dollar, weak enough that the U.S. Treasury issued a warning about excessive currency volatility. Japan’s finance minister has repeated verbal warnings about possible intervention, a page from the same playbook used in April and May when Japan actually stepped in to buy yen. It didn’t work then either. The currency has since pushed well past the 160 level that traders once considered the line in the sand.
#### Equities: A Split Screen From New York to Seoul
The MSCI All-World Index slipped 0.3%, putting it on track for a second consecutive weekly loss. Europe’s STOXX 600 actually rose 0.4% on Friday, a small bounce after dropping more than 1% the session before, though the region is still headed for a weekly decline overall.
Asia took the harder hit. The MSCI Asia-Pacific index excluding Japan dropped 2.5%. Japan’s Nikkei fell 2.7%. South Korea’s KOSPI was the standout casualty, tumbling 5.7% and marking its fifth straight week in the red. Hong Kong’s Hang Seng slipped 1.7%.
Nasdaq futures dipped a modest 0.1%, but that number hides a more interesting split underneath it: Intel jumped more than 4% on strong earnings even as the broader tech sector stayed under pressure.
#### AI Spending Anxiety Hits Big Tech
That tension came to a head this week as Alphabet and Tesla, the first two of the so-called Magnificent Seven to report earnings this season, spooked investors by burning through significant cash on AI infrastructure buildout without clear proof it’s paying off yet.
Ramjee framed the risk in simple terms: the more these companies plow into capital spending, the more sensitive their stock prices become to moves in interest rates, particularly real yields. In a week when yields are spiking, that’s not a comfortable position for the market’s largest, most AI-exposed names to be in.
#### Central Banks: The Odds Are Shifting
Traders are now pricing in roughly a one in three chance the Federal Reserve raises rates as soon as next week, a dramatic shift from just days ago when almost nobody was pricing that in. A September move is now considered more likely than not.
The European Central Bank held rates steady on Thursday, but a September hike is already about 70% priced in by markets. There was a small silver lining in the data: business activity surveys showed Germany’s private sector returned to growth in July for the first time in four months, and the pace of contraction in France’s private sector eased.
#### Gold and Silver Catch Their Breath
Precious metals had a quieter session after a rough Thursday. Gold held flat at $4,046 an ounce, stabilizing after a 2% drop the day before. Silver ticked up 0.7%, clawing back a small piece of Thursday’s 3.4% decline.
#### What to Watch Next
The next moves in oil will likely keep setting the tone. Any further escalation in the Middle East, particularly around the Strait of Hormuz or additional attacks near the Red Sea, could push crude back toward its recent highs and drag bond yields with it.
Also worth watching: whether the Fed’s tone next week validates the market’s new rate-hike pricing, and whether more Magnificent Seven earnings reports echo the same AI spending concerns that hit Alphabet and Tesla this week.
#### Key Takeaways
World stocks are headed for a second straight weekly loss as oil prices, up nearly 40% this month, stoke inflation fears. The 10-year Treasury yield hit an 18-month high, and the dollar is having its best week in about a month while the yen sits near 40-year lows. Asian markets took the hardest hit, led by a 5.7% weekly slide in South Korea’s KOSPI. Markets are now pricing a one in three chance of a Fed rate hike next week, a sharp shift from prior expectations. AI infrastructure spending by Alphabet and Tesla is adding a new layer of rate sensitivity to Big Tech stocks.
---
#### FAQ
**Why are global stocks falling this week?**
A near-40% rise in oil prices this month, driven by escalating conflict in the Middle East, has reignited inflation fears and pushed bond yields to multi-decade highs, weighing on stocks worldwide.
**Why did oil prices spike and then pull back?**
Brent crude surged 7% to a two-month high of $102 a barrel after Houthi attacks on Saudi tankers threatened a key Red Sea shipping route, then eased back to around $98.70 as the initial shock settled.
**Is the Federal Reserve going to raise interest rates?**
Markets are now pricing in roughly a one in three chance of a Fed rate hike as soon as next week, with a September increase considered more likely than not, a significant shift from expectations just a week earlier.
**Why is the Japanese yen so weak right now?**
The yen is trading near 163.79 per dollar, its weakest level in about 40 years, as rising U.S. Treasury yields boost the dollar. Japan has issued intervention warnings before but previous yen-buying efforts had limited lasting effect.
**Why are Alphabet and Tesla’s earnings affecting the broader market?**
Both companies reported heavy cash burn from AI infrastructure spending without clear evidence of returns yet, raising concerns that heavily AI-invested megacap stocks are becoming more sensitive to interest rate moves.
Markets are ending the week the way they started it: nervous about oil, nervous about rates, and increasingly nervous about how much Big Tech is spending on AI with little to show for it yet.
World stocks are on track for a second straight weekly decline, and long-dated bond yields are sitting at levels not seen in decades. The common thread running through nearly every market move this week traces back to one thing: a nearly 40% surge in oil prices this month as the conflict in the Middle East escalates.
#### Oil Is the Real Story
Brent crude spiked 7% overnight Thursday to a two-month high of $102 a barrel before easing back 2% to settle near $98.70 on Friday. The swing followed Houthi attacks on Saudi tankers in the Red Sea, a second major chokepoint now at risk alongside Iran’s near-closure of the Strait of Hormuz.
President Trump raised the stakes further, vowing “major military punishment” for Iran and the Houthis. The U.S. military struck Iran late Thursday into early Friday, the 13th straight night of attacks. Every fresh escalation is pushing energy prices higher, and higher energy prices are exactly what central banks don’t want to see right now.
Shaniel Ramjee, co-head of multi-asset investment at Pictet Asset Management, pointed to how directly this is now feeding into currency and asset pricing, noting that days of sustained higher oil have finally started rippling across other markets rather than staying contained to energy alone.
#### Bond Yields Are Sending a Message
The clearest sign of how seriously investors are taking the inflation risk is in the bond market. The 10-year U.S. Treasury yield touched an 18-month high of 4.7135%, climbing nearly 16 basis points in a single week. The 30-year yield held near 5.176%, within striking distance of a 19-year peak.
It’s not just a U.S. story. German 10-year Bund yields, the benchmark for the eurozone, are hovering close to their highest level since 2011. When yields rise this fast across multiple economies at once, it usually means one thing: traders are pricing in stickier inflation and a longer wait for rate cuts, possibly even the opposite.
#### The Dollar Wins, the Yen Loses
Higher yields have been rocket fuel for the U.S. dollar. The dollar index climbed to 101.4, on pace for its biggest weekly gain in roughly a month, after touching its highest level of the month on Thursday.
The yen is bearing the brunt of it. It’s pinned near a 40-year low of 163.79 per dollar, weak enough that the U.S. Treasury issued a warning about excessive currency volatility. Japan’s finance minister has repeated verbal warnings about possible intervention, a page from the same playbook used in April and May when Japan actually stepped in to buy yen. It didn’t work then either. The currency has since pushed well past the 160 level that traders once considered the line in the sand.
#### Equities: A Split Screen From New York to Seoul
The MSCI All-World Index slipped 0.3%, putting it on track for a second consecutive weekly loss. Europe’s STOXX 600 actually rose 0.4% on Friday, a small bounce after dropping more than 1% the session before, though the region is still headed for a weekly decline overall.
Asia took the harder hit. The MSCI Asia-Pacific index excluding Japan dropped 2.5%. Japan’s Nikkei fell 2.7%. South Korea’s KOSPI was the standout casualty, tumbling 5.7% and marking its fifth straight week in the red. Hong Kong’s Hang Seng slipped 1.7%.
Nasdaq futures dipped a modest 0.1%, but that number hides a more interesting split underneath it: Intel jumped more than 4% on strong earnings even as the broader tech sector stayed under pressure.
#### AI Spending Anxiety Hits Big Tech
That tension came to a head this week as Alphabet and Tesla, the first two of the so-called Magnificent Seven to report earnings this season, spooked investors by burning through significant cash on AI infrastructure buildout without clear proof it’s paying off yet.
Ramjee framed the risk in simple terms: the more these companies plow into capital spending, the more sensitive their stock prices become to moves in interest rates, particularly real yields. In a week when yields are spiking, that’s not a comfortable position for the market’s largest, most AI-exposed names to be in.
#### Central Banks: The Odds Are Shifting
Traders are now pricing in roughly a one in three chance the Federal Reserve raises rates as soon as next week, a dramatic shift from just days ago when almost nobody was pricing that in. A September move is now considered more likely than not.
The European Central Bank held rates steady on Thursday, but a September hike is already about 70% priced in by markets. There was a small silver lining in the data: business activity surveys showed Germany’s private sector returned to growth in July for the first time in four months, and the pace of contraction in France’s private sector eased.
#### Gold and Silver Catch Their Breath
Precious metals had a quieter session after a rough Thursday. Gold held flat at $4,046 an ounce, stabilizing after a 2% drop the day before. Silver ticked up 0.7%, clawing back a small piece of Thursday’s 3.4% decline.
#### What to Watch Next
The next moves in oil will likely keep setting the tone. Any further escalation in the Middle East, particularly around the [Strait of Hormuz](https://www.reuters.com/world/china/global-markets-global-markets-2026-07-24/) or additional attacks near the Red Sea, could push crude back toward its recent highs and drag bond yields with it.
Also worth watching: whether the Fed’s tone next week validates the market’s new rate-hike pricing, and whether more Magnificent Seven earnings reports echo the same AI spending concerns that hit Alphabet and Tesla this week.
#### Key Takeaways
World stocks are headed for a second straight weekly loss as oil prices, up nearly 40% this month, stoke inflation fears. The 10-year Treasury yield hit an 18-month high, and the dollar is having its best week in about a month while the yen sits near 40-year lows. Asian markets took the hardest hit, led by a 5.7% weekly slide in South Korea’s KOSPI. Markets are now pricing a one in three chance of a Fed rate hike next week, a sharp shift from prior expectations. AI infrastructure spending by Alphabet and Tesla is adding a new layer of rate sensitivity to Big Tech stocks.
---
#### FAQ
**Why are global stocks falling this week?**
A near-40% rise in oil prices this month, driven by escalating conflict in the Middle East, has reignited inflation fears and pushed bond yields to multi-decade highs, weighing on stocks worldwide.
**Why did oil prices spike and then pull back?**
Brent crude surged 7% to a two-month high of $102 a barrel after Houthi attacks on Saudi tankers threatened a key Red Sea shipping route, then eased back to around $98.70 as the initial shock settled.
**Is the Federal Reserve going to raise interest rates?**
Markets are now pricing in roughly a one in three chance of a Fed rate hike as soon as next week, with a September increase considered more likely than not, a significant shift from expectations just a week earlier.
**Why is the Japanese yen so weak right now?**
The yen is trading near 163.79 per dollar, its weakest level in about 40 years, as rising U.S. Treasury yields boost the dollar. Japan has issued intervention warnings before but previous yen-buying efforts had limited lasting effect.
**Why are Alphabet and Tesla’s earnings affecting the broader market?**
Both companies reported heavy cash burn from AI infrastructure spending without clear evidence of returns yet, raising concerns that heavily AI-invested megacap stocks are becoming more sensitive to interest rate moves.
### **Stay Ahead of the Markets**
Markets move fast, and the biggest opportunities often emerge before they make the headlines. Follow **DF Media** for real-time market updates, in-depth financial analysis, startup news, AI developments, and global business insights that matter.
[👉 **Explore the latest market coverage**](https://df.media/)
**Categories:** Banking, Global News, oil
---
### [Stripe, Advent Bid $53B to Buy PayPal in 2026](https://df.media/stripe-paypal-acquisition-2026/)
**Published:** July 15, 2026
**Author:** Jonathan Algreen
**Content:**
July 15, 2026
- [Stripe PayPal Acquisition: What Is Happening](#what-is-happening)
- [Deal Structure and Financing](#deal-structure-and-financing)
- [Why It Matters](#why-it-matters)
- [PayPal’s Decline and Turnaround Effort](#pay-pals-decline-and-turnaround-effort)
- [What Investors Need to Know](#what-investors-need-to-know)
- [What Comes Next](#what-comes-next)
- [Key Takeaways](#key-takeaways)
- [How much is Stripe and Advent offering to pay for PayPal?](#faq-question-1784094345329)
- [What premium does the Stripe PayPal acquisition offer represent?](#faq-question-1784094512449)
- [Would Stripe fully own PayPal if the deal goes through?](#faq-question-1784094634430)
- [How is the PayPal buyout offer being financed?](#faq-question-1784095031743)
- [Has PayPal responded to the acquisition offer?](#faq-question-1784095384493)
- [Why has PayPal’s value declined so much before this offer?](#faq-question-1784095853159)
## Stripe PayPal Acquisition: What Is Happening
Payments company Stripe and private equity firm Advent International have made a joint offer to acquire PayPal Holdings for $60.50 a share, in a deal that would value the company at more than $53 billion, according to [Reuters](https://www.reuters.com/). The bid represents roughly a 28 percent premium to PayPal’s closing share price on Tuesday, July 14.
The Stripe PayPal acquisition offer was submitted earlier this month and follows an initial approach made in early April, according to people familiar with the matter who were not authorized to speak publicly. PayPal, Stripe, and Advent have not commented publicly on the discussions.
Stripe and Advent have not yet received a response from PayPal’s board and are seeking to advance talks in the coming weeks, the people said. There is no certainty the approach will result in a completed transaction.
## Deal Structure and Financing
Under the proposal, Stripe and Advent would jointly own PayPal, with each holding an equal stake, rather than breaking the company apart or absorbing it into Stripe’s existing operations. The offer is backed by approximately $50 billion in committed financing from banks, underscoring the scale of the transaction and the seriousness of the bid.
A joint-ownership structure is notable for a deal of this size. It suggests Stripe, still a private company, is using Advent’s balance sheet and access to debt markets to fund a transaction that would otherwise be difficult to finance alone, even at Stripe’s current valuation.
## Why It Matters
PayPal was one of the earliest and most recognized names in digital payments, dating back to the late 1990s. Its position has eroded steadily as consumers shifted toward alternative payment methods and rivals including Apple Pay and Google Pay expanded their share of checkout volume.
The Stripe PayPal acquisition bid also reflects Stripe’s own trajectory. The company was valued at $159 billion in a February 2026 tender offer for employees and shareholders, a roughly 70 percent increase from its $91.5 billion valuation a year earlier, according to CNBC. Stripe processed nearly $1.9 trillion in total payment volume in 2025, up 34 percent from the prior year, and has said it was profitable last year while continuing to pursue acquisitions.
Acquiring PayPal would give Stripe a widely recognized consumer brand, a large existing base of merchant and consumer accounts, the Venmo peer-to-peer platform, and established global payment rails that would otherwise take years to build organically.
The fintech revolution is accelerating in 2026. Stay informed on every funding round, product launch, and regulatory shift shaping the future of finance. Follow FinTech News at [DF.Media](https://df.media/).
## PayPal’s Decline and Turnaround Effort
PayPal’s market capitalization peaked at roughly $360 billion in 2021 before falling to as low as approximately $36 billion this year, wiping out much of the value it gained during the pandemic-era surge in e-commerce. The stock has lost more than 40 percent of its market value over the past 12 months.
PayPal shares were trading around $47.37 on July 15, within a day’s range of $46.43 to $47.40, according to market data. The stock’s 52-week range spans a low of $38.46 to a high of $79.50, illustrating how far the shares have fallen from their post-pandemic highs even before this week’s takeover reporting.
Enrique Lores took over as PayPal’s CEO in March 2026 and has since launched a turnaround effort aimed at simplifying the company and sharpening its focus on growth. In April, PayPal split its operations into three units covering checkout, the Venmo consumer financial services business, and payments and crypto, alongside a series of management changes.
## What Investors Need to Know
For investors tracking the Stripe PayPal acquisition, the 28 percent premium embedded in the Stripe and Advent offer gives PayPal shareholders an immediate reference point against the stock’s depressed trading range. Investors should watch for any formal response from PayPal’s board, which has not yet engaged publicly with the proposal.
Regulatory scrutiny is also worth monitoring. A combination of two of the largest names in digital payments would likely draw attention from antitrust regulators given the scale of both companies’ merchant and consumer networks, even though Stripe remains privately held and PayPal is publicly traded.
The joint-ownership structure between Stripe and Advent adds complexity to how a deal might ultimately be financed and governed if talks advance, which is a factor sophisticated investors will likely weigh alongside the headline premium.
## What Comes Next
Stripe and Advent are seeking to advance discussions with PayPal in the coming weeks, according to the people familiar with the matter. Given that the initial approach dates back to early April, the pace of these talks suggests both sides are treating the process deliberately rather than rushing toward a public announcement.
As the Stripe PayPal acquisition process unfolds, PayPal’s board will need to weigh the offer against its own turnaround plan under CEO Lores, which is still in its early stages following April’s reorganization into three business units. A rejection or counteroffer are both plausible outcomes, as is an extended period of continued private negotiation before any public confirmation.
Wall Street does not wait. Stay ahead of every index move, earnings surprise, and Fed decision that matters to your portfolio. Track Market Moves at DF.Media.
## Key Takeaways
The Stripe PayPal acquisition, in short: Stripe and Advent International have offered $60.50 a share to acquire PayPal Holdings, valuing the company at more than $53 billion and representing a 28 percent premium to Tuesday’s closing price. The offer, backed by about $50 billion in committed bank financing, would result in Stripe and Advent jointly owning PayPal with equal stakes.
PayPal’s market value has fallen from a 2021 peak of roughly $360 billion to as low as $36 billion this year, losing more than 40 percent over the past 12 months, even as new CEO Enrique Lores pursues a turnaround built around a three-unit restructuring launched in April. Stripe, meanwhile, was valued at $159 billion in a February 2026 tender offer, giving it substantial scale to pursue a deal of this size alongside Advent’s financing.
This article is for informational purposes only and does not constitute financial advice. Always conduct your own research before making any investment decisions.
### How much is Stripe and Advent offering to pay for PayPal?
Stripe and Advent International have offered $60.50 per share, valuing PayPal Holdings at more than $53 billion, according to people familiar with the matter cited by Reuters.
### What premium does the Stripe PayPal acquisition offer represent?
The offer represents approximately a 28 percent premium to PayPal’s closing share price on Tuesday, July 14, 2026.
### Would Stripe fully own PayPal if the deal goes through?
No. Under the proposal, Stripe and Advent International would jointly own PayPal with each holding an equal stake, rather than one party taking full control or breaking up the company.
### How is the PayPal buyout offer being financed?
The offer is backed by approximately $50 billion in committed financing from banks, according to people familiar with the discussions.
### Has PayPal responded to the acquisition offer?
As of July 15, 2026, Stripe and Advent had not received a response from PayPal, and the companies are seeking to advance discussions in the coming weeks. PayPal, Stripe, and Advent have not publicly commented on the talks.
### Why has PayPal’s value declined so much before this offer?
PayPal’s market capitalization fell from a 2021 peak of about $360 billion to as low as roughly $36 billion this year, a decline of more than 40 percent over the past 12 months, driven by slowing growth and intensifying competition from rivals like Apple Pay and Google Pay.
**Categories:** Banking
---
### [SpaceX Stock Price Target Hits $300 as Morgan Stanley Bets on AI](https://df.media/spacex-stock-price-target-ai/)
**Published:** July 21, 2026
**Author:** Laura Anderson
**Excerpt:** Morgan Stanley set a Street high SpaceX stock price target of 300 dollars, betting the rocket company becomes an AI infrastructure giant in orbit.
**Content:**
## Table of Contents
- [Morgan Stanley Sets a Street High SpaceX Stock Price Target](#morgan-stanley-sets-a-street-high-space-x-stock-price-target)
- [Why the SpaceX Stock Price Target Leans on AI, Not Rockets](#why-the-space-x-stock-price-target-leans-on-ai-not-rockets)
- [Four Pillars Behind the Number](#four-pillars-behind-the-number)
- [Starmind and the Push to Put Data Centers in Orbit](#starmind-and-the-push-to-put-data-centers-in-orbit)
- [The Bull and Bear Case Behind the Number](#the-bull-and-bear-case-behind-the-number)
- [What It Means for Investors](#what-it-means-for-investors)
- [What is the new SpaceX stock price target from Morgan Stanley?](#faq-question-1784607145570-0)
- [Why is Morgan Stanley’s price target tied to AI instead of rockets?](#faq-question-1784607145570-1)
- [What is Starmind?](#faq-question-1784607145570-2)
- [How does SpaceX joining the Nasdaq 100 affect the stock?](#faq-question-1784607145570-3)
- [What are the biggest risks to this price target?](#faq-question-1784607145570-4)
- [How does this compare to other Wall Street ratings on SpaceX?](#faq-question-1784607145570-5)
- [Final Thoughts](#final-thoughts)
## Morgan Stanley Sets a Street High SpaceX Stock Price Target
Wall Street just made its boldest call yet on Elon Musk’s rocket company. Morgan Stanley set a SpaceX stock price target of 300 dollars a share, the highest of any major bank covering SPCX. The call, published in a note titled AI’s Final Frontier, implies roughly 87 percent upside from where shares were trading before the report landed.
Lead analyst Adam Jonas is not betting on rockets alone. He is betting that [SpaceX becomes an AI infrastructure company](https://df.media/ai-ipo-2026-openai-anthropic-spacex/) with a launch business attached, rather than the other way around. That framing is the real story behind this bold new valuation, and it says a lot about where analysts think the AI trade is heading next.
The timing matters for investors too. Morgan Stanley’s note landed as SpaceX joined the Nasdaq 100 under the exchange’s fast entry rule, just weeks after an IPO that already stunned markets. Index inclusion alone could pull in billions of dollars in passive fund flows, adding another layer of demand behind this SpaceX stock price target on top of the analyst upgrade.
## Why the SpaceX Stock Price Target Leans on AI, Not Rockets
Jonas describes SpaceX as holding what he calls an X of 1 position in space infrastructure. In plain terms, there is no real competitor doing what SpaceX does across launch, satellite connectivity, and now orbital compute. That combination is central to why this valuation call sits so far above rival estimates from Wells Fargo, UBS, Goldman Sachs, Citi, and Bernstein.
Morgan Stanley’s model has SpaceX revenue climbing from about 45 billion dollars this year to 319 billion dollars by 2030, and to 3.3 trillion dollars by 2040. Most of that growth is not tied to rocket launches. It comes from data centers, AI services, and connectivity products that barely exist as revenue lines today.
That is an aggressive forecast by any measure, and it explains the stock’s wild ride since its [record 75 billion dollar IPO](https://df.media/spacex-ipo-2026-record-75b-offering-hits-markets/). Shares ran as high as 225 dollars before sliding back toward the 120s, a reminder that a bold SpaceX stock price target can move markets long before the underlying business catches up.
## Four Pillars Behind the Number
The Morgan Stanley note breaks SpaceX into four connected businesses. Launch is the foundation, anchored by Starship, which Jonas expects to become fully operational later this year. He projects launch costs falling toward 500 dollars per kilogram by 2030 and under 150 dollars by 2040 as flight cadence scales into the thousands annually.
Starlink is the second pillar, evolving from a satellite internet service into what Morgan Stanley calls the default connectivity layer for devices outside the reach of ground networks. The third pillar is terrestrial AI, where SpaceX is building land based data centers through in house ventures for chips and solar power, aiming for lower costs per watt than typical hyperscale operators.
The fourth pillar is enterprise AI, including cloud rental agreements with major AI labs and the roughly 60 billion dollar acquisition of coding startup Cursor, whose annual recurring revenue has grown from about 500 million to 4 billion dollars in a year. Jonas argues the market has not fully priced that asset yet.
## Starmind and the Push to Put Data Centers in Orbit
The most futuristic piece of the thesis is Starmind, a planned constellation of AI satellites designed to function as data centers in low Earth orbit. SpaceX hopes to launch the first Starmind satellites on Starship as soon as next year, turning solar power collected in space directly into computing capacity.
The logic connects to a real constraint on Earth. Land based data centers are running into power shortages, permitting delays, and local opposition in several US markets. Orbital compute sidesteps some of that friction, at least on paper, by tapping constant solar exposure instead of a strained regional power grid.
It is still an unproven idea at commercial scale. No company has demonstrated that orbital data centers can compete with ground based facilities on cost or reliability. That gap between ambition and proof is exactly what makes this bet such a high conviction, high risk call for investors.
## The Bull and Bear Case Behind the Number
Morgan Stanley did not present 300 dollars as a sure thing. The bank’s bull case reaches 600 dollars a share, implying a market value near 8 trillion dollars, assuming faster execution across Starship, orbital compute, and its in house chip unit, with AI representing more than 60 percent of the company’s value.
The bear case falls to just 75 dollars, below where SPCX trades today. That scenario assumes Starship slips to 2029 and AI monetization falls short, leaving space and connectivity as roughly 90 percent of the valuation instead of AI. Jonas also flagged capital spending needs approaching 300 billion dollars a year by 2031, which could require tens of billions in external financing annually.
Other risks include SpaceX’s heavy reliance on Musk personally, potential conflicts with his other ventures including Tesla and xAI, and regulatory exposure spanning orbital debris rules, export controls, and emerging AI oversight. None of these risks are unique to SpaceX, but few companies carry all of them at once.
## What It Means for Investors
For investors, the takeaway is that this valuation call is less a statement about rockets and more a statement about where Wall Street thinks AI infrastructure spending goes next. That view lines up with the broader market mood, where [Wall Street’s AI dominance keeps pulling in investor capital](https://df.media/european-stocks-gain-fresh-momentum-but-wall-streets-ai-dominance-keeps-investors-loyal/) even as volatility rises elsewhere.
Chip demand remains central to that story too. Recent [chip stock surges tied to AI buildout spending](https://df.media/markets-today-june-25-chip-stocks-oil-crash-fed-rate-debate/) show how closely SpaceX’s fortunes are now linked to the same semiconductor cycle driving Nvidia, TSMC, and Micron, even though SpaceX builds rockets rather than chips.
Whether the bet pays off will not be clear for years. Shares remain volatile, trading well below their post IPO high, and an IPO lockup expiration in August could bring another wave of selling. Investors weighing this SpaceX stock price target should treat it as a long duration, high variance bet rather than a near term price prediction.
### What is the new SpaceX stock price target from Morgan Stanley?
Morgan Stanley set a base case target of 300 dollars a share for SpaceX stock, with a bull case of 600 dollars and a bear case of 75 dollars, reflecting a wide range of possible outcomes.
### Why is Morgan Stanley’s price target tied to AI instead of rockets?
Most of Morgan Stanley’s projected revenue growth comes from AI related businesses, including orbital compute, terrestrial data centers, and enterprise AI services, rather than from launch revenue alone.
### What is Starmind?
Starmind is SpaceX’s planned constellation of AI satellites intended to function as data centers in orbit, with the first launches targeted for as soon as next year on Starship.
### How does SpaceX joining the Nasdaq 100 affect the stock?
Index inclusion typically forces passive funds tracking the Nasdaq 100 to buy shares, which analysts estimate could bring several billion dollars in additional demand.
### What are the biggest risks to this price target?
Key risks include enormous capital spending needs, reliance on Elon Musk, unproven orbital compute technology, and regulatory exposure across space, export, and AI policy.
### How does this compare to other Wall Street ratings on SpaceX?
Morgan Stanley’s 300 dollar target is the highest among major banks. Wells Fargo, UBS, Goldman Sachs, Citi, and Bernstein have all issued lower price targets since coverage began.
## Final Thoughts
This SpaceX stock price target is a bet on a future that does not exist yet, orbital data centers, planet scale connectivity, and an AI business bigger than the rocket company that built it. It may prove prescient, or it may prove premature. For now, it is one of the clearest signals yet that Wall Street sees the next phase of the AI race being fought in space as much as on the ground.
For more coverage on SpaceX, AI infrastructure spending, and what it means for your portfolio, keep following [Daily Finance](https://df.media/) for daily market breakdowns.
Source: [The Motley Fool](https://www.fool.com/investing/2026/07/19/morgan-stanley-set-a-300-price-target-on-elon-musk/)
**Categories:** Capital Markets, Investing
**Tags:** ai, AI stocks, elon musk, Morgan Stanley, SpaceX
---
### [Strait of Hormuz Oil Prices Jump on US-Iran Strikes](https://df.media/strait-of-hormuz-oil-prices-jump/)
**Published:** July 13, 2026
**Author:** Laura Anderson
**Excerpt:** Strait of Hormuz tensions are driving oil prices jump as the US and Iran trade fresh military strikes, shipping collapses.
**Content:**
**Key Facts**
- [Brent crude touched $79 a barrel Monday](https://www.reuters.com/business/energy/oil-jumps-more-than-3-after-us-iran-launch-strikes-mideast-2026-07-12/), its highest since June 22, before easing to $77.68 (+2.2%)
- The US carried out a fourth wave of strikes on Iran in a week; Iran retaliated against US-linked sites in the Gulf
- Ship traffic through the strait fell to a five-week low: just six vessels crossed on Sunday, per Kpler
- ADNOC cut its August Murban crude price to $80.01, down from $101.48 in July
- Goldman Sachs estimates pipeline bypass routes could shield 60%+ of pre-war Gulf exports from Hormuz disruptions by 2028
Strait of Hormuz oil prices jumped again Monday after the United States and Iran exchanged a fresh round of strikes, reviving fears that the fragile ceasefire between the two countries is falling apart. Brent crude touched $79 a barrel intraday, its highest level since June 22, before easing to trade up 2.2% at $77.68 by mid-morning GMT. West Texas Intermediate rose a similar amount to $73.00.
**Why the Strait of Hormuz Is Back in the Spotlight**
The latest flare-up began after Iran’s Revolutionary Guard struck a Cyprus-flagged container ship transiting the strait over the weekend. US Central Command answered with a fourth wave of strikes in a week, hitting dozens of additional targets early Monday and using one-way attack drones at sea for the first time. That pushed the total number of targets hit over the past week past 300, following a 140-target strike on Saturday alone.
Iran retaliated by targeting US-linked sites in Bahrain, Kuwait and Jordan on Sunday. Its Revolutionary Guards said Monday they had struck US military bases in Kuwait and Bahrain again. Iran’s self-declared Strait Authority says the waterway is closed to unauthorized traffic. However, President Trump and US Central Command have both said the strait remains open to commercial shipping, a direct contradiction that is keeping traders on edge.
**Shipping Through the Strait of Hormuz Nears a Standstill**
Regardless of who is right, the traffic data tells its own story. Ship-tracking firm Kpler recorded just six vessels crossing the strait on Sunday, a five-week low, down from roughly 30 to 40 tankers and bulk carriers a day the previous week. Before the war began in late February, the Strait of Hormuz carried about one-fifth of the world’s daily oil and LNG supply, which is why even a partial slowdown moves the market this much.
**Markets React Across Asia and Beyond**
Asian equities fell sharply on the renewed fighting, with Japan’s Nikkei 225 and South Korea’s Kospi both down and US stock futures softer ahead of the open. UN Secretary-General António Guterres called on both sides to show restraint, warning that a full return to conflict would carry serious consequences for regional stability and the broader global economy.
The risk premium is also spilling into borrowing costs. US mortgage rates ticked back up alongside the latest spike, unwinding some of the relief markets had priced in after June’s ceasefire. Higher oil tends to feed directly into inflation expectations, which is the main channel connecting a Gulf shipping dispute to a US homebuyer’s rate quote.
**A Ceasefire Under Strain**
The standoff traces back to disagreements over how the Strait of Hormuz was supposed to reopen under the interim memorandum of understanding the two countries signed on June 17, ending nearly four months of war. That deal gave both sides 60 days to negotiate a lasting settlement. Iran wants ships to use a northern route through its territorial waters, arguing it controls the strait, while the US insists on keeping the southern corridor open under military protection. That unresolved question is now the single biggest swing factor in oil markets.
**Is There a Long-Term Fix for the Strait of Hormuz?**
Even amid the latest spike, there are signs the market sees this as more containable than the war’s first months. Goldman Sachs estimates that expanding pipeline capacity across the Middle East could shield more than 60% of pre-war Gulf oil exports from future Hormuz disruptions by the end of 2028, with total bypass capacity rising above 14 million barrels per day by then.
Meanwhile, ADNOC set its August official selling price for Murban crude at $80.01 a barrel, down sharply from $101.48 in July, a sign that much of the earlier war premium had already come out of the market before this weekend’s escalation. Iranian oil held at sea is rising too, as Chinese independent refiners increasingly buy cheaper crude from Iraq, the UAE and Qatar instead.
Most analysts still expect this exchange to stay contained rather than spiral into a wider war, pointing to rising OPEC+ output and pipeline capacity being built specifically to reduce Hormuz dependency. Until both sides show real signs of stepping back, though, oil markets are likely to keep trading every headline out of the Gulf.
---
**Stay ahead of the next move in oil markets.** Daily Finance tracks Brent, WTI, and every twist in the US-Iran standoff as it develops. [Visit Daily Finance](https://df.media/) for real-time market coverage, or browse our [Finance section](https://df.media/category/finance/) for more analysis like this.
### FAQs
**Why are oil prices rising right now?**
Oil prices rose after the US and Iran exchanged a fresh round of strikes over the Strait of Hormuz, reviving fears that the June ceasefire is collapsing and that shipping through the waterway will stay disrupted.
**Is the Strait of Hormuz closed?**
Iran says it’s closed to unauthorized traffic. The US says it’s open. Ship-tracking data shows real traffic has fallen to a five-week low regardless of the dispute.
**How much oil moves through the Strait of Hormuz?**
Before the war began in late February 2026, the strait carried roughly one-fifth of the world’s daily oil and LNG supply.
**What was the US-Iran ceasefire that’s now at risk?**
An interim memorandum of understanding signed June 17, 2026, meant to reopen the strait and lead to a full peace deal after 60 days of further talks.
**How is Goldman Sachs viewing the long-term risk?**
It estimates pipeline capacity expansion could shield over 60% of pre-war Gulf oil exports from future Hormuz disruptions by the end of 2028.
**Why did ADNOC cut its oil price if tensions are rising?**
The August Murban cut reflects how much of the earlier war premium had already faded before this weekend’s escalation, not a forecast of where prices go next.
**Categories:** Global News
**Tags:** oil prices
---
### [Oil Prices 2026: Brent Nears $76 as Hormuz Risk Persists](https://df.media/oil-prices-2026-hormuz-risk/)
**Published:** July 10, 2026
**Author:** Vishnu Priya
**Content:**
July 10, 2026
## What Is Happening
Oil prices 2026 trading eased Friday but remained on track for a solid weekly gain as renewed fighting between the U.S. and Iran continued to disrupt shipping through the Strait of Hormuz, according to Reuters. Brent futures fell 19 cents, or 0.3 percent, to $76.11 a barrel by 1007 GMT. West Texas Intermediate crude dropped 21 cents, or 0.3 percent, to $71.87.
For the week, Brent was set for a gain of about 6 percent and WTI was on track for an increase of about 5 percent, Reuters reported. The pullback from midweek highs came even as the underlying risk premium stayed firmly in place.
“Prices have backed off the midweek highs, but there is still a substantial risk premium as Hormuz transits are back to a near-standstill with no clear signs of when normal reopening might resume,” said Vandana Hari, founder of oil market analysis provider Vanda Insights.
## Market Data: Brent, WTI, and the Oil Prices 2026 Weekly Gain
Iranian armed forces launched attacks on U.S. military infrastructure in Gulf states on Thursday, following U.S. strikes on Iran’s southern coastal and eastern provinces, further straining an already fragile ceasefire, according to Reuters. Iranian media separately reported multiple explosions across southern Iran, including near Bushehr, where one of the country’s nuclear plants is located.
Tanker traffic through the Strait of Hormuz was at a near-standstill on Thursday, ship-tracking data showed, as vessel owners assessed risk after Iran struck a Qatari LNG ship exiting the waterway near Oman. The strait carried about 20 percent of daily global oil and gas supplies before the war began on February 28, according to Reuters.
The International Energy Agency said Friday that the escalation between the U.S. and Iran could upend its forecast of a significant oil market surplus next year. That warning adds a fresh layer of uncertainty to a market that had, until recently, priced in ample supply heading into 2027.
## Why It Matters
The Strait of Hormuz sits at the center of this week’s price action, and for good reason. A chokepoint that normally moves a fifth of the world’s daily oil and gas cannot slow to a near-standstill without consequences, even if actual physical supply has not yet been meaningfully disrupted. Markets tend to price geopolitical risk premiums well before barrels are actually stranded.
The IEA’s warning compounds that risk. An agency that has spent much of the year forecasting a supply glut into 2027 now says sustained U.S.-Iran escalation could undermine that outlook entirely. For traders positioned for lower prices on expectations of oversupply, that is a meaningful shift in the narrative.
Wall Street does not wait. Stay ahead of every index move, earnings surprise, and Fed decision that matters to your portfolio. Track Market Moves at DF.Media.
## Expert and Institutional Reaction
UBS analyst Giovanni Staunovo said the lack of any new U.S. strikes on Iran overnight was probably weighing on oil prices Friday, though the drop in flows through the Strait of Hormuz was limiting the downside, according to Reuters.
President Donald Trump said this week that he did not think the war would restart and that “anything that happens is going to be over very quickly.” ANZ commodity strategist Daniel Hynes added a note of cautious reassurance. “Despite the U.S. ramping up attacks on military sites in Iran, the market drew some reassurance from the Trump administration’s decision to avoid targeting Iranian energy infrastructure,” Hynes said.
That distinction, striking military targets while avoiding energy infrastructure directly, has become one of the more closely watched signals for traders trying to gauge how far the conflict might escalate.
## What Investors and Traders Need to Know About Oil Prices 2026
Traders should watch the Strait of Hormuz tanker data closely into next week. A near-standstill in transits is not the same as a closure, and any sign of vessel owners resuming normal routing would likely pull the geopolitical risk premium out of prices quickly. Conversely, a prolonged standstill keeps upward pressure on both Brent and WTI regardless of underlying supply and demand fundamentals.
Energy-linked equities and inflation-sensitive assets remain worth monitoring alongside crude itself. A sustained move higher in oil prices 2026 feeds directly into the inflation debate already shaping Federal Reserve policy discussions, adding another variable for investors positioning around interest rate expectations. The IEA’s revised caution on its 2027 surplus forecast also matters for anyone holding positions premised on oversupply later this decade.
## What Comes Next
Diplomatic signals will likely drive the next major move in oil prices 2026. Trump’s comments this week, along with reports that Iran has reached out to explore a deal, suggest both sides may still prefer to avoid a full-scale, prolonged conflict. Technical talks between Washington and Tehran were said to be continuing, according to reporting cited by Reuters.
Barring a durable de-escalation, expect the risk premium embedded in Brent and WTI to persist. The IEA’s warning on its 2027 surplus forecast suggests the agency itself sees this as more than a short-term disruption if hostilities continue. Markets will be watching for any resumption of normal Strait of Hormuz transit volumes as the clearest signal that the worst of the supply risk has passed.
This story is moving fast. Get every update, analysis, and market reaction as it happens. Follow Breaking Finance News at DF.Media.
## Key Takeaways
Brent crude eased 0.3 percent to $76.11 a barrel and WTI fell 0.3 percent to $71.87 on Friday, July 10, 2026, but both remain on track for solid weekly gains of roughly 6 percent and 5 percent respectively. Tanker traffic through the Strait of Hormuz, which normally carries about 20 percent of global oil and gas supply, was at a near-standstill after fresh U.S.-Iran strikes this week.
The IEA warned that continued escalation could undermine its forecast of a significant oil market surplus in 2027. President Trump said he does not expect the conflict to restart in a sustained way, while analysts at UBS and ANZ pointed to the absence of strikes on Iranian energy infrastructure as a stabilizing signal for prices.
This article is for informational purposes only and does not constitute financial advice. Always conduct your own research before making any investment decisions.
### Why are oil prices 2026 still rising despite Friday’s pullback?
Brent and WTI both eased slightly on Friday but remain on track for weekly gains of about 6 percent and 5 percent respectively, as the risk premium tied to disrupted Strait of Hormuz shipping has not fully unwound, according to Reuters.
### What is happening in the Strait of Hormuz right now?
Tanker traffic through the strait was at a near-standstill on Thursday as vessel owners assessed risk following renewed U.S.-Iran strikes, including an Iranian attack on a Qatari LNG ship near Oman.
### How much of global oil supply moves through the Strait of Hormuz?
The strait carried about 20 percent of daily global oil and gas supplies before the war began on February 28, 2026, according to Reuters.
### What did the IEA say about the 2027 oil market outlook?
The International Energy Agency said continued U.S.-Iran escalation could threaten its forecast of a significant oil market surplus next year, adding uncertainty to a previously bearish supply outlook.
### Is the U.S.-Iran conflict expected to escalate further?
President Trump said this week he does not expect the war to restart in a sustained way, and analysts noted the Trump administration has so far avoided striking Iranian energy infrastructure directly, which markets have read as a stabilizing signal.
**Categories:** Banking
---
### [SK Hynix IPO 2026: $29B Nasdaq Debut Stuns Wall Street](https://df.media/sk-hynix-ipo-2026/)
**Published:** July 9, 2026
**Author:** Vishnu Priya
**Excerpt:** SK Hynix IPO 2026 news: $29B Nasdaq debut is 7x oversubscribed as S&P 500 futures rise July 9. Full market breakdown inside.
**Content:**
- [What Is Happening](#what-is-happening)
- [SK Hynix IPO 2026: Futures, Oil, and Market Data](#sk-hynix-ipo-2026-futures-oil-and-market-data)
- [Why It Matters](#why-it-matters)
- [Expert and Institutional Reaction](#expert-and-institutional-reaction)
- [What the SK Hynix IPO 2026 Means for Investors and Traders](#what-the-sk-hynix-ipo-2026-means-for-investors-and-traders)
- [What Comes Next](#what-comes-next)
- [Key Takeaways](#key-takeaways)
- [FAQ](#faq)
## What Is Happening
The SK Hynix IPO 2026 debut is colliding with a jittery Wall Street this week. S&P 500 and Nasdaq futures edged higher Thursday, July 9, 2026, even as fresh U.S. strikes on Iran threatened to prolong a four month conflict in the Middle East. The U.S. military struck roughly 90 Iranian targets early Thursday to keep the Strait of Hormuz open to shipping, according to [Reuters](https://www.reuters.com/business/wall-st-futures-rebound-oil-retreats-investors-weigh-us-iran-tensions-2026-07-09/). Iran responded with attacks on Kuwait and Bahrain, deepening a confrontation that risks unraveling an already fragile ceasefire.
Here is the thing. Markets did not panic. At 7:36 a.m. ET, Dow E-minis were down 69 points, or 0.13 percent, while S&P 500 E-minis rose 11.25 points, or 0.15 percent, and Nasdaq 100 E-minis climbed 198.5 points, or 0.67 percent, Reuters reported. Chip stocks did the heavy lifting.
But wait, there is a bigger story unfolding in New York this week. SK Hynix, the world’s second largest memory chipmaker, is preparing to list on Nasdaq on July 10, 2026, in a $29 billion American depositary receipt offering that is already more than seven times oversubscribed, according to [Bloomberg](https://www.bloomberg.com/news/articles/2026-07-08/sk-hynix-us-offering-is-more-than-seven-times-oversubscribed).
## SK Hynix IPO 2026: Futures, Oil, and Market Data
Wednesday’s session told its own story. The Dow Jones Industrial Average fell 586 points, or 1.11 percent, to close at 52,339 on July 8, 2026. The S&P 500 slipped 0.28 percent, while the Nasdaq Composite eked out a 0.20 percent gain as chip names found buyers. Oil kept climbing.
Brent crude for August delivery traded near $78.77 per barrel, up almost 1 percent, and West Texas Intermediate rose 0.88 percent to $74.17 per barrel, after Washington revoked a temporary waiver on Iran oil sanctions. The iShares Semiconductor ETF (SOXX) gained 2.4 percent in premarket trading, offsetting weakness elsewhere.
IBM fell 3.8 percent and Microsoft dropped 1.5 percent after a report that Starbucks is using artificial intelligence to reduce its reliance on both companies. ServiceNow slid 3.8 percent and Adobe fell 3 percent. Meta Platforms dropped 1.2 percent despite plans to begin production of its own AI chip in September. Levi Strauss shares fell 4.4 percent even after the denim maker raised its annual sales forecast on July 8.
Meanwhile, SK Hynix’s offering of 177.9 million ADRs, priced indicatively around 242,500 won, or roughly $158.26 per ADR, drew demand from sovereign wealth funds, global long-only managers, and technology-focused investors. Anchor investors including Baillie Gifford, Coatue Management, and Situational Awareness Partners together indicated interest of up to $7 billion.
## Why It Matters
Here is why this week matters beyond the headlines. SK Hynix’s Nasdaq debut would rank as the largest ever U.S. listing by a foreign company, surpassing Alibaba’s $25 billion IPO in 2014, according to Bloomberg. A deal of this size, landing directly into a market rattled by geopolitical risk, signals that investors are willing to look past short term volatility when the underlying growth story, in this case artificial intelligence and high bandwidth memory demand, is strong enough.
At the same time, the Federal Reserve’s newly released June meeting minutes showed a hawkish undercurrent. Nine of 18 FOMC participants said they could support at least one rate increase before year end, even as the committee held its benchmark rate steady at 3.50 percent to 3.75 percent for a fourth straight meeting under new Chair Kevin Warsh.
Wall Street does not wait. Stay ahead of every index move, earnings surprise, and Fed decision that matters to your portfolio.
Track Market Moves at DF.Media: https://df.media/
## Expert and Institutional Reaction
“The path toward a lasting peace deal is likely to be bumpy, with periodic flare ups in tensions potentially triggering bouts of market volatility,” said Mark Haefele, chief investment officer at UBS Global Wealth Management. “But we also believe that both sides remain incentivized to keep the Strait of Hormuz open.”
Haefele added that Fed officials are likely to maintain their hawkish stance for now, with rhetoric expected to soften once policymakers grow more confident that second round inflation effects from the oil spike remain limited. On the SK Hynix deal, bankers involved in the offering told Bloomberg that demand exceeding seven times the shares available reflects investor appetite for direct U.S. exposure to Asia’s memory chip supply chain, which currently feeds Nvidia, Microsoft, and other major AI infrastructure buyers.
## What the SK Hynix IPO 2026 Means for Investors and Traders
Traders should watch three things Thursday. First, weekly jobless claims land at 8:30 a.m. ET, offering a fresh read on labor market health before New York Fed President John Williams speaks later in the day. Second, oil remains the swing factor. LSEG data shows traders are now pricing in at least one 25 basis point rate hike by year end, a shift driven largely by energy linked inflation risk.
Third, SK Hynix shares begin trading under the ticker SKHY on July 10, and early price action will be watched closely as a bellwether for whether investors are still willing to pay up for AI infrastructure exposure after a choppy few weeks for chip stocks. For continuing coverage of major U.S. listings and IPO pricing, see[ DF Media’s business desk](https://df.media/category/business/), which has tracked the SK Hynix IPO 2026 deal since it was first flagged in June. Levi Strauss’s post-earnings decline, despite a raised outlook, is a reminder that solid results are not guaranteed to move a stock higher in this environment.
## What Comes Next
Expect volatility to stay elevated through the SK Hynix pricing and listing on July 10, 2026, and through any further escalation between the U.S. and Iran. UBS’s Haefele expects sentiment to stabilize once markets get more clarity on whether the Strait of Hormuz stays open to shipping.
On the policy side, investors will parse every comment from Chair Kevin Warsh and other Fed officials for signs of whether the hawkish minority gains ground before the next meeting. Analysts expect chip stocks broadly to remain sensitive to AI capital spending headlines, including Meta’s reported plan to move its own AI chip into production in September. As[ DF Media’s finance coverage ](https://df.media/category/finance/)has noted throughout this cycle, markets are increasingly treating geopolitical risk and AI infrastructure investment as two sides of the same trade.
This story is moving fast. Get every update, analysis, and market reaction as it happens.
Follow Breaking Finance News at DF.Media: https://df.media/
## Key Takeaways
S&P 500 and Nasdaq futures rose modestly Thursday morning even as the U.S. and Iran traded strikes, while Dow futures slipped on losses in IBM and Microsoft. The iShares Semiconductor ETF gained 2.4 percent, led by optimism around SK Hynix IPO 2026’s Nasdaq debut. SK Hynix IPO 2026’s $29 billion ADR offering, priced around $158.26 per share, is more than seven times oversubscribed and would rank as the largest ever U.S. listing by a foreign company.
Brent crude traded near $78.77 per barrel after Washington revoked an Iran oil sanctions waiver. The Fed under Kevin Warsh held rates at 3.50 percent to 3.75 percent, though nine of 18 officials floated a hike before year end. Levi Strauss fell 4.4 percent despite raising its outlook.
## FAQ
What is SK Hynix’s IPO price on Nasdaq?
SK Hynix’s indicative ADR price is set around 242,500 won, or approximately $158.26 per American depositary receipt, with the final price confirmed around the July 10, 2026 listing.
Why are S&P 500 and Nasdaq futures rising despite US-Iran tensions?
Futures rose because chip stocks, led by the iShares Semiconductor ETF’s 2.4 percent gain, offset concerns tied to fresh U.S. strikes on Iran. Investors also appear to be pricing in UBS’s view that both sides remain incentivized to keep the Strait of Hormuz open.
How oversubscribed is the SK Hynix Nasdaq offering?
The offering is more than seven times oversubscribed, with demand from sovereign wealth funds, global long-only managers, and anchor investors including Baillie Gifford and Coatue Management.
What did the Federal Reserve decide at its June 2026 meeting?
The Fed held its benchmark rate steady at 3.50 percent to 3.75 percent for a fourth consecutive meeting under new Chair Kevin Warsh, though minutes released July 8 showed nine of 18 officials open to a rate hike before year end.
Why did oil prices rise this week?
Oil rose after the U.S. revoked a temporary waiver on Iran oil sanctions and following President Trump’s comments that a ceasefire understanding with Iran was over, pushing Brent crude toward $78.77 per barrel.
Why did Levi Strauss stock fall despite raising guidance?
Levi Strauss shares dropped 4.4 percent even after raising its annual sales forecast on July 8, 2026, a sign that investors are demanding more than in-line results in the current volatile market environment.
This article is for informational purposes only and does not constitute financial advice. Always conduct your own research before making any investment decisions.
**Categories:** Banking
---
### [Gold Price Fed Minutes 2026 — Dollar Jumps as US Renews Strikes on Iran](https://df.media/gold-price-2026-dollar-surges-as-us-strikes-iran/)
**Published:** July 8, 2026
**Author:** Laura Anderson
**Excerpt:** Gold price 2026: dollar hits a weekly high as US strikes on Iran rattle markets. Fed minutes due 1800 GMT. Key data for investors..
**Content:**
July 8, 2026
**Table of Contents**
1. What Is Happening
2. Gold and Dollar Price Action
3. Why It Matters
4. Fed Reaction and Rate Hike Bets
5. What Investors and Traders Need to Know
6. What Comes Next
7. Key Takeaways
8. FAQ
## What Is Happening
Global markets turned defensive on Wednesday after the United States launched fresh strikes on Iran, reviving a geopolitical risk premium that had appeared to be fading just days earlier. The renewed military action sent the U.S. dollar to its highest level in roughly a week during Asian trading hours, according to Reuters. Gold, oil, and currency markets all moved in response, while equity futures stayed on edge ahead of a major data release later in the day.
Adding to the volatility, New Zealand’s central bank lifted interest rates and signaled further tightening ahead, sending the kiwi dollar sharply higher against its peers. The moves come just hours before the Federal Reserve releases the minutes from its June policy meeting, the first held under new Chair Kevin Warsh, at 1800 GMT.
## Gold and Dollar Price Action
Spot gold swung between gains and losses through the session, ultimately rising 0.5% to $4,125.59 per ounce as of 0305 GMT, according to Reuters. Earlier in the day, the metal had touched its lowest level since July 2 before recovering. U.S. gold futures for August delivery moved in the opposite direction, shedding 0.5% to settle at $4,136.30.
The push and pull in gold reflects a tug of war between two competing forces. Renewed conflict risk typically supports gold as a safe haven, but the same strikes also lifted oil prices and the U.S. dollar, both of which tend to weigh on bullion. A stronger dollar makes gold more expensive for holders of other currencies, while higher oil prices feed inflation concerns that raise the odds of continued Fed tightening, a headwind for non-yielding assets like gold.
Currency markets saw some of the sharpest moves of the session. The dollar’s climb to a one-week high came largely at the expense of currencies more exposed to energy-importing economies, while the New Zealand dollar bucked the broader risk-off tone entirely, jumping after the Reserve Bank of New Zealand’s hike and hawkish guidance.
## Why It Matters
Investors DF.Media reporters spoke with, cited in Wednesday’s Reuters coverage, framed the strikes as a meaningful escalation risk just as markets had begun pricing in a calmer path for Fed policy. Only days earlier, a weaker-than-expected June jobs report had pushed traders to scale back bets on additional rate hikes, with CME FedWatch data showing hike probabilities for September falling toward the 50% mark.
The Iran strikes complicate that narrative. Higher oil prices tend to filter into inflation readings within weeks, and a renewed inflation impulse would give the Fed less room to ease even if labor market data continues to soften. That tension between geopolitical risk and monetary policy is now the dominant theme heading into Wednesday afternoon’s minutes release.
[Track every rate decision, price move, and market-shifting event as it happens. Follow Daily Finance News at DF.Media](https://df.media/)
## Fed Reaction and Rate Hike Bets
Markets increased their Fed rate hike bets on Wednesday in direct response to the Iran news, according to Reuters. That marks a shift from the softer rate-hike odds seen earlier in the week, when the disappointing jobs report had traders leaning toward the Fed staying on hold or even easing later in the year.
The June meeting minutes, due at 1800 GMT, will be parsed closely for any language on how the committee under Chair Warsh is weighing the balance between a cooling labor market and persistent inflation risk. Traders will also be watching for any indication of internal disagreement among Fed officials, since a split committee could add further volatility to gold, the dollar, and rate-sensitive equity sectors once the minutes cross the wire.
## What Investors and Traders Need to Know
For gold investors, the key level to watch remains the $4,100 area, which has acted as a support zone on recent pullbacks. A close below that level on renewed dollar strength could open the door to a deeper correction, while any de-escalation headline out of the Middle East could just as quickly reverse today’s price action.
Currency traders should note that the dollar’s strength is not broad-based. It is concentrated against currencies more sensitive to energy prices, while commodity-linked and rate-differential currencies like the New Zealand dollar are moving on their own domestic catalysts. That divergence matters for anyone trading currency pairs rather than the dollar index in isolation.
Equity and crypto markets are also exposed to today’s cross-currents. Bitcoin has been trading near $63,600, according to Coinbase data, a level built largely on rate-cut optimism from last week’s jobs report. A hawkish surprise in the Fed minutes, combined with an extended Iran conflict, would test whether that rally has the momentum to hold.
[Bitcoin, Ethereum, and the broader crypto market never sleep. Get real-time insights, price analysis, and regulatory updates in one place. Follow Crypto News at DF.Media](https://df.media/)
## What Comes Next
The immediate catalyst is the 1800 GMT release of the Fed’s June minutes. Analysts expect the document to shed light on how officials are weighing the June jobs miss against inflation risk reintroduced by the Middle East conflict. Any signal that a September hike is back on the table, per CME Group’s FedWatch tool, would likely extend the dollar’s gains and pressure gold further.
Beyond the minutes, markets will be watching for further developments out of the Strait of Hormuz region, where shipping disruptions and any additional military action could keep oil prices elevated and complicate the inflation outlook well into the third quarter.
## Key Takeaways
The dollar hit a one-week high after the U.S. resumed strikes on Iran. Spot gold rose 0.5% to $4,125.59 per ounce after touching its lowest level since July 2, while gold futures slipped 0.5%. New Zealand’s central bank hiked rates and lifted the kiwi. Markets raised their Fed rate hike bets ahead of the June meeting minutes, due at 1800 GMT under Chair Kevin Warsh. Bitcoin remains near $63,600 as investors weigh whether rate-cut optimism can survive a more hawkish Fed setup.
[Global markets move fast. Stay ahead of every rate decision, price move, and market-shifting event as it happens. Follow Daily Finance News at DF.Media](https://df.media/)
## FAQ
**Why did the U.S. dollar rise on July 8, 2026?** The dollar climbed to its highest level in about a week after the United States renewed strikes on Iran, a move that lifted oil prices and pushed investors toward the currency as a haven, according to Reuters.
**What is the current gold price today?** Spot gold was trading at $4,125.59 per ounce as of 0305 GMT on July 8, 2026, up 0.5% on the day after earlier touching its lowest level since July 2, per Reuters data.
**When are the Fed’s June meeting minutes released?** The Federal Reserve is scheduled to release the minutes from its June policy meeting, the first under Chair Kevin Warsh, at 1800 GMT on July 8, 2026.
**Why did New Zealand’s dollar jump today?** The Reserve Bank of New Zealand raised interest rates and signaled further tightening ahead, which lifted the kiwi even as broader markets turned risk-averse on the Iran news.
**How are Fed rate hike odds changing?** Markets increased their bets on a Fed rate hike following the Iran strikes, a reversal from earlier in the week when a weak June jobs report had traders pricing in a lower probability of further tightening, according to CME FedWatch data cited by Reuters.
**How is Bitcoin reacting to today’s macro news?** Bitcoin has been trading near $63,600, according to Coinbase, with its recent rally built on rate-cut hopes that could be tested if the Fed minutes strike a more hawkish tone.
**Categories:** Banking, Finance, Global News
---
### [Oil Prices Today Slip as OPEC+ Raises Output Targets](https://df.media/oil-prices-today-opec-raises-output-eases-fears/)
**Published:** July 6, 2026
**Author:** Laura Anderson
**Excerpt:** Oil prices today slipped as OPEC+ agreed to raise output by 188,000 bpd from August, while Gulf exports recover from the Iran conflict.
**Content:**
**July 6, 2026**
Oil prices today edged lower after OPEC+ agreed to raise its output targets for August, adding to signs that global supply is recovering even as markets wait to see how U.S.-Iran relations develop this week.
Brent crude fell 34 cents, or 0.47%, to $71.78 a barrel in early Monday trading, giving back Friday’s gain. U.S. West Texas Intermediate slipped 20 cents to $68.49 a barrel. There was no settlement for WTI on Friday since U.S. markets were closed for the Independence Day holiday.
OPEC and its allies, including Russia, agreed on Sunday to raise output by 188,000 barrels per day starting in August, extending similar increases made in June and July. That’s part of why oil prices today are drifting rather than spiking, even with lingering geopolitical risk in the region.
### Why the OPEC+ Increase Matters Less Than It Looks
Analysts note the increase is largely symbolic for now. The war between the U.S., Israel and Iran shut the Strait of Hormuz to tanker traffic for months, capping output from major Gulf producers including Saudi Arabia, Kuwait and Iraq.
Tim Waterer, chief market analyst at KCM Trade, said traders coming off the long U.S. weekend are watching closely to see whether relations between Washington and Tehran stay calm or flare up again this week.
IG market analyst Tony Sycamore said the OPEC+ decision matched expectations but carries limited weight right now. He pointed to the UAE’s exit from the group and the fact that many members are still ramping production back up after the conflict. The UAE formally left OPEC on May 1.
### Gulf Exports Are Recovering, But Slowly
Gulf producers have started reviving supply that was shut in during the war. OPEC output jumped by 3.3 million barrels per day in June from May to reach 19.43 million bpd, according to a Reuters survey, recovering from its lowest level in more than two decades.
Gulf exports rose more than 3 million barrels per day over the same period to top 10 million bpd, though volumes remain 40% below pre-war levels. That gap is a big reason oil prices today haven’t fallen further despite the OPEC+ increase.
Russia’s oil exports from its western ports also hit a record high in June. Industry sources say Moscow is expected to keep exports elevated in July after Ukrainian drone strikes damaged domestic refineries, pushing more crude out to international markets.
### What to Watch This Week
Markets will continue watching diplomatic signals out of the Strait of Hormuz talks this week, along with fresh production data, for clues on where oil prices today will head next. A calm week between Washington and Tehran could accelerate the Gulf export recovery; renewed conflict could just as quickly reverse it.
**Stay ahead of the next move in oil markets.** DF Media’s energy desk tracks OPEC+ decisions, crude prices, and the Strait of Hormuz situation as they develop — before the headlines catch up.
👉 [Read more energy market coverage on DF Media](https://df.media/energy)
👉 [Visit DF Media for daily finance and markets news](https://df.media)
## Frequently Asked Questions
### Why are oil prices today lower after OPEC+ raised output?
Oil prices today slipped because the OPEC+ increase is seen as largely symbolic for now. The Strait of Hormuz conflict already capped output from major Gulf producers, so the extra 188,000 bpd target has limited immediate impact on supply.
### What is the current price of Brent crude and WTI?
Brent crude fell to $71.78 a barrel and U.S. WTI slipped to $68.49 a barrel in early Monday trading, both down slightly from Friday’s close.
### How much did OPEC+ raise oil output by?
OPEC+ agreed to raise output by 188,000 barrels per day starting in August, extending similar increases already made in June and July.
### Are Gulf oil exports back to pre-war levels?
No. Gulf exports rose more than 3 million barrels per day in June to top 10 million bpd, but that volume remains 40% below pre-war levels.
**Categories:** Banking
---
### [European Stocks Gain Fresh Momentum, But Wall Street's AI Dominance Keeps Investors Loyal](https://df.media/european-stocks-gain-fresh-momentum-but-wall-streets-ai-dominance-keeps-investors-loyal/)
**Published:** July 1, 2026
**Author:** Vishnu Priya
**Content:**
European stock markets are showing renewed strength after months of weak investor sentiment. Falling oil prices and easing geopolitical tensions have improved the economic outlook across the region. Yet despite Europe’s recovery, investors continue to favor Wall Street, where artificial intelligence is delivering stronger corporate earnings and higher long term growth.
Following the ceasefire involving Iran, crude oil prices have fallen back to around **$70 per barrel**, easing fears of supply disruptions through the Strait of Hormuz. For Europe’s energy dependent economy, cheaper oil is providing a meaningful boost.
## Lower Oil Prices Give Europe a Competitive Advantage
Lower energy costs are helping reduce inflation across Europe while improving household spending and corporate profit margins.
The STOXX 600 Index has climbed to record highs as investors return to sectors that benefit most from lower input costs. Industrials, chemicals, travel, luxury goods and banking stocks are among the strongest performers.
Europe also remains significantly cheaper than U.S. equities. Market data shows the STOXX 600 trades at approximately a **26% valuation discount** compared with the S&P 500, making European stocks attractive for investors seeking value opportunities.
## ETF Flows Show Improving Confidence
Investor confidence is slowly returning.
European exchange traded funds attracted approximately **$1.5 billion** during the latest reporting week after suffering ten straight weeks of outflows.
However, the recovery remains modest compared with the United States, where ETFs received nearly **$56 billion** in fresh investment during the same period.
This suggests investors are becoming more optimistic about Europe without reducing their exposure to Wall Street.
## Artificial Intelligence Continues to Drive U.S. Markets
The biggest difference remains earnings growth.
Analysts expect companies in the S&P 500 to increase earnings by **24.5% during 2026**, compared with **14.3%** for companies in the STOXX 600.
Artificial intelligence continues to power investment across cloud computing, semiconductor manufacturing, enterprise software and digital infrastructure, supporting stronger revenue growth for U.S. corporations.
For global investors, these growth prospects continue to outweigh Europe’s attractive valuations.
## Structural Challenges Remain for Europe
Although lower oil prices have improved the near term outlook, Europe still faces several economic challenges.
Growth remains relatively weak across many countries, consumer demand is recovering slowly, Chinese competition continues to pressure manufacturers and government investment programs have yet to generate widespread economic momentum.
Investment managers say they want stronger evidence that infrastructure and defense spending are translating into real business activity before making larger allocations to European markets.
## Short Term Opportunity or Long Term Shift?
Several global investment banks have upgraded their outlook for European equities in recent weeks.
Nevertheless, many market strategists believe the current rebound is more likely to represent a tactical investment opportunity than a permanent shift away from U.S. markets.
Unless European earnings accelerate significantly, Wall Street is expected to remain the world’s preferred destination for equity investors thanks to continued AI leadership.
Europe’s investment outlook has clearly improved. Falling energy prices, lower inflation and attractive valuations are bringing investors back after months of cautious positioning.
However, Wall Street continues to benefit from powerful AI driven earnings growth and stronger economic momentum. While Europe may offer compelling value, the United States still offers superior growth potential, making a balanced global investment approach the preferred strategy for many institutional investors.
---
# Frequently Asked Questions
### Why are European stocks rising in 2026?
European stocks are benefiting from lower oil prices, easing inflation, improved corporate margins and stronger investor confidence following reduced geopolitical tensions.
### Why do investors still prefer Wall Street?
Wall Street continues to deliver stronger earnings growth driven by artificial intelligence, cloud computing, semiconductor demand and digital transformation.
### Which European sectors benefit the most from lower oil prices?
Industrials, banks, travel companies, luxury brands and chemical manufacturers are expected to benefit the most.
### Are European stocks undervalued?
Yes. The STOXX 600 currently trades at roughly a 26% discount to the S&P 500, making European equities attractive for value investors.
### Is this the start of a major shift from U.S. to European markets?
Most analysts believe it is currently a short term tactical opportunity rather than a lasting rotation away from Wall Street.
**Categories:** Banking
---
### [Strait of Hormuz Shipping Begins Recovering as Security Risks Continue to Challenge Global Trade](https://df.media/strait-of-hormuz-shipping-recovery-faces-new-risks/)
**Published:** June 29, 2026
**Author:** Vishnu Priya
**Content:**
Commercial shipping through the Strait of Hormuz is gradually returning after months of disruption, offering cautious optimism for global energy markets. However, recent attacks on merchant vessels demonstrate that one of the world’s most important maritime trade routes remains vulnerable to geopolitical tensions, leaving shipowners, insurers, oil producers, and investors closely monitoring every development.
According to Bloomberg, vessel tracking data over the weekend showed several commercial ships successfully passing through the narrow waterway despite heightened security concerns. Although overall traffic remains below historical averages, shipping activity has improved compared with the peak of the recent conflict involving the United States and Iran.
For global markets, the Strait of Hormuz represents far more than a regional shipping lane. The passage serves as the primary gateway for crude oil and liquefied natural gas exports from several Gulf nations, making its stability essential for international energy security.
---
## Why the Strait of Hormuz Matters
Stretching between Oman and Iran, the Strait of Hormuz is considered the world’s most strategically significant energy chokepoint.
According to the U.S. Energy Information Administration (EIA), approximately one-fifth of the world’s petroleum consumption typically moves through this narrow passage each day. Countries including Saudi Arabia, the United Arab Emirates, Kuwait, Iraq, Qatar, and Iran rely heavily on the route to transport crude oil and natural gas to international customers across Asia, Europe, and beyond.
Any disruption within the strait has immediate consequences for:
- Global oil prices
- Shipping costs
- Marine insurance premiums
- Energy supply chains
- Inflation in importing countries
Because global energy markets remain interconnected, even temporary interruptions can create uncertainty that affects businesses and consumers worldwide.
U.S. Energy Information Administration (EIA)
<https://www.eia.gov/international>
---
## Shipping Activity Shows Signs of Improvement
Recent vessel movements indicate that commercial operators are slowly regaining confidence.
Bloomberg reported that several vessels successfully completed transits over the weekend, including empty very large crude carriers entering the Persian Gulf and fully loaded tankers departing toward international destinations.
This represents a noticeable improvement compared with earlier months when commercial traffic nearly came to a standstill during military hostilities.
Industry analysts note that the arrival of empty crude carriers is particularly important because regional producers need available vessels before export volumes can fully recover.
Without sufficient shipping capacity, restarting oil production becomes significantly more difficult, regardless of available supply.
---
## Recent Attacks Highlight Continuing Security Risks
Despite encouraging signs of recovery, the security environment remains fragile.
Last week, a Singapore-flagged container vessel reportedly came under attack while operating in the region. Days later, another commercial tanker carrying Qatari crude oil was also targeted while transiting the Strait of Hormuz.
The incidents prompted the Joint Maritime Information Center to increase its regional maritime threat assessment, warning commercial shipping operators to exercise heightened caution.
The attacks were followed by renewed military exchanges between the United States and Iran before both governments announced a temporary halt in offensive operations ahead of further diplomatic discussions.
While the ceasefire has reduced immediate tensions, shipping companies continue to prepare for rapidly changing conditions.
---
## Shipowners Continue Taking Different Approaches
Not every shipping company is prepared to resume normal operations.
Some operators have restarted voyages through the Strait of Hormuz, believing security conditions have improved sufficiently for commercial navigation.
Others remain cautious.
Several companies continue delaying departures, modifying schedules, or rerouting vessels while they evaluate intelligence reports and updated maritime security guidance.
Marine insurers have also responded by reassessing risk exposure, with war-risk premiums remaining elevated for vessels operating within the region.
Higher insurance costs ultimately increase transportation expenses for exporters and importers alike.
---
## Energy Markets Are Watching Every Movement
Oil traders have been closely monitoring vessel tracking data since the partial reopening of the Strait of Hormuz.
Shipping activity often provides one of the earliest indicators of changing supply conditions.
An increase in inbound empty tankers typically signals that producers expect exports to recover, while declining outbound shipments may indicate operational challenges or renewed geopolitical risks.
Energy analysts therefore pay close attention not only to oil production figures but also to daily vessel movements through the strait.
These indicators influence expectations for future supply, pricing, and global inventory levels.
---
## Diplomacy Will Shape the Next Phase
The recent improvement in shipping traffic follows diplomatic efforts aimed at reducing military tensions between Washington and Tehran.
Although the current situation remains uncertain, investors hope ongoing negotiations will prevent further escalation and allow commercial shipping to normalize.
Markets generally respond positively to signs of stability because uninterrupted maritime trade helps reduce supply-chain uncertainty and supports predictable energy pricing.
However, analysts caution that isolated security incidents could still undermine confidence if tensions increase again.
## Don’t Miss the Stories Moving Global Markets
From geopolitical conflicts and oil prices to stock markets, central banks, AI, and the global economy, Daily Finance delivers trusted news and in-depth analysis to help you stay informed.
[ Explore More Financial News on Daily Finance ](https://df.media/)
## Frequently Asked Questions
### Why is the Strait of Hormuz important?
The Strait of Hormuz is one of the world’s busiest maritime routes for oil and liquefied natural gas exports. It connects the Persian Gulf to the Gulf of Oman and the Arabian Sea, allowing energy supplies from major Gulf producers to reach global markets.
### How do security incidents affect global oil prices?
Security threats in the Strait of Hormuz can increase uncertainty in energy markets. Even temporary disruptions may lead to higher shipping costs, increased insurance premiums, and fluctuations in crude oil prices depending on market expectations.
### Are commercial ships still using the Strait of Hormuz?
Yes. Commercial vessels continue to transit the waterway, although shipping companies regularly assess security conditions before scheduling voyages. Traffic levels can change depending on geopolitical developments and maritime safety advisories.
### What role does maritime insurance play during regional conflicts?
Marine insurers evaluate geopolitical risks when setting insurance premiums for vessels operating in high-risk regions. Elevated risks can increase operating costs for shipping companies and influence global trade expenses.
### Could prolonged disruptions impact global supply chains?
Extended disruptions could slow energy exports, increase transportation costs, and affect industries that depend on reliable fuel supplies. Global supply chains are generally more resilient today, but major interruptions would still have significant economic consequences.
**Categories:** Banking
---
### [Markets Today June 25, 2026: Chip Stocks Surge, Oil Hits Pre-War Lows and Fed Rate Debate Erupts](https://df.media/markets-today-june-25-chip-stocks-oil-crash-fed-rate-debate/)
**Published:** June 25, 2026
**Author:** Laura Anderson
**Content:**
**Markets today June 25, 2026** opened with a powerful reversal as Nasdaq surged on blowout Micron earnings, global chip stocks reignited the AI rally, oil plunged to levels last seen before the Iran conflict began, and a fierce debate erupted across Wall Street over whether the Federal Reserve will hike rates — or never deliver on the hikes bond markets are already pricing in.
From semiconductor euphoria to OPEC fracture risks, from the dollar’s 13-month high to Bitcoin’s $10 billion options test, markets today June 25 delivered a day of sharp divergences that investors will be watching closely heading into the second half of 2026.
## Micron Beats Estimates, Chip Stocks Reignite the AI Rally
The headline mover on markets today June 25 was **Micron Technology (MU)**, whose quarterly earnings decisively beat Wall Street estimates and eased growing fears that AI infrastructure spending was running out of momentum. The results sent Micron shares surging in pre-market trading and ignited a broader rally across the global semiconductor sector.
South Korean chip giants including Samsung and SK Hynix surged sharply in Asian trading, while European and US chip names followed suit. Qualcomm (QCOM) also rallied, erasing part of its recent decline. The Nasdaq Composite, which had fallen 2.21% just yesterday on AI capex fears, rebounded decisively as investors rotated back into technology growth names.
The Micron beat is particularly significant because it validates that data center demand for high-bandwidth memory (HBM) chips — critical for AI model training and inference — remains robust, countering the narrative of a near-term pullback in AI investment.
## Oil Crashes to Pre-Iran War Lows — Iraq Threatens OPEC Exit
In the energy complex, crude oil prices fell sharply on markets today June 25, dropping to levels not seen since before the Iran conflict that had previously sent oil surging. The decline reflects a combination of ongoing diplomatic progress on the US-Iran front and a broader reassessment of global demand forecasts.
Adding to the volatility, **Iraq warned it may quit OPEC** if the cartel refuses to increase its production quota. Iraq, one of OPEC’s largest producers, has long chafed under output restrictions that it argues unfairly limit its ability to capitalize on its vast reserves. An Iraqi exit would be a seismic shift in global oil governance and could further weaken OPEC’s ability to manage supply.
According to [the IEA’s latest oil market outlook](https://www.iea.org/topics/oil-market), global oil demand growth is moderating as electric vehicle adoption accelerates and energy efficiency improves across major economies, adding downward structural pressure on prices beyond the near-term diplomatic developments.
## Fed Rate Debate: Wall Street Divided Between Hikes and Cuts
The biggest macro story beneath the surface on markets today June 25 is a deep and widening schism on Wall Street over where the Federal Reserve goes next. US rate futures are pricing in **at least one Fed rate hike by early autumn 2026** and another in 2027 — an aggressively hawkish posture that a growing number of asset managers believe is simply wrong.
“The market is way too aggressive in pricing rate hikes, mistaking that oil inflation pushing through food prices and everything else will persist,” said Byron Anderson, head of fixed income at Laffer Tengler Investments, in a Reuters report published today. Anderson argues that recent inflation pressures are energy-driven and will reverse as oil supply normalizes.
The divergence across major banks is striking. **Citi expects the Fed’s next move to be a cut** — projecting a 25-basis-point reduction as soon as October. **BofA Securities, by contrast, forecasts three 25-basis-point rate hikes** this year. The gap between these two projections is historically unusual and signals deep uncertainty about the inflation trajectory.
A key structural factor: Fed Chair Kevin Warsh has moved away from explicit forward guidance, a shift that BNP Paribas head of US rates strategy Guneet Dhingra says gives markets a “free hand” to price policy — but at the cost of higher risk premiums, greater tail risk, and elevated volatility around each Fed decision.
According to [Reuters](https://www.reuters.com/business/finance/us-bond-market-expects-rate-hikes-fed-may-never-deliver-2026-06-25/), J.P. Morgan’s latest Treasury Client Survey shows neutral positioning in Treasuries rising to 56% among active clients — the highest since late March — underscoring broad uncertainty and a wait-and-see stance from institutional investors.
## Dollar Climbs to 13-Month Highs as Rate Expectations Bite
The US dollar index skimmed **13-month highs** on markets today June 25, driven by the same hawkish rate expectations that are dividing bond investors. With rate futures pricing in Fed hikes, the dollar has benefited from the resulting yield differential against major peers including the euro, yen, and pound.
The yen remains particularly under pressure as the Bank of Japan maintains its ultra-accommodative stance while US short-end yields stay elevated. Dollar-yen has remained near multi-decade highs, keeping Japan’s Ministry of Finance on verbal intervention watch.
A stronger dollar creates headwinds for US multinationals — companies that generate significant revenues overseas see those earnings diminished when translated back into dollars. This is a key risk for the S&P 500’s earnings season in Q3 2026.
## Bitcoin Faces Pressure Ahead of $10B Options Expiry
In crypto markets, **Bitcoin (BTC-USD) fell 1.18%** on markets today June 25, with analysts citing a massive **$10 billion options expiry** creating near-term selling pressure. Large options expiries can create volatility as market makers adjust their hedges, and this expiry is one of the largest of 2026.
Despite near-term pressure, the medium-term outlook for Bitcoin remains underpinned by ongoing institutional adoption, the continued impact of the 2024 halving on supply dynamics, and growing interest from sovereign wealth funds in digital asset allocation.
## Alphabet Joins the Dow — Gold Cools as China Banks Act
In a historic index development, **Alphabet (GOOG/GOOGL) joined the Dow Jones Industrial Average**, a move that analysts say makes the Dow look more like the Nasdaq by adding another mega-cap tech name to the traditional blue-chip index. Alphabet shares edged down 0.30% on the day despite the index inclusion news.
Meanwhile, **gold (GC=F) edged down 0.19%** as major Chinese banks moved to rein in retail gold trading — a significant policy signal from Beijing, which has seen an explosion in retail gold demand over the past 18 months. The curbs could reduce one of the most powerful demand drivers that had been pushing gold to record highs in early 2026.
## Markets Today June 25: Full Scorecard
| Asset / Index | Move | Key Driver |
|---|---|---|
| Nasdaq Composite | ↑ Surging | Micron earnings beat, chip rally |
| Dow Jones | Mixed | Alphabet joins index |
| Micron (MU) | ↑ Strong | Earnings beat, HBM demand |
| Qualcomm (QCOM) | ↑ +recovery | Chip sector momentum |
| Crude Oil (CL=F) | ↓ -1.11% | Pre-Iran war lows, Iraq/OPEC tensions |
| Gold (GC=F) | ↓ -0.19% | China bank curbs on retail gold |
| US Dollar Index | ↑ 13-month high | Hawkish rate expectations |
| Bitcoin (BTC-USD) | ↓ -1.18% | $10B options expiry pressure |
| Alphabet (GOOG) | ↓ -0.30% | Joins Dow Jones |
## Markets Today June 25: What the Data Tells Us About the Rest of 2026
Markets today June 25, 2026 tell a story of powerful cross-currents. The Micron-driven chip rally shows that AI investment demand is alive — but yesterday’s selloff showed how quickly sentiment can shift on capex news. Oil’s slide to pre-war levels removes a key inflation pressure, which could ultimately give the Fed room to hold or even cut, vindicating the more dovish Wall Street forecasters.
The Fed rate debate is the defining macro question of the second half of 2026. If inflation eases as oil normalizes and the labor market softens — as State Street’s Lori Heinel expects — then bond markets pricing in rate hikes are in for a sharp repricing. If Warsh’s Fed delivers on hawkish signals, risk assets including growth stocks and crypto face renewed headwinds.
Markets today June 25 signal one clear theme: **volatility is not going away**. The withdrawal of Fed forward guidance, the OPEC fracture risk, and the AI investment debate all point to a second half of 2026 where data dependency — and market surprises — will define returns.
## Related Coverage
- [Markets Today June 24: Nasdaq Falls 2.21%, AI Stocks Crash, Micron Earnings and Fed Stress Tests](https://df.media/markets-today-june-24-nasdaq-ai-selloff-micron/)
- [US Iran Talks Oil Prices Crash: 7 Powerful Market Shifts Investors Must Watch](https://df.media/us-iran-talks-oil-prices-crash/)
- [Markets Today June 19: Key Market Moves and What They Mean](https://df.media/markets-today-june-19/)
## Frequently Asked Questions
### Why did chip stocks rally on markets today June 25?
Chip stocks surged on markets today June 25 after Micron Technology reported quarterly earnings that beat Wall Street estimates, easing fears about a slowdown in AI infrastructure spending. Micron’s strong results confirmed robust demand for high-bandwidth memory chips used in AI data centers, triggering a global rally across the semiconductor sector.
### Why is oil falling to pre-Iran war lows?
Oil is falling on June 25, 2026 due to ongoing diplomatic progress in US-Iran talks reducing the geopolitical risk premium that had elevated prices, combined with moderating global demand growth forecasts and Iraq’s threat to exit OPEC if its quota isn’t increased — which could signal fractures in cartel supply discipline.
### What is the Fed rate debate about in June 2026?
The Fed rate debate in June 2026 centers on whether the Federal Reserve will actually deliver the rate hikes that bond futures markets are pricing in. Citi expects the next Fed move to be a cut in October, while BofA forecasts three hikes this year. Fed Chair Kevin Warsh’s removal of explicit forward guidance has increased market uncertainty and rate volatility.
### Why is the US dollar at 13-month highs?
The US dollar is at 13-month highs on June 25, 2026 because US rate futures are pricing in Fed rate hikes, boosting yields on short-dated US Treasuries and making the dollar more attractive versus other major currencies. The hawkish rate expectations stem from above-target inflation readings and the Fed’s shift away from explicit forward guidance under Chair Kevin Warsh.
### What is the Bitcoin options expiry on June 25, 2026?
A $10 billion Bitcoin options expiry is taking place around June 25, 2026, creating short-term selling pressure on BTC-USD. Large options expiries can lead to volatility as market makers hedge their positions. This expiry is among the largest of 2026 and is a key factor in Bitcoin’s 1.18% decline on the day.
**Stay ahead of the market.** [Visit Daily Finance](https://df.media/) for real-time financial news, market analysis, and investment insights updated every trading day.
**Categories:** Capital Markets, Finance, Investing
**Tags:** AI rally, Bitcoin options expiry, chip stocks, dollar 13-month high, Fed rate hike, Iraq OPEC, markets today June 25, Micron earnings, Nasdaq surge, oil price crash
---
### [Markets Today June 24 2026: Nasdaq Falls 2.2%, AI Stocks Crash, Micron Earnings and Fed Stress Tests in Focus](https://df.media/markets-today-june-24-nasdaq-ai-selloff-micron/)
**Published:** June 24, 2026
**Author:** Vishnu Priya
**Excerpt:** Markets today June 24 2026: Nasdaq falls 2.21%, AI stocks crash on $452B capex fears, gold two-week low at $4,067, dollar index 2026 high above 101. Micron earnings and Fed stress tests today.
**Content:**
**Markets today June 24, 2026** saw the Nasdaq Composite fall 2.21% to 25,587 and the S&P 500 drop 1.44% to 7,365 as a deepening AI stock selloff rattled Wall Street for a second consecutive session. Gold hit a two-week low at $4,067 per ounce, the US Dollar Index climbed to a new 2026 high above 101, and all eyes are on two major events: **Micron Technology earnings** after the close and **Federal Reserve bank stress test results** at 4:00 p.m. ET.
## AI Selloff Deepens as Alphabet and Amazon Lead Tech Declines
Markets today June 24, 2026: AI stocks lead broad selloff as Nasdaq falls 2.21% and gold hits two-week low.The technology selloff accelerated on June 24 as Wall Street shifted from rewarding AI spending to demanding proof of returns. Combined 2026 capital expenditure across Microsoft, Alphabet, Amazon, and Meta has now exceeded **$452 billion**, a figure that is increasingly alarming institutional investors.
**Alphabet (GOOGL)** fell between 6% and 10% over two sessions after a high-profile AI talent exodus. John Jumper, a Nobel Prize-winning researcher and Google DeepMind lead, announced he is leaving for Anthropic. Noam Shazeer, co-lead of the Gemini AI model, departed for OpenAI. Alphabet’s Q1 2026 free cash flow fell 47% year over year to $10.12 billion. **Amazon (AMZN)** dropped 4% as its trailing twelve-month free cash flow collapsed 95% to $1.2 billion due to AI infrastructure costs. According to [CNBC](https://www.cnbc.com/2026/06/24/gold-slips-to-two-week-low-as-fed-rate-hike-bets-buoy-dollar.html), Nvidia and other semiconductor names also declined as the broader AI trade unwound.
## Micron Earnings June 24: The Biggest Test for Chip Stocks
**Micron Technology (MU)** reports Q3 fiscal 2026 earnings after the close on June 24. After tumbling 13% on Tuesday, Micron shares rebounded 4.1% in premarket trading as investors positioned ahead of the report. Analysts expect earnings of approximately **$19.72 to $20.57 per share** on revenue of **$34.5 to $35.75 billion**, representing year over year EPS growth of **932%** and revenue growth of **271%**. Micron guided fiscal Q3 to record revenue of $33.5 billion, gross margin of approximately 81%, and non-GAAP diluted EPS of $19.15. The company’s High Bandwidth Memory (HBM) capacity is sold out through the end of 2026, driven by demand from AI accelerator manufacturers including Nvidia.
## Gold Price Today June 24: Falls to Two-Week Low as Dollar Surges
Spot gold fell 1% to **$4,067.51 per ounce** on June 24, its lowest level in nearly two weeks. Rising Federal Reserve rate hike expectations are strengthening the US dollar and reducing the appeal of gold, which pays no yield. The **US Dollar Index rose to 101.65**, a new 2026 high, as markets price an 87% probability of a Fed rate hike by December 2026. Goldman Sachs recently cut its year-end gold price target from $5,400 to $4,900, citing the hawkish Fed pivot. According to the [International Energy Agency](https://www.iea.org), falling crude oil prices may ease inflationary pressure and create room for a softer Fed stance later in the year.
## Oil Prices June 24: Brent Crude Falls Below $72
Brent crude oil fell 1.76% to **$71.92 per barrel** on June 24, extending its sharp decline from recent highs above $82. The US-Iran diplomatic breakthrough last week reopened Strait of Hormuz shipments and returned additional supply to global markets. Lower energy costs are providing relief for consumers and businesses but weighing heavily on energy sector stocks. Oil is now down more than 12% from its June highs, representing one of the fastest crude price corrections of 2026.
## Fed Stress Test 2026: Results for 32 Banks Released Today
The Federal Reserve releases its 2026 annual bank stress test results at **4:00 p.m. ET on June 24**, evaluating 32 major US lenders including JPMorgan Chase, Goldman Sachs, and Bank of America. The stress scenario models unemployment rising to 10%, home prices falling 30%, and commercial real estate dropping 39%. The Fed confirmed results will not affect capital requirements until 2027 while it reviews its stress-testing methodology. According to the [International Monetary Fund](https://www.imf.org/en/Topics/global-financial-stability), US bank resilience is a critical pillar of global financial stability, making today’s results closely watched by international investors and central banks worldwide.
## Dollar Index Hits 2026 High: Japanese Yen Faces Intervention Risk
The US Dollar Index crossing 101 for the first time in 2026 creates significant pressure across global markets. A stronger dollar weighs on commodities, emerging market currencies, and countries with dollar-denominated debt. The Japanese yen sits near 161 per dollar, its weakest level since the 1980s, with Japanese authorities repeatedly warning of potential intervention if yen weakness becomes disorderly. A move toward 163 to 165 could force the Bank of Japan to act within weeks.
## Markets Today June 24: Full Scorecard
| Asset | Level | Change |
|---|---|---|
| S&P 500 | 7,365.46 | Down 1.44% |
| Nasdaq Composite | 25,587.04 | Down 2.21% |
| Dow Jones | 51,666.84 | Down 0.09% |
| Micron (MU) | Premarket plus 4.1% | After minus 13% Tuesday |
| Alphabet (GOOGL) | Down 6% to 10% | AI capex plus talent exodus |
| Gold (Spot) | $4,067.51 per ounce | Down 1.0% |
| Brent Crude | $71.92 per barrel | Down 1.76% |
| US Dollar Index | 101.65 | Plus 0.24% (2026 high) |
| USD/JPY | 161 | Yen at 1980s low |
## What to Watch the Rest of June 24, 2026
Investors tracking markets today June 24 should focus on four key catalysts before the session ends. First, Micron Technology earnings after the close will set the tone for chip stocks and the broader AI hardware trade. Second, Federal Reserve stress test results at 4:00 p.m. ET will reveal how prepared major US banks are for a severe recession scenario. Third, May new home sales data will signal whether elevated mortgage rates are cooling housing demand. Fourth, the US Dollar Index holding above 101 could trigger further yen weakness and commodity selling.
## Related Markets Coverage
For more context on the broader market trends shaping June 2026, read our coverage of [Markets Today June 19: Nikkei Record High and Brent Crude at $79](https://df.media/markets-today-june-19-nikkei-record-brent-oil-gold-dollar/), the [US Iran Talks Oil Prices Crash: 7 Market Shifts](https://df.media/us-iran-talks-oil-prices-crash/), and our analysis of [how the US-Iran Peace Deal changed global markets in one morning](https://df.media/everything-is-surging-how-the-us-iran-peace-deal-just-changed-oil-gold-stocks-and-interest-rates-in-one-morning/).
## Frequently Asked Questions: Markets Today June 24
### What happened in markets today June 24, 2026?
Markets today June 24, 2026 saw the Nasdaq fall 2.21% to 25,587 and the S&P 500 drop 1.44% to 7,365 as the AI stock selloff deepened. Gold fell to a two-week low at $4,067 per ounce, the Dollar Index hit a new 2026 high above 101, and Brent crude fell to $71.92. The market is awaiting Micron earnings and Federal Reserve stress test results.
### Why are AI stocks falling on June 24, 2026?
AI stocks are falling because investors question whether the over $452 billion in combined 2026 hyperscaler AI capital expenditure will generate sufficient returns. Alphabet lost key AI researchers to Anthropic and OpenAI, and free cash flow at major tech companies has declined sharply due to infrastructure spending. Wall Street is demanding proof of AI monetization before rewarding further spending.
### What are analysts expecting from Micron earnings on June 24, 2026?
Analysts expect Micron to report Q3 fiscal 2026 earnings of approximately $19.72 to $20.57 per share on revenue of $34.5 to $35.75 billion, representing 932% year over year EPS growth. The critical metric is High Bandwidth Memory guidance, as Micron’s HBM capacity is fully sold out through the end of 2026 due to AI chip demand.
### Why is gold falling on June 24, 2026?
Gold fell to $4,067 per ounce on June 24 because markets now price an 87% probability of a Federal Reserve rate hike by December 2026, strengthening the US dollar. The Dollar Index reached a new 2026 high above 101, making yield-free gold less attractive compared to dollar-denominated assets.
### What are the Federal Reserve bank stress test results for 2026?
The Federal Reserve released its 2026 bank stress test results on June 24 at 4:00 p.m. ET, covering 32 major US banks including JPMorgan Chase, Goldman Sachs, and Bank of America. The scenario modeled unemployment rising to 10%, home prices falling 30%, and commercial real estate dropping 39%. Results will not affect capital requirements until 2027.
## Markets Today June 24: What the Data Tells Us About the Rest of 2026
Markets today June 24, 2026 are sending three clear signals investors cannot ignore. First, the AI trade is maturing. The era of rewarding hyperscaler spending without evidence of returns is over. Wall Street now demands monetization — and until Alphabet, Amazon, and Microsoft can demonstrate that $452 billion in AI infrastructure spending translates into free cash flow growth, the risk premium on AI stocks will remain elevated.
Second, the Federal Reserve is firmly in control of the macro narrative. With an 87% probability of a December rate hike already priced in, and the Dollar Index at 2026 highs, the era of easy financial conditions that fuelled the AI rally is fading. Gold at $4,067 and Brent crude at $71.92 are both responding to this tightening signal.
Third, Micron Technology’s earnings tonight are a genuine inflection point. A beat-and-raise on HBM guidance could restore confidence in the semiconductor trade and arrest the two-day AI selloff. A miss or cautious guidance could extend the correction through the end of June and into July. The outcome of Micron’s earnings may well define the direction of markets today and for the weeks ahead.
Investors tracking markets today June 24 should resist overreacting to single-session moves. The underlying structural drivers — AI demand for HBM chips, the US-Iran diplomatic thaw lowering oil prices, and a resilient US banking system — remain intact. Volatility is creating entry points for disciplined investors, even as short-term sentiment turns cautious.
---
**Stay ahead of global markets every day.**
Breaking financial news, real-time data and expert analysis — all on **[Daily Finance](https://df.media/)**.
**Categories:** Capital Markets, Finance, Investing
**Tags:** AI selloff, AI stocks, Alphabet GOOGL, dollar index, Fed stress test 2026, gold price today, markets today June 24, Micron earnings, Nasdaq selloff, stock market today
---
### [US Iran Talks Oil Prices Crash: 7 Powerful Market Shifts Investors Must Watch](https://df.media/us-iran-talks-oil-prices-crash/)
**Published:** June 22, 2026
**Author:** Laura Anderson
**Excerpt:** US Iran talks oil prices plunge after a major diplomatic breakthrough. Discover how oil, currencies, stocks, and global markets reacted.
**Content:**
The latest **US Iran talks oil prices** development has become one of the most important financial stories of 2026. Global markets reacted sharply on Monday, June 22, after the United States and Iran concluded high-level negotiations in Switzerland — offering the strongest signal yet that a broader agreement could be reached between the two nations.
The announcement immediately shifted investor sentiment across commodities, currencies, and equity markets. Brent crude, which had surged above $82 per barrel during early trading amid fears of escalating conflict, reversed course and dropped nearly 2% to around $79 per barrel. The move reflected growing confidence that additional oil supplies could soon return to global markets.
## US Iran Talks Oil Prices Trigger Global Market Reversal
The significance of the latest **US Iran talks oil prices** breakthrough extends far beyond energy markets. Currency traders reassessed geopolitical risks, bond markets adjusted interest-rate expectations, and investors around the world began evaluating what a successful diplomatic outcome could mean for the global economy.
At the same time, Strait of Hormuz shipping activity normalized, Iranian export expectations rose, and policymakers in Asia, Europe, and North America began recalibrating inflation forecasts. The ripple effects of a single day of diplomacy in Switzerland are being felt in every major financial center.
## Why Oil Prices Suddenly Fell
Oil prices had been heavily supported by fears that tensions in the Middle East could disrupt global supply chains. For months, traders worried that conflict involving Iran, Israel, and regional allies could significantly impact exports passing through key shipping routes.
The conclusion of talks in Switzerland changed that outlook. According to officials involved in the negotiations, both sides agreed to continue technical discussions and work toward a broader agreement within the next 60 days. The market immediately interpreted this as reducing the likelihood of a prolonged supply disruption.
Several factors pushed oil prices lower following the announcement:
- Diplomatic progress toward a binding framework agreement
- Expectations of increased Iranian crude exports within weeks
- Reduced fears of long-term Strait of Hormuz disruption
- Potential easing of US sanctions on Iranian petroleum
- Additional production commitments from Gulf producers
As a result, traders rapidly removed part of the geopolitical risk premium that had been built into oil prices over recent months — sending Brent crude to its lowest level since early 2026.
## Iran Secures Key Export Waivers
One of the biggest surprises from the negotiations was Iran’s announcement that it had secured waivers for oil and petrochemical exports. Iranian officials also indicated that some frozen assets would be released and that reconstruction and development plans were under discussion.
These developments could significantly increase the amount of crude oil available to global markets. Energy analysts estimate that millions of additional barrels per day could eventually reach international buyers if negotiations continue on their current trajectory.
This prospect is particularly important because major producers such as Iraq, Kuwait, and the United Arab Emirates have also signaled plans to increase output. A combination of Iranian supply recovery and Gulf producer expansion could put sustained downward pressure on crude prices well into 2027.
For investors monitoring **US Iran talks oil prices**, the possibility of additional supply remains the single most important variable affecting market forecasts for the second half of 2026.
## Strait of Hormuz Risks Still Loom
Despite the positive developments, markets remain cautious. The Strait of Hormuz continues to represent one of the world’s most critical energy chokepoints. Approximately 20% of global oil shipments pass through the narrow waterway every single day — making it irreplaceable for global energy security.
Iran’s announcement that it had briefly closed the strait before negotiations began created immediate concern among traders. Although commercial shipping continued and diplomats established communication channels aimed at ensuring safe passage, the underlying risk has not disappeared.
Any future disruption — triggered by a breakdown in talks, a regional military incident, or a domestic political shift in Tehran — could rapidly reverse recent declines in oil prices. Shipping companies, insurers, energy producers, and governments worldwide continue monitoring vessel movements closely.
The future stability of the Strait of Hormuz may ultimately determine whether the current optimism surrounding **US Iran talks oil prices** can be sustained beyond the immediate diplomatic window.
## Dollar Holds Steady Amid Uncertainty
While oil markets experienced significant volatility, the U.S. dollar remained relatively stable. Currency traders faced two competing forces simultaneously.
On one hand, lower oil prices can help reduce inflationary pressure, which could eventually influence Federal Reserve policy decisions. On the other hand, uncertainty surrounding the negotiations remains high. Investors are fully aware that diplomatic progress can unravel rapidly if political tensions return.
As a result, the dollar index — which had surged to a 13-month high of 100.78 last week — traded within a relatively narrow range on Monday despite major headlines from Switzerland. Market strategists believe that future developments related to **US Iran talks oil prices** could become one of the primary drivers of foreign exchange markets throughout the summer of 2026.
## Japanese Yen Near Historic Lows
Outside the Middle East story, one of the biggest developments in global currency markets remains the weakness of the Japanese yen. The yen traded near 161 per dollar — levels not seen since the 1980s — raising concerns about potential intervention from Japanese monetary authorities.
Japanese officials have repeatedly warned that they are prepared to intervene if currency movements become disorderly. However, investors continue selling the yen due to significant and persistent differences between U.S. and Japanese interest rates.
Higher Treasury yields and expectations of additional Federal Reserve tightening have made dollar-denominated assets increasingly attractive to global investors. Many analysts believe further yen weakness toward 163–165 could trigger direct action from the Bank of Japan or the Ministry of Finance within weeks.
## Political Turmoil Weighs on the Pound
The British pound also faced pressure during Monday’s trading session. Political uncertainty in the United Kingdom has created fresh concerns among international investors evaluating exposure to sterling-denominated assets.
Market participants are evaluating potential leadership changes and their implications for fiscal policy, economic growth, and long-term investor confidence. Although analysts do not expect a prolonged selloff, sterling underperformed many major currencies during early trading.
The pound’s decline highlights how global markets are currently balancing geopolitical developments in the Middle East with domestic political risks in major Western economies — creating a complex environment for currency investors.
## What This Means for Inflation and Interest Rates
One of the most important downstream consequences of falling oil prices is the impact on inflation. Energy costs influence transportation, manufacturing, logistics, food production, and consumer spending across every major economy.
When oil prices decline, inflationary pressures often ease — giving central banks more flexibility in their rate decisions. This could have significant implications for the Federal Reserve, the European Central Bank, and the Bank of England over the coming months.
Federal Reserve officials have been closely monitoring energy prices as they assess future interest-rate decisions. Markets currently price an 87% probability of a Fed rate hike by December 2026 — up from 61% just weeks ago. A sustained decline in crude prices could challenge that hawkish consensus.
If oil remains below $80 per barrel through the summer, inflation forecasts may need to be revised downward. That revision could, in turn, push back Fed rate hike expectations — creating a significant shift in global asset prices across equities, bonds, and currencies.
## What Investors Should Watch Over the Next 60 Days
The next two months could determine whether this diplomatic breakthrough evolves into a lasting agreement — or collapses under the weight of unresolved political differences. Several critical developments deserve close attention from investors:
1. **Progress in US-Iran Negotiations** — Additional technical meetings are expected as both sides work through unresolved issues around nuclear verification, sanctions relief, and export timelines.
2. **Iranian Oil Export Volumes** — Investors will monitor whether Iranian crude exports increase significantly in the weeks following the Switzerland talks.
3. **Strait of Hormuz Shipping Activity** — Daily vessel transit volumes remain a key real-time indicator of regional stability and diplomatic progress.
4. **Regional Military Developments** — Continued fighting in Lebanon or any escalation involving Israeli, US, or Iranian forces could rapidly reverse market optimism.
5. **Federal Reserve Policy Signals** — If oil prices stay low, inflation expectations may shift — potentially altering the Fed’s rate path and market pricing.
6. **OPEC+ Production Decisions** — Any changes to Gulf producer output quotas could amplify or dampen the effect of Iranian supply returning to market.
7. **Global Energy Demand Trends** — Chinese and Indian demand data for Q3 2026 will determine how markets can absorb additional supply without a sharp price correction.
## Final Thoughts
The latest **US Iran talks oil prices** breakthrough has reshaped global market expectations almost overnight. Oil prices fell sharply, investors reduced geopolitical risk premiums, and financial markets began pricing in the possibility of meaningfully increased energy supplies for the second half of 2026.
At the same time, significant uncertainties remain. The Strait of Hormuz remains vulnerable. Regional tensions persist. Negotiations still have a long way to go before a final, verifiable agreement is reached. And the Federal Reserve’s response to changing inflation dynamics adds another layer of uncertainty for investors.
For now, markets are choosing optimism over fear. Whether that optimism proves justified may determine the direction of oil prices, inflation, currencies, and global financial markets for the remainder of 2026. As investors watch every headline from Washington, Tehran, and Geneva, one thing is clear: the outcome of these negotiations will shape the global economy for years to come.
## Frequently Asked Questions
### How did US Iran talks affect oil prices?
US Iran talks caused oil prices to drop nearly 2%, with Brent crude falling from above $82 to around $79 per barrel. The diplomatic breakthrough reduced the geopolitical risk premium traders had built into oil prices, as markets anticipated increased Iranian crude supply returning to global markets.
### Why did oil prices fall after the US Iran negotiations in Switzerland?
Oil prices fell because the US-Iran talks in Switzerland signalled that Iranian crude oil exports could resume or increase significantly. Traders removed the supply-disruption risk premium from prices as fears of a prolonged Strait of Hormuz closure eased following the diplomatic agreement to continue talks within 60 days.
### What is the Strait of Hormuz and why does it matter for oil prices?
The Strait of Hormuz is a narrow waterway between Iran and Oman through which approximately 20% of the world’s daily oil shipments pass. Any closure or disruption of the strait — which Iran can threaten or enact — would immediately reduce global oil supply and cause prices to spike sharply. It is the world’s single most important oil chokepoint.
### How are US Iran talks affecting the US dollar and Federal Reserve policy?
If the US-Iran talks succeed in lowering oil prices sustainably, reduced energy inflation could give the Federal Reserve room to reconsider its rate-hike path. The dollar index is trading at a 13-month high of 100.78. A prolonged drop in oil prices could ease inflationary pressure and shift Fed rate expectations lower, which would in turn weaken the dollar and boost risk assets.
### What should investors watch following the US Iran oil talks?
Investors should monitor: the progress of follow-up US-Iran technical negotiations, actual Iranian export volumes, Strait of Hormuz shipping activity, OPEC+ production decisions, Federal Reserve communications on inflation, and any regional military escalation in Lebanon or the broader Middle East. These seven variables will collectively determine whether oil prices stay below $80 or reverse sharply higher.
---
**Stay ahead of global markets every day.**
Breaking financial news, real-time data and expert analysis — all on **[Daily Finance](https://df.media/)**.
**Categories:** Capital Markets, Finance, Investing
**Tags:** Brent crude, dollar index, Federal Reserve, global markets 2026, Iran nuclear deal, oil price crash, oil prices, OPEC, Strait of Hormuz, US Iran talks
---
### [Markets Today: Nikkei Sets Record, Brent Crude Falls to $79, Gold at $4,163 as Dollar Surges](https://df.media/markets-today-june-19-nikkei-record-brent-oil-gold-dollar/)
**Published:** June 19, 2026
**Author:** Vishnu Priya
**Content:**
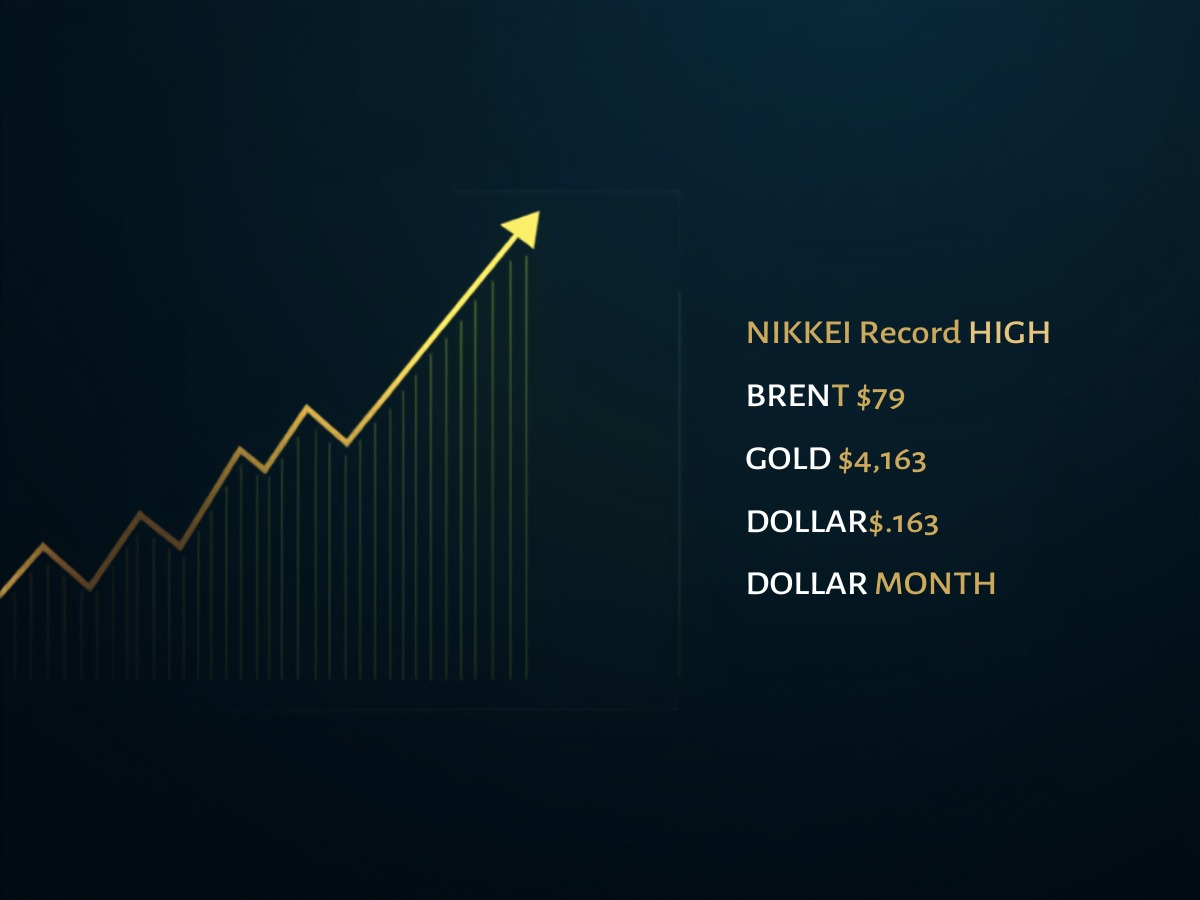**Markets today June 19**, 2026 delivered a remarkable divergence across global asset classes. Stocks surged to record highs across Japan and South Korea as oil tankers resumed transit through the Strait of Hormuz, pushing the **Brent crude price** below $80 for the first time in months. A hawkish pivot from the Federal Reserve drove the **dollar index** to a 13-month high, sent gold to its third consecutive weekly loss, and pushed the yen to its weakest since July 2024. Here is the complete global scorecard for Friday, June 19, 2026. For context on last week’s Iran deal that triggered the initial market surge, see our [Markets Today June 15 analysis](https://df.media/markets-today-iran-peace-deal-oil-crash-stocks-surge-june-15-2026/).
## Stock Markets Today June 19: Nikkei and KOSPI Hit All-Time Records
Japan’s benchmark Nikkei 225 index rose 0.8% on Friday to close at a new all-time high, marking the fifth consecutive record session. The Nikkei gained 8.5% this week alone — its strongest weekly performance in several years. The rally was driven by three converging forces: the collapse in oil prices from the Hormuz reopening, which cuts energy costs for Japanese manufacturers; easing inflation expectations that reduce pressure on the Bank of Japan to tighten policy; and a sharply weaker yen, which inflates the yen-denominated earnings of Japan’s major exporters including Toyota, Sony, and Softbank.
In South Korea, the KOSPI index surged 3.1% on Friday for a stunning 15.3% weekly gain — one of its best single-week performances on record. South Korea’s economy benefits doubly from lower oil: it is the world’s fifth-largest oil importer, and its key exports semiconductors, shipbuilding, and petrochemicals all benefit from lower feedstock costs. Samsung Electronics and SK Hynix both saw strong gains, underpinned by AI-chip demand momentum and relief from tariff uncertainty.
Mainland China, Hong Kong, and Taiwan were closed on Friday for the Dragon Boat Festival public holiday. Markets will reopen Monday. US stock futures edged down 0.2% with cash Treasuries also closed for the Juneteenth federal holiday. The standout equity story from the US overnight session was **Intel Corporation**, whose shares surged 10% to a record high after President Trump confirmed that Apple had agreed to work with Intel to design and manufacture chips domestically in the United States.
## What Is the Oil Price Today?
The **Brent crude price** stands at $79.03 per barrel, down 1.0% on Friday and down a dramatic 9.5% for the week. US West Texas Intermediate crude fell to $76.43 per barrel, with the front-month July contract due to expire on Monday. Both benchmarks are now trading below the $80 psychological level that OPEC+ has historically defended with production cuts.
The collapse in oil prices followed the signing of a US-Iran interim peace deal on Thursday. Within hours of the agreement, oil tankers including three Saudi Aramco supertankers carrying an estimated 6 million barrels of crude began sailing through the Strait of Hormuz the narrow waterway through which roughly 20% of the world’s seaborne oil passes.
According to [Reuters](https://www.reuters.com/business/energy/hormuz-reopening-release-wave-oil-supply-depress-prices-2026-06-18/), analysts estimate that more than 85 million barrels of oil stranded in tankers awaiting safe passage will now flood back into the global market. The lifting of US sanctions on Iranian oil exports is expected to add a further estimated 1.5 million barrels per day to supply. Kuwait Petroleum Corporation lifted all force majeure notices. Iraq’s Oil Minister confirmed oilfields were ready to resume production at pre-disruption rates.
However, the outlook carries risks. US Vice President JD Vance pulled out of planned follow-on talks in Switzerland with Iranian negotiators, raising questions about the deal’s political durability. Israel continued military operations against Hezbollah in Lebanon. Any renewed escalation could quickly re-price the geopolitical premium back into oil.
“Traders are still waiting for hard evidence that tanker traffic through the Strait of Hormuz is actually normalising before committing to the next leg lower,” said Tim Waterer, chief market analyst at KCM Trade. “Future governance of the Strait will be led by Iran and Oman, creating scope for Iran to impose a maritime service fee — a potential hidden cost the market hasn’t priced yet,” added Madison Cartwright, senior geo-economics analyst at Commonwealth Bank of Australia.
## What Is the Gold Price Today?
The **gold price today** fell 1.1% to $4,163.93 per troy ounce, putting gold on course for its third consecutive weekly decline with a 1.3% weekly loss. US August gold futures fell a sharper 1.5% to $4,181.20. Despite the pullback from its all-time high above $4,500, gold remains up significantly for 2026, driven by safe-haven demand, central bank buying, and earlier US dollar weakness before the Fed’s June pivot.
Goldman Sachs cut its December 2026 **gold price** target to $4,900 per ounce from its previous estimate of $5,400. The bank cited two main reasons: it no longer expects any Federal Reserve rate cut in 2026, and now sees the risk of a rate hike as material. The broader precious metals complex also sold off sharply. Silver dropped 2.2% to $64.36 per ounce. Platinum lost 1.9% to $1,663.03. Palladium fell 1.6% to $1,258.04. All four metals are on track for weekly losses.
“Gold’s rally on the US-Iran peace deal proved short-lived. The resurgent dollar, powered by the Fed’s newly hawkish tone under Kevin Warsh, has stolen the spotlight,” said Tim Waterer. “The new chairman’s firm stance on price stability has neutralised the geopolitical tailwind and reminded traders that monetary policy still sets the direction for gold over the medium term.”
## Why Is the Dollar Index at a 13-Month High?
The US **dollar index** today stands at 100.78, up 1.0% for the week and at its highest level in 13 months. The dollar’s strength reflects a sharp repricing of Federal Reserve rate expectations following Wednesday’s June FOMC policy decision, where nine of the Fed’s 19 policymakers signalled they expect to raise rates at least once more this year.
New Fed Chair Kevin Warsh vowed to deliver price stability and showed no inclination to bow to political pressure for cuts. According to the [CME FedWatch Tool](https://www.cmegroup.com/markets/interest-rates/cme-fedwatch-tool.html), traders now price an 87% probability of at least one US rate hike by December 2026, sharply up from 61% before the meeting. Two-year Treasury yields rose 9 basis points over the week to 4.179%. Ten-year yields fell 3 bps to 4.451% and 30-year yields dropped 7 bps to 4.901%.
The yield curve flattening reflects a dual signal: markets believe the Fed will hike near-term but also trust that tightening will successfully contain inflation. “The curve remained notably flatter than before the meeting, reflecting higher expected near-term policy rates and firmer confidence in the Fed’s inflation-fighting credibility,” said Molly Nickolin, strategist at [Morgan Stanley](https://www.morganstanley.com/ideas/global-macro-outlook).
## Is Japan About to Intervene in the Currency Market?
Japan’s yen weakened to 161.26 per dollar on Friday, its softest level since July 2024 and well beyond the 160 per dollar level widely regarded as Japan’s informal intervention threshold. Japanese authorities have intervened to support the yen multiple times since 2022, spending hundreds of billions of yen defending the currency near current levels. With USD/JPY now through 161, speculation about a new intervention episode is intensifying.
The yen’s weakness is a direct consequence of the interest rate differential between the US and Japan. While the Fed is signalling hikes, the Bank of Japan remains far below US rates and faces domestic pressure to keep conditions accommodative. A stronger dollar mechanically weakens the yen, and until the rate differential narrows, verbal intervention — and potentially the real thing — remains the most likely Japanese policy response.
Elsewhere, the British pound fell 0.1% to $1.3195 after a 0.7% drop following the Bank of England’s 7-2 vote to hold rates at its June meeting. The cautious BoE stance, combined with dollar strength, weighed on sterling.
## Full Global Markets Scorecard
| Asset | Level | Day Change | Weekly Change |
|---|---|---|---|
| Nikkei 225 (Japan) | Record High | +0.8% | +8.5% |
| KOSPI (South Korea) | Record High | +3.1% | +15.3% |
| US Futures (S&P 500) | Near flat | -0.2% | Closed Fri |
| Intel Corp | Record High | +10.0% | New High |
| Brent Crude | $79.03/bbl | -1.0% | -9.5% |
| WTI Crude | $76.43/bbl | -0.2% | -9.0% |
| Spot Gold | $4,163.93/oz | -1.1% | -1.3% |
| Spot Silver | $64.36/oz | -2.2% | Negative |
| Dollar Index (DXY) | 100.78 | Flat | +1.0% |
| USD/JPY (Yen) | 161.26 | Yen weaker | 13-month high $ |
| GBP/USD (Pound) | $1.3195 | -0.1% | -0.8% |
| 2-Year Treasury Yield | 4.179% | +2 bps | +9 bps |
| 10-Year Treasury Yield | 4.451% | Flat | -3 bps |
| 30-Year Treasury Yield | 4.901% | Flat | -7 bps |
## What to Watch Next Week
Several key catalysts could move markets significantly when trading resumes on Monday. First, tanker traffic data from the Strait of Hormuz will either confirm or challenge oil’s selloff. If the 85+ million barrels of stranded oil begin arriving at Asian and European refineries as expected, Brent could test $75. If political disruptions delay transit, a swift rebound toward $85 is possible.
Second, Japanese authorities may intervene in currency markets if USD/JPY continues above 161. Japan’s Ministry of Finance has previously drawn red lines at 150, 155, and 160 — all of which gave way. The 160-165 range is now the live battleground. Any confirmed intervention will trigger sharp yen volatility and could reverse some of the Nikkei’s gains.
Third, watch China when mainland and Hong Kong markets reopen Monday after the Dragon Boat Festival. Given the scale of gains in Japan and Korea this week, Chinese equities could see a catch-up rally — particularly if the People’s Bank of China signals further liquidity support.
## Frequently Asked Questions
### Why is the Nikkei at a record high today?
The Nikkei hit a record high for the fifth straight session, driven by lower oil prices from the US-Iran peace deal reducing energy import costs, easing inflation fears allowing the Bank of Japan to stay accommodative, and a weaker yen boosting the earnings of Japan’s major exporters like Toyota, Sony, and Nintendo in yen terms.
### Why is the gold price falling today?
Gold is falling because the US dollar surged to a 13-month high after the Federal Reserve signalled rate hikes, with nine policymakers backing at least one US rate increase in 2026. A stronger dollar makes gold more expensive for overseas buyers and reduces its appeal versus interest-bearing assets like Treasury bonds, which now offer higher yields.
### Why is the Brent crude price below $80 today?
Brent crude fell below $80 as oil tankers resumed passage through the Strait of Hormuz following the US-Iran peace deal. Analysts expect over 85 million barrels of stranded oil to re-enter global supply, and the lifting of US sanctions on Iranian exports will add a further estimated 1.5 million barrels per day of supply capacity to the market.
### What is the probability of a Fed rate hike in 2026?
Markets price an 87% probability of at least one Federal Reserve rate hike by December 2026, up from 61% before the June FOMC meeting, per CME FedWatch data. Nine of 19 policymakers backed higher rates, and new Chair Kevin Warsh has signalled a firm commitment to price stability.
### Will Japan intervene to defend the yen?
Japan has not confirmed intervention but the yen at 161.26 per dollar is beyond the 160 threshold widely seen as a trigger. Japan intervened multiple times in 2022-2024 at similar levels. Currency traders are watching closely for any Tokyo statement or confirmed Bank of Japan action, which could trigger a sharp yen reversal.
**Stay ahead of global markets every day.**
Breaking financial news, real-time data and expert analysis — all on **[Daily Finance](https://df.media/)**.
**Categories:** Capital Markets, Finance, Investing
---
### [Algreen Capital: Where Profit Meets Real-World Impact](https://df.media/algreen-capital-investment-model/)
**Published:** June 17, 2026
**Author:** Laura Anderson
**Excerpt:** Algreen Capital is a family office built around ESG investing and impact investing through iBig. Discover how this unique family office investment model puts profit and purpose on the same side.
**Content:**
**Algreen Capital** is a family office and investment firm built around one central conviction: that businesses solving real problems for people and the planet are the most commercially resilient investments over any serious time horizon. Founded by serial entrepreneur and impact investor Jonathan Tjoa Algreen, the firm operates across property, listed equities, private companies, fixed income bonds, blockchain infrastructure, artificial intelligence and media. Every allocation is evaluated against the same ESG and impact framework, without exception.
At the heart of the structure sits [iBig, the Impact Business Investment Group](https://www.ibig.vc/), Algreen Capital’s dedicated **impact investing** vehicle. Together, the two organisations represent one of the more coherent models for **ESG investing** operating across global markets today: a structure where profit and purpose are treated as aligned drivers of long-term value, not competing trade-offs.
## What Is Algreen Capital?
Algreen Capital is a private **family office investment** firm. The family office structure is deliberate and central to how the firm operates. Unlike institutional fund managers bound by external investor mandates, Algreen Capital answers to no quarterly redemption cycle and no outside shareholders demanding short-term returns. The result is an investment horizon defined by conviction and long-term commercial logic, not by fund lifecycle constraints.
The portfolio spans seven distinct asset classes: property, publicly listed companies, private businesses, fixed income bonds, blockchain infrastructure, artificial intelligence and media. What makes the Algreen Capital model distinctive is that none of these allocations operates under a separate ESG sleeve or a bolt-on impact policy. The impact framework is applied from the first moment of every evaluation, across every asset class.
This is not ESG as a marketing label. It is ESG as the foundational investment criterion. The mission preceded the portfolio, and the structure was built to support it.
## How Does the Family Office Structure Enable Better Impact Investing?
The structural constraints carried by conventional fund managers rarely get discussed openly, but they shape almost every significant decision made inside a traditional investment firm.
Quarterly reporting cycles push decision-making toward short-term outcomes. External investor bases with competing priorities make it difficult to hold positions through periods where the long-term thesis is sound but near-term performance is under pressure. Predefined mandates block entry into opportunities that fall outside narrow sector or geography parameters. Redemption pressure can force exits at precisely the wrong commercial moment.
Algreen Capital’s **family office investment** structure removes all of these constraints simultaneously. There are no outside shareholders to satisfy on a quarterly basis. There is no redemption pressure forcing premature exits. The investment horizon is defined by the underlying commercial logic of each opportunity, not by external financial obligations.
For **impact investing** specifically, this distinction matters enormously. The most significant businesses being built around clean technology, financial inclusion, responsible AI and sustainable production often require years before conventional performance metrics reflect the quality of the underlying business. Algreen Capital’s structure enables genuine long-term backing: entering early, staying invested through the full development arc, and allowing value to compound without the pressure of forced exits.
## What Is iBig and How Does It Fit Into Algreen Capital?
[iBig, the Impact Business Investment Group](https://www.ibig.vc/), was created with a precise mandate: to identify, support and scale businesses producing verifiable positive change for society and the environment, while delivering strong commercial returns alongside that impact.
Algreen Capital is iBig’s founding parent company and lead investor. The relationship is structural: iBig draws on Algreen Capital’s capital base, strategic depth and long-term commitment to back purpose-driven businesses from early stage through to global reach. Every business iBig backs benefits from the full resources of the Algreen Capital ecosystem behind it.
The word verifiable is doing important work in the iBig model. A significant proportion of what travels under the impact investing label cannot be independently assessed. Proprietary ESG scoring systems generate convenient numbers. Self-reported metrics tell only the story the firm wants told. iBig measures every portfolio business against the [United Nations Sustainable Development Goals](https://sdgs.un.org/goals): 17 globally agreed goals with 169 specific, measurable targets. This is a framework used by governments, international development institutions and the most rigorous impact investors operating across global capital markets. Every iBig portfolio company can be assessed against an externally recognised standard, not a self-defined one.
iBig also functions as a co-building partner, not a passive capital vehicle. It provides strategic thinking, operational support, global network access and long-term commitment to every business it backs. The stated purpose is to take impact-driven ventures from local to global scale, with iBig operating as a genuine scaling engine rather than simply a source of early funding.
## How Does Algreen Capital Approach ESG Investing Across Asset Classes?
Each asset class within the Algreen Capital portfolio serves a defined purpose while adhering to the same non-negotiable impact criteria applied across the whole. The consistency of this framework is what separates the Algreen Capital model from firms that apply ESG criteria selectively or only to certain fund products.
In listed and private equities, dual market access allows the firm to engage at every stage of a business’s lifecycle. Early-stage private companies often represent the most compelling **ESG investing** opportunities precisely because public market investors cannot yet participate. Algreen Capital can move early on businesses where the impact thesis is clear and the commercial potential is substantial, then remain invested as performance compounds.
Fixed income positions provide portfolio stability and risk management. Algreen Capital applies the same values-driven evaluation to bonds that it applies to growth equities, ensuring the entire portfolio operates under a unified set of principles rather than maintaining a split approach by asset class.
In blockchain infrastructure, the investment thesis is long-term and specific. Decentralised systems are expanding financial access in markets where conventional banking has never operated effectively, and creating verifiable ownership records in industries where historical opacity has protected entrenched interests at the expense of smaller participants. These are the applications that meet the Algreen Capital investment criteria.
Artificial intelligence allocations focus on businesses solving genuine, persistent problems with durable competitive advantages rather than businesses capitalising on a sector trend. The distinction determines long-term value creation. A business addressing a real problem with a defensible AI solution compounds value over time. One built on trend proximity alone does not.
Media positions are treated as long-term strategic allocations, reflecting the firm’s view that businesses shaping how information reaches people and how trust is built across global audiences carry structural leverage over almost every other sector of the economy.
## Why Is Impact Investing Through a Family Office Different From Conventional Approaches?
The distinction between genuine **impact investing** and conventional ESG fund management is more significant than it appears from the outside.
Traditional ESG funds operate primarily through exclusion: they screen out companies causing identifiable harm and construct portfolios from businesses that pass the screen. The ESG mandate ends at the point of investment. The fund does not actively build or improve the businesses it holds. It avoids the worst and holds the rest.
Impact investing requires active intention. Capital is directed specifically toward businesses designed to create positive environmental or social outcomes. According to the [UN Principles for Responsible Investment](https://www.unpri.org/investment-tools/searching-for-a-definition-of-impact-investing/8774.article), impact investing demands measurable, additional positive outcomes rather than harm avoidance alone. The investment is structured around what the business will achieve, not simply what it will avoid.
Algreen Capital and iBig operate at this higher standard. Every business backed through iBig is selected because of the positive outcomes it creates, measured against an internationally recognised standard. This is the model that increasingly sophisticated founders and capital allocators are looking for, and it is one that the Algreen Capital family office structure is uniquely positioned to deliver with genuine long-term commitment.
## Who Is Jonathan Tjoa Algreen?
Jonathan Tjoa Algreen is a serial entrepreneur, impact investor and the founder of Algreen Capital. His entrepreneurial career spans more than two decades across fashion, food, technology, fintech, property and investment. He has founded, operated, acquired and divested businesses across these sectors, consistently integrating sustainability commitments and social impact into each venture’s core model.
Among the ventures Jonathan has founded or co-owned are 1 People, a sustainable fashion company; Business for Planet, a free online entrepreneurship programme for impact-driven founders; LOVENATURE Superfoods; Valified; Nordic Impact Bridge; and DoLand. Each of these businesses operates with transparency, sustainable supply chain commitments and a purpose larger than commercial return embedded from the start.
Jonathan’s stated purpose is not incidental to Algreen Capital’s investment model. It is the reason the model was built. His conviction, developed across decades of building businesses, is that poverty, inequality and environmental degradation are not inevitable conditions but problems that well-structured, commercially strong businesses can help solve. Algreen Capital and iBig are the vehicles through which he pursues that conviction at scale.
## What Does the Regulatory Environment Mean for ESG Family Offices in 2026?
The rules governing how investment firms represent and report ESG credentials are becoming substantially more demanding across every major financial market in 2026.
The European Union’s Sustainable Finance Disclosure Regulation has fundamentally changed how funds operating in European markets must classify and communicate sustainability characteristics. In the United States, the SEC has advanced enhanced ESG disclosure requirements. Asia-Pacific jurisdictions are implementing comparable frameworks. The direction across all major markets is consistent: higher standards, greater transparency and stronger accountability for ESG claims.
Firms that built genuine ESG processes before this regulatory shift are finding compliance straightforward because the substance was already present. Firms that added ESG labelling in response to investor or market pressure are discovering that the new frameworks demand substantive evidence that many of them do not have.
Algreen Capital built its processes first. The regulatory environment is arriving at a position the firm has occupied since its founding. For a **family office investment** that established its impact framework and UN SDG measurement approach before ESG became a competitive priority, the tightening regulatory landscape represents a structural advantage over latecomers rather than a compliance burden.
## Frequently Asked Questions: Algreen Capital and iBig
### What is Algreen Capital?
Algreen Capital is a private family office and investment firm founded by Jonathan Tjoa Algreen. It invests across property, listed and private equities, bonds, blockchain, AI and media with a full ESG and impact framework applied to every allocation. The firm is the founding parent company and lead investor of iBig, the Impact Business Investment Group.
### What does iBig stand for?
iBig stands for Impact Business Investment Group. It is Algreen Capital’s dedicated impact investing vehicle, focused on identifying and scaling businesses that generate verifiable positive outcomes measured against the United Nations Sustainable Development Goals.
### How is Algreen Capital different from a standard ESG fund?
Standard ESG funds screen out harmful businesses but invest passively in whatever passes the filter. Algreen Capital actively selects, backs and co-builds businesses designed to create positive impact from the ground up. The impact framework is the investment criterion, not an additional compliance screen applied after selection.
### Why does Algreen Capital operate as a family office?
The family office structure removes the short-term performance pressures that prevent most institutional managers from making genuine long-term impact commitments. Without external shareholders or redemption cycles, Algreen Capital can back businesses through the full arc of their development rather than being forced into premature exits at commercially suboptimal moments.
### Which UN SDGs does Algreen Capital’s portfolio align with?
Alignment varies by portfolio company. The UN SDG framework is applied across all 17 goals, with particular relevance to clean energy, reduced inequalities, climate action, responsible consumption and innovation infrastructure depending on the specific business being evaluated.
### How can founders connect with Algreen Capital or iBig?
Founders can explore partnership opportunities through [ibig.vc](https://www.ibig.vc/) and through algreencapital.com, where the firm’s investment focus and co-building approach are detailed in full.
**Categories:** Capital Markets, Finance, Investing
**Tags:** Algreen Capital, ESG investing, family office, iBig, impact investing, Jonathan Algreen, sustainable investing
---
### [Everything Is Surging: How the US-Iran Peace Deal Just Changed Oil, Gold, Stocks and Interest Rates in One Morning](https://df.media/markets-today-june-15-2026/)
**Published:** June 15, 2026
**Author:** Vishnu Priya
**Content:**
**Markets today**, June 15, 2026, are delivering one of the most powerful single-day global rallies of the year. A framework peace deal between the United States and Iran: confirmed early Monday and including an agreement to reopen the Strait of Hormuz: sent oil prices crashing to a three-month low, drove global stock markets from Tokyo to Frankfurt to records, and pushed gold to a near one-week high. Wall Street futures pointed to gains of 1.3% to 2% before the opening bell.
Markets today, June 15, 2026: Global stocks surge as the US-Iran peace deal sends oil crashing and gold to near a one-week high.The **Iran peace deal markets** reaction was immediate and total. Europe’s STOXX 600 and FTSE Eurofirst hit all-time highs. Asia surged overnight. Bond yields fell. The US dollar dropped to a 10-day low. Gold climbed 2.7%. Silver surged 3.7%. Palladium jumped 4.4%. Bitcoin gained 2.5%. In a single Monday morning, **markets today** repriced a world where the 2026 energy shock is beginning to reverse: and where central bank rate hikes look far less likely than they did last Friday.
---
## The US-Iran Peace Deal: What Happened
Pakistani Prime Minister Shehbaz Sharif confirmed early Monday that an Iran peace deal had been struck. President Donald Trump added that the pact included opening the Strait of Hormuz: through which roughly 20% of the world’s oil supply passes. The agreement will be officially signed on Friday in Switzerland. Critically, the fate of Tehran’s nuclear program has been left to further negotiations, meaning the deal is a ceasefire framework, not a final settlement.
Iran said traffic through the Strait would be regulated by it and Oman: a potential transit oversight arrangement that tempered some initial euphoria without reversing the broader **Iran peace deal markets** surge. Trump is set to meet Middle Eastern leaders and hold a working session with Ukrainian President Volodymyr Zelenskiy at a G7 summit in France this week.
Saxo Bank strategist John Hardy called the development “about as supportive as you can get” for global **markets today**, especially after last week’s record-breaking [$75 billion SpaceX IPO](https://df.media/spacex-ipo-share-price-valuation-how-to-buy-spcx-2026/). “What do you add on from here to get sentiment even bubblier?” he said.
## Oil Price Today: Brent Crashes 5% to $83: a Three-Month Low
The **oil price today** is the headline number driving everything else. [Brent crude fell 5% to $83 a barrel](https://www.reuters.com/markets/commodities/shares-bonds-surge-oil-slides-iran-deal-2026-06-15/): a three-month low, well off the May 2026 peak of $126.41, and still above the $67 where it traded before the Iran conflict began in late February. The **oil price today** drop is the primary force easing global inflation risk and arriving just in time for the wave of central bank meetings this week.
CBA analyst Vivek Dhar put a year-end target on the **oil price today** trajectory: “We see Brent oil futures falling to $80 by the end of the year, assuming the strait does not close again. This view carries considerable uncertainty tied to the damage to oil and refinery assets.” The prospect of cheaper oil is particularly significant for Japan: a major net energy importer: which helps explain why the Nikkei led Asian markets with a 5% overnight surge.
## Gold Price Today: Spot Gold Surges 2.7% to $4,334: Near One-Week High
The **gold price today** hit its highest level since June 9. [Spot gold rose 2.7% to **$4,334.48 per ounce**](https://www.reuters.com/markets/commodities/gold-hits-near-one-week-high-after-us-iran-peace-deal-2026-06-15/). US gold futures for August delivery climbed 2.8% to $4,355.30. The rally in **gold price today** was driven by three forces hitting simultaneously: a falling US dollar (10-day low), reduced rate-hike expectations, and residual safe-haven demand from investors not yet fully pricing in peace.
UBS analyst Giovanni Staunovo explained the dynamic: “Market participants are pricing out rate hikes due to lower oil prices, which is lifting the yellow metal. Near-term, I would expect some consolidation, until we get some clarity from the Fed later this week.” The probability of a December Fed rate hike has already fallen from 69% last week to 53% today, according to the [CME FedWatch tool](https://www.cmegroup.com/markets/interest-rates/cme-fedwatch-tool.html): directly boosting the **gold price today** by reducing the opportunity cost of holding non-yielding bullion.
The broader precious metals complex surged alongside the **gold price today**. Silver jumped 3.7% to $70.51 per ounce. Platinum gained 3.4% to $1,776.83. Palladium led the complex with a 4.4% rally to $1,339.76. In a structural development, Singapore announced it will establish an over-the-counter gold clearing system and introduce central bank gold-vaulting services: cementing its position as a major gold trading hub.
## Stock Market Today June 15: Complete Global Scorecard
The **stock market today**, June 15, is a global sweep of gains:
**Asia (overnight):** Nikkei 225: +5.0% \| KOSPI: +5.2% \| CSI 300: +1.4% \| MSCI Asia-Pacific ex-Japan: +2.4%
**Europe:** STOXX 600: All-time record \| FTSE Eurofirst 300: All-time record
**Wall Street futures:** +1.3% to +2.0%
The **stock market today** rebound directly reverses last week’s damage. Our June 11 coverage: [Dow Plunges 953 Points as US Strikes Iran](https://df.media/stock-market-today-iran-strikes-june-11-2026/): captures how far the sentiment has swung in four days. That S&P -1.62%, Nasdaq -1.98%, Dow -953-point selloff is being substantially unwound in a single session.
## Central Banks: Fed Holds, BoJ Hikes, BoE Steady
The Iran peace deal and the **oil price today** crash arrived at exactly the right moment. The Federal Reserve is expected to hold rates at 3.50%–3.75% at Wednesday’s meeting: the debut of new Fed Chair Kevin Warsh. The probability of a December hike has fallen to 53% from 69%. Saxo Bank’s Hardy: “The whole communication strategy is going to be completely different under Warsh. They are going to hold their cards a lot closer to their chest”: the biggest Fed transition since Bernanke succeeded Greenspan in 2006.
The Bank of Japan is expected to raise rates 25 basis points to 1.0% on Tuesday: the falling **oil price today** reducing Japan’s imported inflation and making that move more comfortable. The Bank of England holds at 3.75% Thursday. The BoE’s vote split and MPC report will be scrutinized for any change in tone. Key UK data this week: May inflation, retail sales, and April employment.
## Bonds and Currencies: Dollar at 10-Day Low, Yields Slide
US 2-year Treasury yields fell 6 basis points to 4.02%. Germany’s 2-year yield dropped 4 basis points to a two-week low of 2.571%. In currencies, the US dollar fell to a 10-day low, boosting the **gold price today** and easing financial conditions globally. The euro rose 0.4% to $1.1617. Sterling gained 0.3% to $1.3446. Dollar/yen held at 160.00, with the yen in a bear trend despite Tuesday’s expected BoJ hike.
## Bitcoin: Up 2.5% to $65,633
Bitcoin rose 2.5% to $65,633, matching the gain in gold and riding the same risk-on surge that lifted **markets today** globally. The crypto market had sold off on June 11 during the Iran escalation; Monday’s peace deal has partially reversed those losses.
---
## Markets Today June 15: Complete Numbers
**EQUITIES**
Nikkei 225: +5.0% \| KOSPI: +5.2% \| CSI 300: +1.4% \| MSCI Asia-Pacific ex-Japan: +2.4% \| STOXX 600: All-time record \| Wall St Futures: +1.3–2.0%
**COMMODITIES**
Brent Crude: $83/bbl (-5%, 3-month low) \| Gold (spot): $4,334.48/oz (+2.7%) \| Gold (Aug futures): $4,355.30 (+2.8%) \| Silver: $70.51/oz (+3.7%) \| Platinum: $1,776.83 (+3.4%) \| Palladium: $1,339.76 (+4.4%)
**BONDS & RATES**
US 2-Year Yield: 4.02% (-6bps) \| German 2-Year Yield: 2.571% (-4bps) \| Dec Fed hike probability: 53% (vs 69% last week)
**CURRENCIES**
EUR/USD: $1.1617 (+0.4%) \| GBP/USD: $1.3446 (+0.3%) \| USD/JPY: 160.00 \| USD Index: 10-day low
**CRYPTO**
Bitcoin: $65,633 (+2.5%)
---
## Frequently Asked Questions: Markets Today June 15
### Why are markets surging today?
Markets today are surging on confirmation of a US-Iran peace deal reopening the Strait of Hormuz. The deal drops oil prices and inflation risk globally, cutting the likelihood of central bank rate hikes.
### What is the gold price today?
The gold price today is $4,334.48/oz (spot), up 2.7%: a near one-week high. US gold futures for August reached $4,355.30 (+2.8%). The rally reflects lower rate-hike expectations and a weaker US dollar.
### What is the oil price today?
The oil price today is $83/barrel for Brent crude (-5%): a three-month low. Oil peaked at $126.41 in May 2026. Analysts at CBA see Brent reaching $80 by year-end if the Strait of Hormuz stays open.
### Which markets are up the most today?
KOSPI (South Korea) +5.2% and Nikkei (Japan) +5.0% led global gains. Europe’s STOXX 600 hit an all-time record. Wall Street futures point to a 1.3%–2.0% open for June 15.
### What will the Fed decide this week?
The Fed is expected to hold at 3.50%–3.75% on Wednesday: Kevin Warsh’s debut meeting. The December rate-hike probability has fallen from 69% to 53% following the Iran peace deal and oil price collapse.
---
## Stay Ahead of Every Market Move with Daily Finance
From the Iran peace deal to the Fed decision Wednesday and the **gold price today** surge, **markets today** are moving fast. [Daily Finance](https://df.media/) covers every number that matters: oil, gold, stocks, bonds, and crypto: in real time. Bookmark Daily Finance and never miss a market-moving story.
**Categories:** Banking
---
### [SpaceX IPO Makes History: SPCX Stock Soars 19% in $75 Billion Debut — Is the $2 Trillion Valuation Justified?](https://df.media/spacex-ipo-share-price-valuation-how-to-buy-spcx-2026/)
**Published:** June 13, 2026
**Author:** Vishnu Priya
**Content:**
The **SpaceX IPO** is now the largest public offering in stock market history. On June 12, 2026, Elon Musk’s Space Exploration Technologies Corp raised a record $75 billion by selling 555.56 million Class A shares at $135 each on the Nasdaq under the ticker **SPCX**. By the closing bell, **SPCX stock** had surged 19% to $161.11 — and SpaceX’s market capitalization crossed $2 trillion on its very first day of trading.
The **SpaceX IPO price** made every prior record look modest. Alibaba’s 2014 IPO raised $25 billion. Saudi Aramco raised $29.4 billion. SpaceX did it at nearly three times that scale, with demand four times the shares available. Whether you are trying to understand the **SpaceX valuation 2026** debate, figure out **how to buy SpaceX stock** today, or simply make sense of what a $2 trillion aerospace company means for the market — this is the complete guide.
---
SpaceX IPO: SPCX stock opened at $150 and closed at $161.11 on its historic June 12, 2026 debut.## When Did the SpaceX IPO Happen?
The **SpaceX IPO** priced on the evening of June 11, 2026, at $135 per share. Trading in **SPCX stock** began June 12 on the Nasdaq. The stock opened at $150, hit an intraday high of $176.52, and closed at $161.11 — a 19.3% gain from the **SpaceX IPO price** on day one. The offering eclipses every previous listing in history, including Alibaba ($25B, 2014) and Saudi Aramco ($29.4B, 2019).
As of June 13, **SPCX stock** carries a market capitalization of approximately $2.11 trillion, making SpaceX the sixth-largest publicly traded company in the United States overnight.
## What Is the SpaceX IPO Price?
The **SpaceX IPO price** was set at **$135 per share**. The offering was four times oversubscribed — demand from institutional and retail investors far exceeded available shares. That pressure pushed **SPCX stock** to $161.11 on day one, giving the **SpaceX IPO** one of the strongest first-day performances for a listing of this size.
Investors buying **SPCX stock** in the open market today enter at roughly 19% above the SpaceX IPO price. That premium reflects the market’s opening verdict on **SpaceX valuation 2026**: the $1.75 trillion IPO price has already been surpassed in secondary trading.
## What Is SpaceX Valuation 2026?
**SpaceX valuation 2026** at the **SpaceX IPO price** was **$1.75 trillion** — the highest valuation ever assigned to a company at the moment of public listing. After **SPCX stock**‘s first-day rally, that figure expanded to approximately $2.11 trillion.
The **SpaceX valuation 2026** debate is one of the most contested in finance. Morningstar analysts place fair value at $780 billion — less than half the SpaceX IPO price — citing the $4.9 billion GAAP net loss in 2025 and a price-to-sales multiple of approximately 100x. Scottish Mortgage Investment Trust had valued SpaceX at $1.25 trillion before listing, still 28% below where **SPCX stock** actually priced.
The bull case for **SpaceX valuation 2026** centers on Starlink’s growth trajectory and a total addressable market of $28.5 trillion, weighted heavily toward AI infrastructure. Bears counter that capital-intensive aerospace businesses have never historically supported software-level multiples — regardless of how compelling the vision.
## What Are SpaceX’s Financials?
SpaceX’s S-1 filing — the first public look at its finances — showed **$18.7 billion in 2025 revenue** and a **net loss of $4.9 billion**. Adjusted EBITDA reached $6.6 billion after stripping out capex, stock-based compensation, and xAI losses. In Q1 2026, revenue grew to $4.70 billion (up from $4.07B a year earlier), though the net loss widened to $4.30 billion, reflecting accelerated Starlink and Starship investment.
Starlink is the financial backbone of the **SpaceX IPO** story. The satellite internet segment generated **$11.4 billion in 2025 revenue** — 61% of total company revenue — serving 10.3 million subscribers in 164 countries with 9,600+ satellites deployed. According to [CNBC](https://www.cnbc.com/2026/06/12/spacex-ipo-spcx-live-updates.html), Starlink’s subscriber growth rate is the single most important variable in the **SpaceX valuation 2026** equation.
## How to Buy SpaceX Stock (SPCX) Today
Here is **how to buy SpaceX stock** right now: **SPCX stock** trades on the Nasdaq and is available through any brokerage with US equity access. US investors can buy SpaceX stock through **Fidelity, Charles Schwab, Robinhood, E\*Trade, SoFi, and eToro**.
**How to buy SpaceX stock** internationally: most non-US brokerages that offer Nasdaq access list SPCX. No W-8BEN form is required for open-market purchases — that was only needed for **SpaceX IPO** allocation participants.
Before deciding **how to buy SpaceX stock**, consider the valuation context. At $161 per share, **SPCX stock** prices SpaceX at over 100x 2025 revenue. Financial advisors broadly recommend sizing any single IPO holding as part of a diversified portfolio, not a concentrated bet — especially for a company still recording multi-billion-dollar annual losses.
## How Did Retail Investors Access the SpaceX IPO?
The **SpaceX IPO** reserved 30% of shares — more than $22 billion — for retail investors. That is three to six times the typical retail allocation in large US IPOs. Five brokerages distributed retail **SpaceX IPO** shares: **Robinhood, SoFi, E\*Trade, Fidelity, and Charles Schwab**. Fidelity lowered its account minimum to $2,000 for **SpaceX IPO** participation. Retail investors who sold **SPCX stock** within 15 days may face restrictions on future Fidelity IPO allocations.
## Is the SpaceX IPO Overvalued?
**SpaceX valuation 2026** at $1.75 trillion — 100x revenue and rising — would be extreme by any traditional measure. Morningstar pegs fair value at $780 billion. The gap between their estimate and the **SpaceX IPO price** is not a rounding error; it reflects a fundamental disagreement about what kind of company SpaceX actually is.
The bear case on **SPCX stock**: SpaceX posted a $4.9 billion loss last year. Starship is unproven at commercial scale. Amazon’s Kuiper constellation is a credible Starlink competitor. At 100x sales, any subscriber growth miss makes the **SpaceX IPO price** look extended.
The bull case: Starlink’s $11.4 billion in 2025 revenue is compounding fast. The $28.5 trillion TAM reflects a genuine AI infrastructure shift. If Starlink hits 50 million subscribers and Starship routinizes launch costs, the **SpaceX IPO price** could look cheap in five years. **SpaceX valuation 2026** is ultimately a bet on a decade-long trajectory, not a quarterly earnings play.
## What Does the SpaceX IPO Mean for the Market?
The **SpaceX IPO** signals a new era for mega-cap technology listings. At $75 billion raised and a $2 trillion opening-day market cap, it recalibrates what “going public” means in 2026. Other privately held giants — Stripe, ByteDance, Databricks — face intensified investor pressure to follow given the **SpaceX IPO**‘s overwhelming success.
For the Nasdaq and US equity indices, **SPCX stock**‘s arrival at $2+ trillion creates immediate passive-fund rebalancing pressure. Index funds tracking large-cap growth will accumulate **SPCX stock** in the weeks ahead, creating sustained institutional buying beyond the IPO excitement.
---
## SpaceX IPO: Key Facts at a Glance
**IPO Date:** June 12, 2026
**Exchange:** Nasdaq
**Ticker:** SPCX
**SpaceX IPO Price:** $135 per share
**SPCX Stock Day 1 Close:** $161.11 (+19.3%)
**Day 1 Intraday High:** $176.52
**Shares Offered:** 555.56 million Class A shares
**Total Raised:** $75 billion
**SpaceX Valuation 2026 (IPO):** $1.75 trillion
**SpaceX Valuation 2026 (post day-one):** ~$2.11 trillion
**2025 Revenue:** $18.7 billion
**2025 Net Loss:** $4.9 billion
**2025 Adjusted EBITDA:** $6.6 billion
**Starlink Revenue (2025):** $11.4 billion (61% of total)
**Starlink Subscribers:** 10.3 million in 164 countries
**Retail Allocation:** 30% of offering
**How to Buy SpaceX Stock:** Fidelity, Schwab, Robinhood, E\*Trade, SoFi
---
## Frequently Asked Questions — SpaceX IPO
### What is the SpaceX IPO price?
The **SpaceX IPO price** was $135 per share. **SPCX stock** surged 19.3% on its first day of trading, closing at $161.11 on June 12, 2026.
### When did SpaceX go public?
The **SpaceX IPO** priced June 11 and **SPCX stock** began trading June 12, 2026, on the Nasdaq. It raised $75 billion — the largest IPO in history.
### What is SpaceX valuation 2026?
**SpaceX valuation 2026** was $1.75 trillion at the **SpaceX IPO price**. After day one, **SPCX stock** pushed the market cap above $2.11 trillion.
### How to buy SpaceX stock?
The SpaceX IPO debut came days after Wall Street absorbed major geopolitical shocks. For context on the broader market environment SPCX stock launched into, read our coverage: [Stock Market Today: Dow Falls 953 Points as US Strikes Iran](https://df.media/stock-market-today-iran-strikes-june-11-2026/).
**How to buy SpaceX stock**: search SPCX on Fidelity, Schwab, Robinhood, E\*Trade, or SoFi. The **SpaceX IPO price** was $135; **SPCX stock** now trades above $160 on the open market.
### Is SpaceX profitable?
SpaceX is not GAAP profitable — it posted a $4.9 billion net loss on $18.7 billion in 2025 revenue. Adjusted EBITDA was $6.6 billion, and Starlink (61% of revenue) is growing rapidly.
### Can I still buy SPCX stock after the SpaceX IPO?
Yes. The **SpaceX IPO** retail window has closed, but **SPCX stock** trades freely on the Nasdaq. Open any brokerage account and search SPCX — that is **how to buy SpaceX stock** today.
---
## Stay Ahead of Every Major IPO with Daily Finance
The **SpaceX IPO** is the biggest story on Wall Street — but it will not be the last. From **SPCX stock** updates to the next trillion-dollar listing, [Daily Finance](https://df.media/) covers every market-moving IPO, earnings event, and stock story in real time. Bookmark Daily Finance and stay one step ahead every trading day.
**Categories:** Banking, Business, Global News
---
### [Stock Market Today, June 11, 2026: Wall Street Futures Rise as US Strikes Iran, SpaceX IPO Looms](https://df.media/stock-market-today-iran-strikes-june-11-2026/)
**Published:** June 11, 2026
**Author:** Laura Anderson
**Content:**
The stock market today showed resilience as US stock futures edged higher in early Thursday trading, even as the United States launched another round of airstrikes against Iran overnight, raising fresh fears about oil supply and global inflation heading into a week already defined by volatility.
Stock market today futures: the S&P 500 gained 0.32%, Dow Jones futures climbed 0.20%, and Nasdaq 100 futures rose 0.54% as of early Thursday. The bounce follows a brutal Wednesday session that sent the Dow tumbling 953 points, the S&P 500 falling 1.62%, and the Nasdaq Composite losing 1.98%.
## US Launches New Airstrikes on Iran, Tehran Closes Strait of Hormuz
US Central Command confirmed late Wednesday that American forces launched additional “self-defense strikes” against multiple targets in Iran at the direction of President Donald Trump. The strikes came hours after Trump warned reporters at the White House that Iran was taking “too long” to reach a peace agreement and would “pay the price.”
Iran’s military command responded by announcing the complete closure of the Strait of Hormuz to all vessels. The Strait of Hormuz is the world’s most critical chokepoint for global oil flows, responsible for roughly 20% of daily oil trade. Two ships were reported struck while attempting to cross out of the Persian Gulf, according to Iranian state media citing the Revolutionary Guard.
Oil prices surged on the news. [Brent crude futures](https://www.cnbc.com/markets/) climbed as high as 3.4% to cross above $96 per barrel, while WTI crude advanced as far as 3.8% to above $93 per barrel. Prices pulled back slightly after Fox News reported that Trump had spoken directly with Iranian leaders and suggested the bombing campaign could end shortly.
## Wednesday Stock Market Selloff: Chips Fall, Inflation Hits 3-Year High
The stock market today is recovering from Wednesday’s selloff, which was driven by two forces hitting simultaneously. A renewed rout in semiconductor stocks weighed heavily on the Nasdaq, while a fresh consumer price index reading showed inflation climbing to a three-year high, reinforcing fears that the Federal Reserve may be forced to raise interest rates further.
President Trump took an unusual tone in response to the inflation report, telling reporters in the Oval Office: “I’m not concerned about the latest inflation numbers. I love it. I love the inflation.”
The stock market today’s rotation away from technology and into defensive sectors including healthcare, pharmaceuticals, and energy reflects growing anxiety, according to Victoria Fernandez, chief market strategist at Crossmark Global Investments, who told [CNBC](https://www.cnbc.com) that clients are searching for “the antithesis of the momentum and the beta” that drove stocks higher earlier in the year.
## Oracle Sinks After $20 Billion Capital Raise Announcement
Oracle shares dropped more than 11% in extended trading Wednesday after the software giant announced plans to raise an additional $20 billion in equity and debt to fund its artificial intelligence buildout. The move spooked investors despite Oracle reporting earnings results that beat expectations on both the top and bottom lines, and the company raising its adjusted profit forecast for the full year.
The reaction reflected broader investor anxiety about the scale of AI capital expenditure across the sector. Oracle’s announcement echoed similar concerns that have weighed on other tech giants committing tens of billions to AI infrastructure, with public markets increasingly demanding a clearer path to returns.
## Asia-Pacific Markets Open Sharply Lower
While the stock market today in the US points higher, Asian markets opened deep in the red Thursday morning as the fresh Iran escalation sent shockwaves through the region. South Korea’s Kospi led losses with a 4.1% drop, while Japan’s Nikkei 225 fell 2.3% and Australia’s S&P/ASX 200 declined 0.97%. Hong Kong’s Hang Seng Index fell 1.15%.
The selloff reflected the region’s sensitivity to energy price shocks, given Asia-Pacific economies’ heavy dependence on Middle East oil imports flowing through the Strait of Hormuz.
## Gold Whipsaws as Investors Weigh War Risk
Gold prices whipsawed in volatile trading, briefly rising 1.1% before reversing to fall a similar amount, bringing the metal close to $4,000 per ounce. Gold last traded at $4,091, down $42.30 on the day. The metal has now fallen roughly 22% from its pre-war levels, according to [Bloomberg](https://www.bloomberg.com), as the Iran conflict has driven a complex mix of safe-haven demand and interest rate pressure that has weighed on non-yielding assets.
## SpaceX IPO: The Stock Market Today’s Main Event Arrives Friday
Despite the turbulence, the week’s most anticipated stock market today event is still on track. SpaceX is set to make its Nasdaq debut on Friday under the ticker SPCX, priced at $135 per share with a target valuation of $1.77 trillion. The listing would make it the largest IPO in US history, raising approximately $75 billion.
Market participants are watching the debut closely. Analysts noted that Tesla shares have been under pressure this week, with investors selling Tesla to position for a first-day gain in SpaceX. Tesla fell 3.80% on Wednesday.
The SpaceX debut comes at a delicate moment for markets. A strong opening could provide a badly needed sentiment lift for the broader technology sector. A weak showing would add to the growing unease about whether public markets are ready to price trillion-dollar AI-era valuations.
## What to Watch Thursday: PPI Report and Stock Market Futures
The stock market today will hinge on the Producer Price Index report due at 8:30 AM ET. Economists polled by [Reuters](https://www.reuters.com) expect wholesale inflation to have risen 0.7% on a monthly basis, with core PPI gaining 0.5%, both below the sharply elevated readings from April. Weekly jobless claims will also be released Thursday morning.
Oil prices and any further developments in the Iran conflict will remain the dominant driver of intraday sentiment. The Strait of Hormuz closure, if sustained, could push Brent crude well above $100 per barrel in the days ahead, adding a new layer of inflationary pressure that central banks will have little choice but to address.
---
## Stay Ahead of the Stock Market Today with Daily Finance
The stock market today moves fast. Get real-time breaking news, expert market analysis, IPO coverage, and global economic intelligence — all in one place. **[Visit Daily Finance](https://df.media/)** for the financial news that matters, the moment it happens.
**Categories:** Banking
---
### [AI Giants' Race to the Stock Market: OpenAI, Anthropic, and SpaceX Set to Reshape Public Markets](https://df.media/ai-ipo-2026-openai-anthropic-spacex/)
**Published:** June 9, 2026
**Author:** Vishnu Priya
**Excerpt:** The AI IPO 2026 race is on. OpenAI filed with the SEC, Anthropic is valued at $965B, and SpaceX targets a $1.77T Nasdaq debut. What investors need to know.
**Content:**
**The AI IPO 2026 wave is the most consequential moment in public market history since the dot-com era, and it arrived faster than almost anyone predicted.**
In the span of just two weeks, three of the most valuable private companies on the planet have signalled their intent to go public. OpenAI, the maker of ChatGPT, filed a confidential S-1 with the US Securities and Exchange Commission on June 8, exactly one week after rival Anthropic made its own confidential filing on June 1.
Meanwhile, Elon Musk’s SpaceX is already priced and set to begin trading on the Nasdaq on June 12, targeting a valuation of $1.77 trillion, which would make it the largest IPO in US history. These three AI IPO 2026 listings together represent a seismic test of investor appetite for high-burn, high-ambition technology companies, and the outcome will define the decade.
## OpenAI Enters the AI IPO 2026 Race With Confidential SEC Filing
OpenAI’s decision to file its S-1 confidentially came hours after Apple’s AI announcements at WWDC 2026, and the company knew it would not stay quiet for long. “We expect it to leak so we’re just announcing it,” the company said in a statement on June 8. The filing had been submitted around May 22, with Goldman Sachs, Morgan Stanley, and JPMorgan named as lead underwriters, a Wall Street lineup that signals serious institutional ambitions, [according to CNBC](https://www.cnbc.com/2026/06/08/openai-confidentially-files-for-ipo-prepping-wall-street-for-ai-debut.html).
Despite the filing, OpenAI struck a deliberately cautious tone on timing: “We have not decided on timing yet; it may be a while because there are things we want to do that are likely easier as a private company.” Analysts widely expect the company to target a public debut no earlier than Q4 2026, at a valuation projected to exceed $1 trillion. OpenAI’s current private market valuation sits at approximately $852 billion, and its compute costs alone are estimated to exceed $100 billion annually, far outpacing its current revenues. The company has raised over $180 billion in total funding, and going public would force a level of financial transparency it has never faced.
## Anthropic Nears $1 Trillion Valuation in AI IPO 2026 Countdown
Anthropic, the AI safety company and maker of the Claude chatbot, has been the quieter but arguably stronger entrant in the AI IPO 2026 race. It filed confidentially with the SEC on June 1, following a landmark $65 billion Series H funding round that pushed its post-money valuation to $965 billion. Unlike OpenAI, Anthropic’s financial profile is increasingly compelling. Its revenue run rate reached approximately $47 billion as of May 2026, up from roughly $10 billion the prior year, [per TechCrunch](https://techcrunch.com/2026/05/28/anthropic-raises-65-billion-nears-1t-valuation-ahead-of-ipo/). The company has also told investors it expects to turn a profit in the first half of 2026.
Founded by Dario Amodei and others who departed OpenAI over strategic disagreements with Sam Altman, Anthropic has positioned itself as the safety-focused counterweight in the AI race. Its Claude product line has seen explosive enterprise adoption, and a debut above the $1 trillion mark is now considered the base case by market observers, if conditions cooperate. As [the BBC reported](https://www.bbc.com/news/articles/c0k203kzp10o), the two companies are now jockeying not just over products and customers, but over who reaches the public markets first.
## SpaceX Sets the Stage for the AI IPO 2026 Era With a $1.77 Trillion Debut
While OpenAI and Anthropic are still in confidential filing territory, SpaceX is already at the finish line. The company priced its shares at $135, targeting a $1.77 trillion valuation, which would make it the seventh-largest company in the United States, above Tesla. SpaceX plans to sell 555.6 million shares, raising approximately $75 billion, with underwriters holding the option to purchase an additional 83.3 million shares worth $11.2 billion. The company will trade under the ticker **SPCX** on the Nasdaq.
Elon Musk will retain over 82% voting control following the IPO, preserving his grip on the company despite the public offering. The deal is the largest in US history, more than triple the size of Alibaba’s 2014 listing, the previous record-holder. SpaceX’s debut is not just a financial milestone. It is the opening act of the AI IPO 2026 supercycle, and how it trades in its first weeks will shape investor appetite for everything that follows.
## Why All Three Are Moving Now
The convergence of these listings is not accidental. As Sunil Krishnan of Aviva Investors told the BBC bluntly: “No one wants to be last.” All three companies have massive, ongoing capital needs, including compute infrastructure, chip procurement, model training, and global expansion. Public markets offer a scale of capital that even the most generous private rounds cannot match. For OpenAI and Anthropic specifically, the AI IPO 2026 timing is also about narrative control. Which company debuts first, and at what valuation, will define how Wall Street thinks about the generative AI sector for years.
As Richard Crowley, assistant professor at Singapore Management University, put it: “We might typically think of OpenAI and Anthropic as competitors, but the fate of their financing is intrinsically intertwined through the public’s perception of the generative AI space.” A stumble by one could drag the other down. A strong debut by either could validate trillion-dollar AI valuations across the board.
## What Investors Are Watching
Several key questions will determine how the AI IPO 2026 wave plays out for investors. Profitability timelines are the first battleground. Anthropic’s near-term profit claim is its strongest card. OpenAI and SpaceX are both burning significant cash, and public market investors will demand credible paths to sustainable margins. Compute cost trajectories are equally critical. OpenAI’s $100 billion-plus annual compute bill is eye-watering, and whether advances in model efficiency can bend that curve downward will be central to any investment thesis.
Regulatory risk looms large as well. AI regulation is accelerating globally, and public filings will for the first time expose the full scope of legal risks these companies face. Finally, competitive moats will be scrutinised hard. With Google, Microsoft, Meta, and a wave of open-source models all competing in the same space, investors will want to know what makes OpenAI’s and Anthropic’s positions genuinely defensible over a five-to-ten year horizon.
## The Bottom Line on the AI IPO 2026 Race
The AI IPO 2026 wave is not just a financial story. It is a moment of reckoning for the entire generative AI industry. SpaceX’s debut sets the tone. OpenAI and Anthropic follow with their own narratives about the commercial future of artificial intelligence. For investors, the opportunity is real but so are the risks. For the industry, going public means the era of private-market opacity is ending. The race to the stock market has begun, and the finish line is closer than most expected.
*Sources: [CNBC](https://www.cnbc.com/2026/06/08/openai-confidentially-files-for-ipo-prepping-wall-street-for-ai-debut.html), [BBC](https://www.bbc.com/news/articles/c0k203kzp10o), [Fortune](https://fortune.com/2026/06/09/openai-files-confidential-s-1-sec-ipo/), [TechCrunch](https://techcrunch.com/2026/05/28/anthropic-raises-65-billion-nears-1t-valuation-ahead-of-ipo/), [Washington Post](https://www.washingtonpost.com/business/2026/06/08/openai-ipo-chatgpt/e7573db2-6384-11f1-bdd4-805ebb99a693_story.html), [CNN Business](https://www.cnn.com/2026/06/01/tech/anthropic-ipo-filing)*
**Categories:** Banking
---
### [Gold Prices Fall While Oil Prices Rise as Middle East Tensions Rattle Global Markets](https://df.media/gold-prices-fall-as-oil-prices-rise-in-2026/)
**Published:** June 8, 2026
**Author:** Vishnu Priya
**Content:**
## Table of Contents
1. Gold Prices Fall After Strong US Jobs Data
2. Why Interest Rate Expectations Are Hurting Gold
3. Oil Prices Surge on Renewed Middle East Conflict
4. Rising Energy Costs Raise Inflation Concerns
5. Precious Metals Face Broad Selling Pressure
6. What Investors Are Watching Next
# Gold Prices Fall While Oil Surges as Middle East Tensions Rattle Global Markets
Global commodity markets moved in opposite directions on Monday as gold prices declined while oil prices climbed sharply. Investors reacted to a combination of stronger-than-expected U.S. economic data, rising expectations for higher interest rates, and escalating tensions in the Middle East.
Gold, traditionally viewed as a safe-haven asset during times of uncertainty, failed to benefit from geopolitical risks. Instead, traders focused on the possibility that the U.S. Federal Reserve may keep monetary policy tighter for longer, putting pressure on precious metals.
Meanwhile, crude oil prices jumped after reports of renewed military activity in the Middle East raised concerns about global energy supplies.
## Gold Prices Fall After Strong US Jobs Data
Gold extended losses after a stronger U.S. employment report showed that the American economy remains resilient despite rising energy costs and geopolitical uncertainty.
The United States added 172,000 jobs in May, significantly above market expectations. The data reinforced confidence in the labour market and prompted investors to reassess the likelihood of future Federal Reserve policy moves.
Following the report, financial markets increased their expectations for an interest rate hike later this year. Rising Treasury yields and a stronger U.S. dollar added further pressure on gold prices.
Because gold does not provide interest income, it often becomes less attractive when yields on bonds and other fixed-income investments rise.
## Why Interest Rate Expectations Are Hurting Gold
The recent decline in gold reflects changing expectations around inflation and interest rates.
While inflation concerns would normally support demand for precious metals, investors are increasingly worried that persistent price pressures could force the Federal Reserve to maintain higher borrowing costs.
Higher rates generally strengthen the U.S. dollar and increase returns on interest-bearing assets. Both factors tend to reduce demand for gold.
As a result, market participants have shifted their focus from geopolitical uncertainty to monetary policy, creating a challenging environment for bullion.
## Oil Prices Surge on Renewed Middle East Conflict
While gold struggled, oil prices moved sharply higher.
Brent crude rose more than $3 per barrel, while U.S. crude futures also posted strong gains. The rally followed reports of Israeli military strikes and renewed concerns about a broader regional conflict involving Iran.
Investors remain particularly focused on the security of energy supplies moving through the Strait of Hormuz, one of the world’s most important oil shipping routes.
Any disruption to oil exports from the region could tighten global supplies and drive energy prices even higher.
Although OPEC+ recently agreed to increase production, many analysts believe additional output may not be enough to offset supply risks if geopolitical tensions continue to escalate.
## Rising Energy Costs Raise Inflation Concerns
The sharp increase in oil prices has renewed fears that inflation could accelerate in the coming months.
Higher energy costs affect transportation, manufacturing, logistics, and consumer spending. As businesses face rising expenses, those costs are often passed on to consumers through higher prices.
This creates a difficult challenge for central banks.
If inflation remains elevated because of rising oil prices, policymakers may have little choice but to keep interest rates higher for longer. That scenario is generally supportive for oil but can be negative for gold, especially when bond yields continue to rise.
## Precious Metals Face Broad Selling Pressure
The weakness was not limited to gold.
Silver, platinum, and palladium also moved lower as investors reduced exposure to precious metals. The broader sector has come under pressure from a stronger U.S. dollar and growing expectations of tighter monetary policy.
Market participants are increasingly favouring assets that benefit from higher interest rates while reducing positions in non-yielding commodities.
## What Investors Are Watching Next
Investors are closely monitoring developments on two fronts.
The first is the evolving situation in the Middle East. Any escalation that threatens energy infrastructure or oil shipments could create further volatility across commodity markets.
The second is the outlook for U.S. interest rates. Upcoming inflation reports, Federal Reserve comments, and economic data releases will help determine whether policymakers move closer to another rate increase.
For now, the market narrative is clear. Oil prices are rising on supply concerns, while gold prices are falling as investors prepare for the possibility of higher U.S. interest rates. How these two forces develop over the coming weeks could shape the direction of global markets through the second half of 2026.
## FAQs
### 1.Why are gold prices falling in 2026?
Gold prices are falling because investors expect the U.S. Federal Reserve to keep interest rates higher for longer. Strong economic data and rising Treasury yields have reduced demand for non-yielding assets such as gold.
### 2.Why are oil prices rising?
Oil prices have surged due to escalating tensions in the Middle East and concerns about disruptions to global energy supplies. Traders are particularly watching developments that could affect oil shipments through key routes such as the Strait of Hormuz.
### 3.How do higher interest rates affect gold?
Higher interest rates increase returns on assets such as bonds and savings products. Since gold does not generate income, investors often move money into interest-bearing investments when rates rise.
### 4.Can rising oil prices increase inflation?
Yes. Higher oil prices can raise transportation, manufacturing, and energy costs across the economy. These higher costs are often passed on to consumers, contributing to inflation.
### 5.What should investors watch next?
Investors are closely monitoring Federal Reserve policy decisions, upcoming inflation reports, U.S. economic data, and developments in the Middle East. These factors will likely determine the direction of both gold and oil prices in the coming months.
## Stay Updated on Market Trends
Commodity markets remain highly sensitive to economic data, central bank decisions, and geopolitical developments. As gold, oil, and global currencies react to changing conditions, investors can expect continued volatility in the months ahead.
For the latest updates on financial markets, commodities, inflation, and global economic trends, keep following [Daily Finance](https://df.media/) for daily news and analysis.
**Categories:** Banking
---
### [Stock Market Today — Iran War and Bitcoin Crash Hit Wall Street](https://df.media/iran-war-and-bitcoin-crash-hit-wall-street/)
**Published:** June 4, 2026
**Author:** Jonathan Algreen
**Excerpt:** US stocks slip on June 4 2026 as Iran ceasefire talks stall and Bitcoin crashes below $63K. Dow, S&P 500, Nasdaq futures all lower Thursday.
**Content:**
**Published: Thursday, 4 June 2026**
**Table of Contents**
1. Markets at a Glance — Thursday 4 June 2026
2. Iran Conflict Rattles Investor Confidence
3. Oil Eases After Israel-Lebanon Ceasefire News
4. Bitcoin Crashes Below $63K — What Triggered the Sell-Off
5. Analysts Weigh In — How Low Can Bitcoin Go
6. SpaceX IPO and Broadcom Earnings Add to the Mix
7. What to Watch Thursday — Jobs Data and Earnings
8. Key Takeaways
9. FAQ
---
### Markets at a Glance — Thursday 4 June 2026
US stock futures are under pressure on Thursday, 4 June 2026, as two overlapping crises hit Wall Street simultaneously. A worsening geopolitical standoff between the United States and Iran and a sharp sell-off in cryptocurrency markets led by Bitcoin falling below $63,000 are driving a broad risk-off mood across global markets.
Futures tied to the Dow Jones Industrial Average hovered near the flatline in early Thursday trading. Contracts linked to the S&P 500 fell roughly 0.5%, while Nasdaq 100 futures declined around 0.6%, with technology stocks bearing the steepest losses of the session.
The moves follow a turbulent Wednesday session in which stocks retreated from record highs, oil surged, and a major political rupture emerged in Washington over the handling of the Iran conflict.
---
### Iran Conflict Rattles Investor Confidence
The single biggest driver of Thursday’s market weakness is the Iran war. On Wednesday evening, 3 June 2026, the House of Representatives voted to end the US-Iran war in a direct rebuke to President Trump, reflecting deepening divisions in Washington over the administration’s handling of the conflict.
The vote came after what officials described as the most serious escalation between the two countries since the April ceasefire took effect. During Wednesday’s regular session, stocks had already pulled back from record highs as optimism over a swift Iran deal faded and oil prices rose sharply in response.
While the US and Iran have agreed on a rough framework to extend their truce by two months and reopen the Strait of Hormuz, talks over the final details are dragging on even as strikes continue on both sides. Iran’s foreign minister, quoted by the semi-official Tasnim news agency on Wednesday, stated that no tangible progress had been achieved in negotiations and warned that Iran was prepared to target objectives inside Israel if attacks on Beirut continued.
For markets, the core concern is simple. A prolonged Iran conflict means sustained oil supply disruption, persistent inflation risk, and an extended period of geopolitical uncertainty that historically weighs on equities, consumer sentiment, and global trade.
---
*Global markets are moving fast. Stay ahead of every geopolitical event, rate decision, and price move as it happens.* *👉 Follow Daily Finance News at DF.Media (<https://df.media/>)*
---
### Oil Eases After Israel-Lebanon Ceasefire News
Oil gave back some of its recent gains on Thursday morning after Bloomberg reported that Israel and Lebanon had agreed to a ceasefire. West Texas Intermediate fell toward $95 a barrel, having risen nearly 10% across the three prior sessions. Brent crude settled near $98 on Wednesday before the ceasefire news broke.
The US State Department confirmed that the agreement is contingent on a complete cessation of Hizbollah fire and the evacuation of all Hizbollah operatives from the South Litani Sector.
Despite the headline relief, the broader conflict between Washington and Tehran remains unresolved. Supply concerns are also intensifying independently of the ceasefire. US government data released on Wednesday showed that crude stockpiles at Cushing, Oklahoma, the delivery point for WTI, fell for a sixth consecutive week, approaching what is known as the minimum operating level. When Cushing inventories reach minimum operating levels, spot price volatility historically accelerates sharply.
---
### Bitcoin Crashes Below $63K — What Triggered the Sell-Off
Away from the Iran headlines, cryptocurrency markets are experiencing their own crisis on Thursday, 4 June 2026. Bitcoin has fallen below $63,000, declining more than 8% over the past 24 hours and hitting its lowest level in months.
The sell-off was triggered earlier this week when digital asset treasury giant Strategy, formerly known as MicroStrategy and trading under the ticker MSTR, revealed it had sold 32 bitcoins. That sale marked Strategy’s first Bitcoin disposal since December 2022. Although the sale represented just a fraction of Strategy’s total holdings, the move rattled markets sharply. It represented a clear departure from the company’s long-standing aggressive buy-and-hold approach that has been a pillar of institutional Bitcoin confidence since 2020.
Strategy shares tumbled over 7% on Wednesday and extended those losses in overnight trading on Thursday. The sell-off triggered a wave of ETF outflows, which in turn added additional selling pressure across the broader crypto market. Speculation around Mt. Gox liquidations, reported by CoinDesk on Thursday, added further fuel to the decline.
---
### Analysts Weigh In — How Low Can Bitcoin Go
Market analysts are divided on where Bitcoin goes from here, but the directional concern is clear across the board.
Trade Nation senior market analyst David Morrison flagged $65,000 as a critical support level for Bitcoin on Thursday. Morrison warned that a sustained break below that threshold would raise the likelihood of the token testing its February 2026 low of $60,000. Bitcoin is currently trading below that level, meaning the February floor is now the next major line of defence.
Compass Point analyst Ed Engel offered a more constructive longer-term read. Engel noted that 26% of Bitcoin sales over the past 30 days had come from investors who originally bought the token above $90,000. “This cohort of top-buyers had been resilient throughout the bear market; however, they are finally capitulating as BTC approaches new cycle lows,” Engel said in a note published Thursday. He added that the trend made him more confident that Bitcoin’s bear market is in its late stages.
Paul Howard, senior director at liquidity provider Wincent, told CoinDesk on Thursday that some analysts were beginning to discuss $50,000 as a potential bottom for the year. Peter Schiff, CEO of Euro Pacific Capital, issued a stark warning on X on Thursday morning, stating that Ethereum and Solana appeared in worse technical shape than Bitcoin and that selling, while orderly so far, looked likely to turn into panic.
Wall Street moved quickly to revise its outlook on Strategy. Canaccord analyst Joseph Vafi lowered his price target by more than 27%, from $224 to $163, while maintaining a Buy rating. Mizuho similarly cut its target from $320 to $265, maintaining an Outperform rating, while describing the current environment as a persisting crypto winter.
For deeper context on where crypto markets stand heading into this sell-off, read our full breakdown of [the SpaceX IPO and what it means for digital asset markets in 2026](https://df.media/spacex-ipo-2026-record-75b-offering-hits-markets/).
---
*Wall Street does not wait. Stay ahead of every market move, earnings surprise, and macro event that matters to your portfolio.* *👉 Track Market Moves at DF.Media (<https://df.media/>)*
---
### SpaceX IPO and Broadcom Earnings Add to the Mix
Thursday’s session is not short of market-moving stories beyond Iran and Bitcoin. SpaceX confirmed in a new regulatory filing this week that it plans to raise $75 billion in an initial public offering that would be the largest in history. The company is targeting a $1.75 trillion valuation and a Nasdaq debut under the ticker SPCX around June 12, 2026. The roadshow formally begins Thursday, June 4.
Semiconductor giant Broadcom, trading under the ticker AVGO, also weighed on sentiment Thursday after its latest earnings release disappointed investors. The company’s projected AI chip sales fell short of market expectations, sending shares lower in pre-market trading and adding a sector-specific headwind for the Nasdaq.
---
### What to Watch Thursday — Jobs Data and Earnings
Thursday’s session brings two additional readings on the US labour market ahead of Friday’s May jobs report. Weekly jobless claims from the Bureau of Labor Statistics and layoff data from outplacement firm Challenger, Gray and Christmas are both due before the opening bell on Thursday, 4 June 2026.
On the corporate earnings front, three notable companies are reporting results Thursday. Ciena Corporation, trading as CIEN, reports its latest quarterly numbers. Lululemon Athletica and DocuSign round out the earnings calendar for the session.
The May jobs report on Friday will be the week’s defining macro event. Any significant miss or beat on payrolls will reshape expectations for Federal Reserve policy heading into the second half of 2026, in an environment already complicated by oil price volatility and geopolitical risk.
---
### Key Takeaways
US stock futures are lower on Thursday, 4 June 2026, with the S&P 500 down 0.5% and the Nasdaq 100 off 0.6% as Iran ceasefire talks stall and Bitcoin crashes below $63,000. The House of Representatives voted on Wednesday evening to end the US-Iran war in a rebuke to President Trump. Oil eased toward $95 a barrel after Israel and Lebanon agreed to a ceasefire, but supply concerns remain acute with Cushing stockpiles at near-minimum operating levels. Bitcoin fell more than 8% in 24 hours after Strategy sold 32 bitcoins, its first sale since December 2022. Analysts at Compass Point believe the Bitcoin bear market is in its late stages, while some are beginning to discuss $50,000 as a potential floor. SpaceX begins its formal IPO roadshow Thursday targeting a $75 billion raise and Broadcom disappointed on AI chip sales. Weekly jobless claims and earnings from Ciena, Lululemon, and DocuSign are all due Thursday ahead of Friday’s critical May jobs report.
---
### FAQ
**Q: Why are US stock futures falling on Thursday 4 June 2026?** A: US stock futures are slipping on Thursday as doubts grow over the US administration’s ability to secure a ceasefire extension with Iran. The House of Representatives voted on Wednesday evening to end the war, reflecting deepening political divisions in Washington. At the same time, Bitcoin has crashed below $63,000, adding to the risk-off mood. (Source: Yahoo Finance, Reuters, June 4, 2026.)
**Q: Why has Bitcoin dropped below $63,000?** A: Bitcoin fell below $63,000 after digital asset treasury firm Strategy revealed it sold 32 bitcoins, its first sale since December 2022. The move triggered ETF outflows and broader crypto selling, with speculation around Mt. Gox liquidations adding further pressure. Bitcoin has declined more than 8% in the past 24 hours. (Source: CoinDesk, Yahoo Finance, June 4, 2026.)
**Q: How low could Bitcoin go?** A: Trade Nation analyst David Morrison is watching $60,000 as the next major support level following the break below $65,000. Some analysts, including Paul Howard at Wincent, have begun discussing $50,000 as a potential floor for the year. Compass Point’s Ed Engel believes the bear market is in its late stages based on capitulation patterns among top buyers. (Source: CoinDesk, Trade Nation, June 4, 2026.)
**Q: What happened to oil prices on 4 June 2026?** A: Oil eased on Thursday after Israel and Lebanon agreed to a ceasefire, with WTI falling toward $95 a barrel after a near 10% rise in the prior three sessions. However, crude stockpiles at Cushing, Oklahoma, fell for a sixth consecutive week to near minimum operating levels, keeping supply concerns elevated. (Source: Bloomberg, US EIA, June 4, 2026.)
**Q: What is the SpaceX IPO date?** A: SpaceX confirmed it plans to raise $75 billion in the largest IPO in history. The formal investor roadshow begins June 4, 2026, with final pricing targeted for June 11 and a Nasdaq debut under the ticker SPCX expected around June 12, 2026. (Source: Reuters, Bloomberg, June 2026.)
**Q: What earnings are due Thursday 4 June 2026?** A: Ciena Corporation, lululemon athletica, and DocuSign are all reporting earnings on Thursday. Weekly jobless claims and Challenger layoff data are also due before the opening bell, ahead of Friday’s May jobs report. (Source: Yahoo Finance, June 4, 2026.)
---
*This article is for informational purposes only and does not constitute financial advice. Always conduct your own research before making any investment decisions.*
---
**Sources:** Yahoo Finance, June 4, 2026 — Futures data and Iran market impact Bloomberg, June 4, 2026 — Israel-Lebanon ceasefire and oil prices Reuters, June 3, 2026 — SpaceX IPO confirmation CoinDesk, June 4, 2026 — Bitcoin sell-off, Strategy sale, Mt. Gox speculation Trade Nation / David Morrison, June 4, 2026 — Bitcoin $65K support level Compass Point / Ed Engel, June 4, 2026 — Bitcoin bear market late stages Wincent / Paul Howard, June 4, 2026 — $50K floor discussion Canaccord / Joseph Vafi, June 4, 2026 — Strategy price target cut $224 to $163 Mizuho, June 4, 2026 — Strategy price target cut $320 to $265 Tasnim News Agency, June 3, 2026 — Iran foreign minister statement US EIA, June 3, 2026 — Cushing crude stockpile data
**Categories:** Bitcoin (BTC), Finance
---
### [SpaceX IPO 2026 — Record $75 Billion Offering Hits Markets](https://df.media/spacex-ipo-2026-record-75b-offering-hits-markets/)
**Published:** June 3, 2026
**Author:** Jonathan Algreen
**Content:**
**Table of Contents**
1. What Is the SpaceX IPO
2. The $135 Share Price and What It Means
3. SpaceX Financials — Revenue, Losses, and Starlink
4. The xAI Factor — Fuel or Fire Risk
5. What Investors and Traders Need to Know
6. What Comes Next — Roadshow, Pricing, and Debut
7. Key Takeaways
8. FAQ
---
### What Is the SpaceX IPO
The [SpaceX IPO 2026](https://www.reuters.com/legal/transactional/spacex-targets-175-trillion-valuation-including-greenshoe-option-record-ipo-2026-06-02/) is the most anticipated public offering in a generation. Elon Musk’s rocket launch, satellite communications, and artificial intelligence company plans to sell 555.6 million shares at $135 each, raising $75 billion in what would become the largest initial public offering in history, according to Reuters on June 3, 2026.
The deal targets a valuation of $1.75 trillion. If achieved, it would more than double the previous IPO record held by Saudi Aramco, which raised $29.4 billion in 2019. The company will list on the Nasdaq exchange under the ticker symbol SPCX.
SpaceX, known formally as Space Exploration Technologies Corp., filed its S-1 prospectus publicly in May 2026 after confidentially filing with the SEC in March. The offering is being led by Goldman Sachs, Morgan Stanley, Bank of America, Citigroup, JPMorgan Chase, and 18 additional underwriting banks.
---
### The $135 Share Price and What It Means
Setting a fixed price before a roadshow is highly unusual in modern IPO practice. Companies typically announce a price range to gauge investor interest during presentations, then set a final price the day before trading begins. SpaceX has broken that convention entirely.
The decision to fix the price at $135 per share ahead of its formal marketing period signals confidence from Musk and his banking syndicate. It also reflects the extraordinary nature of this offering. There is no price discovery because, for SpaceX, the demand narrative precedes the numbers.
Global markets are watching closely. Reuters reported that SpaceX is considering allocating as much as 30% of the offering to retail investors, an unusually large retail tranche designed to tap into Musk’s enormous individual following. Shares will be available to retail investors through Robinhood ahead of the Nasdaq debut.
---
*Global markets are moving. Finance decisions get made on real-time data, not yesterday’s headlines.* *👉 Follow Daily Finance News at DF.Media (<https://df.media/>)*
---
### SpaceX Financials — Revenue, Losses, and Starlink
SpaceX generated $18.67 billion in revenue in 2025, up 43% year over year from $13.1 billion in 2024, according to Sacra research published in April 2026. Despite that growth, the company recorded a GAAP net loss of $4.94 billion in 2025, a sharp reversal from a profit of $791 million in 2024.
The loss is driven primarily by xAI-related capital expenditure. Out of nearly $21 billion in total capex spending in 2025, $12.7 billion went toward building out data centers for xAI, more than the company spent on rockets or satellites combined, according to ProfG Media analysis published May 2026.
Starlink remains the only consistently profitable segment. The satellite internet division generated $11.4 billion in revenue in 2025, representing 61% of total company sales, according to The Information. Starlink’s operating profit stood at $4.4 billion in 2025 on an adjusted EBITDA margin of approximately 63%. Subscriber growth has been equally impressive, with active users surpassing 10 million across 160 countries by February 2026, per SpaceX’s own reporting.
There is one headwind inside the Starlink numbers. Average revenue per user fell from approximately $99 per month in 2023 to around $66 per month in the first quarter of 2026, a compression of 33%, driven by cheaper international pricing tiers, according to Morningstar analysis published June 3, 2026.
At the targeted IPO price, SpaceX would trade at a trailing price-to-revenue multiple of approximately 93.7 times its 2025 revenue. For context, Palantir Technologies trades at around 81 times revenue, while Tesla trades at approximately 17 times, according to Reuters data.
---
### The xAI Factor — Fuel or Fire Risk
In February 2026, SpaceX completed an all-stock acquisition of xAI, Elon Musk’s artificial intelligence startup and developer of the Grok chatbot. The deal valued SpaceX at $1 trillion and xAI at approximately $250 billion at the time of the transaction, per Bloomberg reporting.
xAI brought substantial compute infrastructure, including the Colossus data center, but it also brought substantial losses. xAI posted $6 billion in losses in 2025 and is projected to burn an additional $10 billion through 2026, according to BitMEX research published June 2026.
Morningstar equity analyst Nicolas Owens placed SpaceX’s fair value at $780 billion in a June 1, 2026 research note, less than half the IPO ask of $1.75 trillion. Owens specifically flagged xAI as posing a “material threat of value destruction,” noting that its competitive position against OpenAI and Anthropic leaves its economic moat indeterminate.
The bull case rests on a different thesis. SpaceX envisions a future in which AI workloads are processed inside orbital data centers powered by Starlink’s satellite backbone. Wedbush analysts refer to this as the “orbital intelligence” narrative. If that vision materializes, the 94x revenue multiple becomes a bet on an entirely new category of computing infrastructure.
---
### What Investors and Traders Need to Know
SpaceX cannot be valued on a price-to-earnings basis because it reported a net loss in 2025. The cumulative GAAP deficit stands at $41.3 billion, a scale unprecedented among large IPOs, according to TradingKey analysis published June 2026.
The offering is all-primary, meaning all $75 billion in proceeds flow directly to the company rather than to existing shareholders. A 15% greenshoe option could push the total raise above $75 billion if demand warrants, according to Gotrade reporting.
Government revenue remains a critical line item. SpaceX generated $5.9 billion from US government contracts in 2025, including NASA, the Department of Defense, and intelligence agencies. Any shift in federal contracting priorities represents direct revenue risk, as detailed in the company’s S-1 filing.
“From a valuation perspective, it’s definitely not cheap,” said Fabien Yip, market analyst at IG International. “Investors are buying into hopes of the company’s exponential growth in the future given it’s not yet profitable.”
Vey-Sern Ling, managing director at Union Bancaire Privee, added: “It may be a stretch to achieve the valuation they want even with very generous multiples. But the current environment is supportive of all things tech-related and the market has always given Elon Musk the benefit of the doubt.”
---
*Wall Street does not wait. Stay ahead of every IPO launch, market move, and rate decision that matters to your portfolio.* *👉 Track Market Moves at DF.Media (<https://df.media/>)*
---
### What Comes Next — Roadshow, Pricing, and Debut
The formal investor roadshow begins June 4, 2026, with SpaceX executives meeting institutional investors across major financial centers. Final pricing is targeted for June 11, though Bloomberg noted the timeline could shift by a matter of days. Nasdaq debut under the ticker SPCX is expected on or around June 12, 2026.
The SpaceX listing is expected to trigger a broader wave of mega-cap technology IPOs. OpenAI and Anthropic are both reportedly advancing their own public offering plans. Alphabet revealed plans for an $80 billion equity offering on June 2, 2026. Together, SpaceX, OpenAI, and Anthropic are projected to add nearly $4 trillion in market capitalization to public markets, intensifying competition for institutional investor allocations, according to Reuters.
Starship Flight 12 is also scheduled for June 2026. Any successful heavy-lift mission would add momentum to the IPO narrative at a critical moment in the marketing cycle.
---
### Key Takeaways
SpaceX is targeting a $75 billion IPO at $135 per share, which would make it the largest public offering in history, more than doubling Saudi Aramco’s $29.4 billion record from 2019. The company is seeking a $1.75 trillion valuation at 93.7 times its 2025 revenue of $18.67 billion. Starlink, the satellite internet division, is the only profitable segment, generating $11.4 billion in revenue and $4.4 billion in operating profit in 2025. xAI, folded into SpaceX in February 2026, is projected to burn $10 billion in 2026 and has driven the company to a $4.94 billion GAAP net loss. Morningstar has placed fair value at $780 billion, 55% below the IPO ask, citing execution risk and xAI’s uncertain competitive moat. The roadshow begins June 4, pricing targets June 11, and the SPCX Nasdaq debut is expected on or around June 12, 2026.
---
### FAQ
**Q: What is the SpaceX IPO price per share?** A: SpaceX has set a fixed price of $135 per share for its initial public offering. The company plans to sell 555.6 million shares, raising $75 billion in total proceeds. This fixed pricing approach is highly unusual and breaks with standard IPO practice, where a price range is typically announced ahead of roadshows. (Source: Reuters, June 3, 2026.)
**Q: What is SpaceX’s IPO valuation in 2026?** A: SpaceX is targeting a valuation of $1.75 trillion at its IPO price of $135 per share. At that level, the company would trade at approximately 93.7 times its 2025 revenue of $18.67 billion. Morningstar has set a more conservative fair value estimate of $780 billion, anchored primarily to its Starlink and launch businesses. (Source: Morningstar, June 1, 2026.)
**Q: When does SpaceX SPCX start trading on Nasdaq?** A: SpaceX is expected to begin trading on the Nasdaq exchange under the ticker symbol SPCX on or around June 12, 2026. Final pricing is scheduled for June 11, following a formal investor roadshow that begins June 4, 2026. The timeline could shift by a few days depending on demand. (Source: Bloomberg, June 3, 2026.)
**Q: Is SpaceX profitable?** A: SpaceX is not profitable on a GAAP basis. The company reported a net loss of $4.94 billion in 2025, driven primarily by $12.7 billion in capital expenditure on xAI data centers. On an adjusted EBITDA basis, SpaceX posted $6.6 billion in 2025. Starlink, its satellite internet division, is the only segment generating consistent GAAP operating profit. (Source: S-1 filing via Sacra, April 2026.)
**Q: What does SpaceX plan to do with IPO proceeds?** A: SpaceX intends to use the $75 billion in proceeds to expand AI computing resources and its Starlink satellite network, according to its S-1 filing. The offering is entirely primary, meaning all proceeds flow to the company rather than to existing shareholders. A 15% greenshoe option could raise the total above $75 billion. (Source: Reuters, June 3, 2026.)
**Q: How does the SpaceX IPO compare to Saudi Aramco?** A: The SpaceX IPO would be the largest public offering in history at $75 billion, more than doubling the previous record of $29.4 billion set by Saudi Aramco in 2019. Unlike Aramco, which was profitable at the time of its listing, SpaceX is currently posting GAAP net losses while pursuing a long-term growth strategy in AI and space infrastructure. (Source: Reuters, June 3, 2026.)
*“Before you decide whether to buy in, make sure you have read the* ***[7 Shocking Facts About SPCX You Must Know](https://df.media/spacex-ipo-7-shocking-facts-you-must-know-about-spcx/)*** *— including the numbers most mainstream coverage is not highlighting.”*
---
*This article is for informational purposes only and does not constitute financial advice. Always conduct your own research before making any investment decisions.*
**Categories:** Banking
---
### [Former Fed Chair Warns Political Pressure Could Threaten Federal Reserve Independence](https://df.media/former-fed-chair-warns-of-political-pressure/)
**Published:** June 1, 2026
**Author:** Laura Anderson
**Content:**
A former Federal Reserve chair has warned that growing political pressure on the U.S. central bank could undermine **Federal Reserve Independence** and weaken public confidence in one of the nation’s most important financial institutions. The comments have reignited discussions about the relationship between politics, monetary policy, and economic stability.
The former Fed leader stated that the U.S. central bank is currently facing a significant political “stress test” as policymakers and political leaders continue debating interest rate decisions and economic priorities. According to the former chair, institutions that take decades to build can lose public trust much faster if their independence is questioned.
## Why Federal Reserve Independence Matters
**Federal Reserve Independence** allows policymakers to make decisions based on economic data rather than political interests. Economists widely believe that an independent central bank helps control inflation, support employment, and maintain long-term financial stability.
When governments exert excessive influence over monetary policy, investors may become concerned that interest-rate decisions are being driven by short-term political goals rather than economic fundamentals. This can affect market confidence, investment decisions, and overall economic growth.
## Political Pressure and the U.S. Central Bank
The warning comes amid continued debate over **Trump Federal Reserve Pressure** and the broader role of elected officials in influencing monetary policy. Critics argue that political involvement could make it harder for the central bank to act independently during periods of economic uncertainty.
The former Fed chair emphasized that public trust remains one of the institution’s most valuable assets. Once confidence in the central bank’s decision-making process is weakened, restoring that trust can be difficult.
## Impact on Interest Rates and Financial Markets
The discussion surrounding **US Interest Rate Policy** is particularly important for investors. Interest-rate decisions influence borrowing costs, mortgage rates, business investment, and stock market performance.
Financial markets generally prefer a predictable and independent Federal Reserve because it provides stability and transparency. Any perception of increased political interference can create uncertainty among investors and businesses.
## What Investors Should Watch
Investors should closely monitor developments related to **Federal Reserve Political Pressure**, future interest-rate decisions, inflation trends, and economic growth forecasts. The balance between political oversight and central bank independence will remain a key topic for financial markets throughout 2026.
## Key Takeaway
The latest **US Central Bank News** highlights growing concerns about maintaining Federal Reserve independence in an increasingly political environment. Financial experts continue to view an independent central bank as a cornerstone of economic stability, investor confidence, and effective monetary policy.
### CTA
**Stay ahead of the markets with Daily Finance.** Get the latest insights on Federal Reserve policy, interest rates, stock markets, business news, and global economic trends that matter to investors and professionals worldwide.
**Categories:** Banking, Finance, Global News
**Tags:** Fed
---
### [US Markets Hit Record Highs as PCE Inflation Cools While Trade Policy Looms](https://df.media/us-markets-hit-record-highs-as-pce-inflation-cools-in-2026/)
**Published:** May 29, 2026
**Author:** Vishnu Priya
**Content:**
---
May is ending the way bulls dreamed it would. The S&P 500 and Nasdaq closed at all-time highs today, capping a month that defied the old Wall Street adage of selling in May and walking away. The catalyst was a cooler-than-expected PCE inflation reading, but the story underneath the surface is far more layered than a single data point.
For American investors, today is a moment of cautious celebration. The numbers look good. The forward risks, however, are very real.
---
**What the PCE Data Actually Means**
The Commerce Department released April PCE data this morning and the market responded immediately. Core PCE, which is the Federal Reserve’s preferred inflation gauge, rose just 0.2 percent month over month. Economists had penciled in 0.5 percent. That gap matters enormously.
For months, the Fed has been waiting for consistent evidence that inflation is retreating without the economy falling apart. Today’s print gives them exactly that. Inflation-adjusted consumer spending also ticked up 0.1 percent, meaning Americans are still spending, just more carefully. That is the soft landing scenario the Fed has been engineering for the better part of two years.
Rate cut expectations for Q3 2026 have surged following the release. Markets are now pricing in a meaningful probability of at least one cut before September. That optimism drove tech names, AI infrastructure plays, and growth stocks sharply higher through the session.
Snowflake surged over 36 percent following its earnings report. Chipmakers extended their gains. Dell Technologies, which reported a massive earnings beat earlier this week citing insatiable demand for AI-driven data center hardware, has already set the tone for what this earnings season looks like under the hood.
---
**The Tariff Shadow Over the Rally**
Here is where the picture gets complicated.
The Trump administration has outlined a 10 percent universal tariff on non-essential imports. Transition teams are framing it as a negotiating baseline rather than a finalized policy, but markets are not waiting for legal clarity before pricing in the risk. The US Court of International Trade has already scrutinized the legality of such broad levies, and the outcome of that challenge will matter enormously for import-dependent industries.
In the meantime, the effects are already showing up in behavior. Manufacturing firms and major retailers are pulling inventory forward, accepting near-term logistics costs to avoid the potential sting of paying more on imported goods later. Supply chain managers across electronics, apparel, and consumer goods are running contingency models that did not exist six months ago.
The most visible financial symptom of this dynamic is in the bond market. Despite today’s cooling inflation print, the 10-year Treasury yield ticked higher rather than lower. Bond traders are essentially saying that whatever the Fed does in the short term, the long-term inflation story still has a protectionist wildcard sitting in the middle of it. That is an unusual and important signal.
---
**The Dollar, the Euro, and a Widening Gap**
Across the Atlantic, the European Central Bank is moving in a different direction entirely.
ECB officials have signaled clearly that they are prepared to cut rates faster than the Federal Reserve, citing stagnant growth across the Eurozone as the primary concern. Germany is not recovering the way Brussels hoped. Southern European economies remain fragile. The ECB’s priority is growth. The Fed’s priority is still finishing the inflation fight.
That divergence has pushed the US Dollar to a six-month high against the Euro. For American multinationals, a strong dollar compresses overseas revenues when they are converted back home. For US importers, it provides a partial offset against rising tariff costs. For Forex traders, it is creating one of the most volatile EUR/USD environments in recent memory.
The Swiss Franc and Japanese Yen are also seeing unusual positioning as traders hedge against the uncertainty of what a sustained Fed-ECB split looks like into the second half of 2026.
---
**Crypto Grows Up Quietly**
While equity markets dominated the headlines today, two developments in the digital asset space are worth paying serious attention to, particularly for institutional investors who have been watching from the sidelines.
Coinbase unveiled new API integrations specifically designed for institutional custody clients. This is not about making it easier for retail traders to buy Bitcoin. This is about giving large financial institutions, asset managers, and corporate treasuries the infrastructure they need to hold and move digital assets within a compliant, auditable framework. Volume on the institutional side of the platform spiked immediately following the announcement. Coinbase is clearly transitioning its identity from consumer exchange to enterprise financial infrastructure.
Simultaneously, Concordium deployed its Protocol 10 mainnet update. The headline feature is sponsored transactions, which allows companies to pay transaction fees on behalf of their customers or users. That single change removes one of the most persistent friction points in enterprise blockchain adoption. When a company can absorb the gas cost for its users, the experience becomes seamless in a way that makes real commercial adoption viable. The update also deepens the privacy and compliance tools that have made Concordium a serious option for financial services firms operating under strict regulatory frameworks.
Taken together, these two developments reinforce a clear trend. Institutional crypto is no longer a speculative narrative. It is balance sheet infrastructure.
---
**Energy and Commodities Stay Stable**
The one area of the market offering genuine calm today is energy.
Brent Crude held steady around 93 dollars per barrel following the latest OPEC+ meeting, where members confirmed that production quotas will remain largely unchanged for the upcoming quarter. With the geopolitical risk premium from Middle East tensions having already declined sharply over recent sessions, oil is finding a floor rather than testing new extremes in either direction.
Gold retreated slightly as the strengthening dollar made the metal less attractive to foreign buyers. Safe-haven demand is still present, but it is competing against a dollar that is pulling capital back toward US-denominated assets.
Agricultural commodities remain a watch item. Weather patterns in South America are disrupting crop yields, pushing soybean and wheat futures higher in ways that could eventually show up in food cost inflation data later in the summer.
---
**What This Means Heading Into June**
The overall picture for the US investor as May closes is one of unusual duality. Domestically, the fundamentals are as strong as they have been in years. AI-driven corporate earnings are beating expectations. Inflation is cooling toward target. The labor market remains resilient.
Externally, the risks are real and growing. A 10 percent tariff framework, regardless of its legal fate, has already changed the calculus for global supply chains. A stronger dollar is creating headwinds for international revenue. Central bank divergence between the Fed and ECB is injecting volatility into Forex markets that has not been present at this level in years.
The investor strategy for Q3 2026 is not complicated to articulate, even if it is complex to execute. Lean into domestic cash flow strength. AI infrastructure, enterprise software, and data center plays remain the engine of US equity performance. Hedge against currency volatility, particularly if you hold European exposure. Watch the yield curve because it is telling you something the headline equity numbers are not. And take the institutional crypto build-out seriously, because the money moving into that space is not chasing price, it is building plumbing.
May ends on a high. June opens with questions that will take the whole summer to answer.
**Categories:** Banking
---
### [SK Hynix Hits $1 Trillion Market Cap as AI Chip Demand Sends Memory Stocks Surging](https://df.media/sk-hynix-hits-1-trillion/)
**Published:** May 27, 2026
**Author:** Laura Anderson
**Excerpt:** SK Hynix hits $1 trillion as AI chip demand drives memory prices up 63%. KOSPI hits record high on chipmaker rally
**Content:**
---
South Korea’s SK Hynix hit a market valuation above $1 trillion for the first time on Wednesday, joining Samsung Electronics and Micron Technology in the exclusive club of memory chipmakers riding the AI hardware boom.
Shares of SK Hynix surged nearly 15% in a single session, pushing its market cap to a record 1,680 trillion won, roughly $1.12 trillion. The rally helped lift South Korea’s KOSPI index to an all-time high of 8,457, a 5% single-day gain that triggered a temporary algorithmic trading halt.
**Three Chipmakers, One Catalyst**
The trigger is straightforward: AI infrastructure spending is driving unprecedented demand for high-bandwidth memory chips. Nvidia’s AI accelerators require large volumes of advanced memory, and only three companies in the world can supply them at scale. SK Hynix, Samsung, and Micron now control that bottleneck.
Get More Info on –[Click Here](https://economictimes.indiatimes.com/markets/us-stocks/news/global-market-update-sk-hynix-joins-1-trillion-club-after-samsung-micron-on-ai-chip-boom/articleshow/131341131.cms?from=md)
Memory chip prices doubled in the first quarter of 2026 compared to the prior period. Analysts forecast a further climb of up to 63% in the current quarter as data centre buildouts continue to squeeze supply for consumer devices including smartphones, laptops, and automobiles.
Samsung crossed the $1 trillion threshold on May 6. Micron hit the milestone just one day before SK Hynix. The milestone makes South Korea the first country outside the United States to have more than one company in the trillion-dollar club, alongside Taiwan’s TSMC.
**Analyst Targets Revised Sharply Higher**
Mirae Asset Securities analyst Kim Young-gun raised price targets for both Korean chipmakers this week, citing expectations that memory chip demand will continue to outpace supply through at least 2028. SK Hynix received an 18.8% target increase to 3.8 million won per share. Samsung’s target was lifted 14.6% to 550,000 won.
UBS went further on Micron, more than tripling its price target, attributing the move to structural changes AI has driven across the entire memory segment.
Year-to-date, the gains have been substantial. Micron shares are up 245%. SK Hynix is up 215%. Samsung has risen 149%. The KOSPI itself has surged 91% in 2026, after posting a 76% gain in 2025, making it the top-performing major index globally across this period.
**Retail Investor Momentum**
US retail investors have poured billions into new ETFs providing exposure to Samsung and SK Hynix in recent weeks. South Korea launched its first single-stock leveraged ETFs tied to both chipmakers on Wednesday. The products posted double-digit gains on debut. Demand was strong enough to crash the Korea Financial Investment Association’s website, which hosts the mandatory courses retail investors must complete before purchasing leveraged ETFs.
A union wage agreement at Samsung also removed a near-term risk. Workers voted to approve a tentative deal, averting a strike that had raised concerns about disruption to global chip supply chains.
**What It Means for Markets**
With Samsung and SK Hynix now accounting for roughly half of the KOSPI by market cap, South Korea’s equity index has effectively become a proxy for the global AI infrastructure trade. Investors looking for exposure to AI hardware beyond US-listed names now have a concentrated, liquid route through Korean chip equities.
The supply-demand math remains in favour of the chipmakers for the foreseeable future. Until AI data centre expansion slows or new memory capacity comes online at scale, the pricing environment for high-end memory stays tight
For daily coverage of global stock market moves, commodities, and macroeconomic trends, visit [Daily Finance](https://df.media/)
**Categories:** Banking
---
### [SpaceX IPO: 7 Shocking Facts You Must Know About the $2 Trillion SPCX Listing in 2026](https://df.media/spacex-ipo-7-shocking-facts-you-must-know-about-spcx/)
**Published:** May 22, 2026
**Author:** Laura Anderson
**Excerpt:** SpaceX IPO targets a $2 trillion valuation under SPCX on Nasdaq. Discover 7 shocking facts about Elon Musk's historic $80B public listing in 2026.
**Content:**
The SpaceX IPO is no longer a rumour circulating in venture capital circles. It is happening. And the details buried inside the 270-page SEC prospectus reveal a company that has quietly reinvented itself into something Wall Street has genuinely never seen before.
Filed on May 20, 2026, the SpaceX IPO prospectus pulls back the curtain on a business that lost $4.27 billion in a single quarter, is spending at the same scale as Amazon Web Services on AI infrastructure, and is simultaneously planning to colonise Mars while listing on the Nasdaq under ticker symbol SPCX.
If that sounds like too much for one filing, it is. But investors are lining up anyway.
Here are seven facts that define the most anticipated public market debut in history.
**Table of Contents**
1. SpaceX IPO Date, Ticker, and What Is Actually Being Offered
2. The $4.27 Billion Loss That Shocked Analysts
3. Why the SpaceX IPO Is Really Three Companies in One
4. Binance Is Already Letting Traders Bet on SPCX Before Listing Day
5. Elon Musk’s Billion-Share Mars Compensation Deal
6. The Red Flags SpaceX Disclosed in Its Own Filing
7. What the SpaceX IPO Actually Means for Public Markets
### 1. SpaceX IPO Date, Ticker, and What Is Actually Being Offered
The SpaceX IPO is targeting a Nasdaq listing on or around June 12, 2026 under ticker symbol SPCX. Goldman Sachs is serving as lead bookrunner on a syndicate of 21 banks that includes Morgan Stanley, Bank of America, Citigroup, and JPMorgan.
The offering is expected to raise between $75 billion and $80 billion, which would make it the largest IPO in recorded stock market history by a significant margin.
SpaceX is targeting a post-listing valuation of $1.75 trillion to $2 trillion. If achieved, the company would rank among the five most valuable businesses on Earth from day one of trading.
The prospectus states that IPO proceeds will be directed toward AI compute infrastructure expansion, Starship vehicle upgrades, satellite constellation scaling, space-based solar energy commercialisation, and long-term Mars colonisation efforts. SpaceX estimates its total addressable market at $28.5 trillion.
### 2. The $4.27 Billion Loss That Shocked Analysts
The SpaceX IPO filing is generating enormous attention for one number above all others: a net loss of $4.27 billion for Q1 2026 alone.
That compares to a net loss of just $528 million in the same quarter the previous year. The bottom line deteriorated by $3.74 billion year over year in a single quarter, which is an extraordinary acceleration in losses for a company asking public markets to value it at nearly $2 trillion.
Total costs and expenses surged to $6.63 billion from $4.04 billion. Research and development spending jumped 125.7 percent to $3.51 billion, making it the single largest cost driver in the quarter.
The SEC filing attributes the spike to $1.47 billion in higher AI segment costs from GPU hardware depreciation, cloud computing, and data centre infrastructure build-out, combined with $404 million in additional Starship development costs.
AI capital expenditure alone reached $7.7 billion in Q1 2026, placing SpaceX in the same infrastructure spending tier as Amazon, Google, and Microsoft.
Revenue did grow. Total revenue for Q1 2026 reached $4.69 billion, up 15.4 percent from $4.06 billion in Q1 2025. For the full year 2025, SpaceX posted $18.7 billion in revenue against a net loss of $4.9 billion. The company holds $15.9 billion in cash and carries $29.1 billion in long-term debt.
### 3. Why the SpaceX IPO Is Really Three Companies in One
#### SpaceX IPO Segment Breakdown: Rockets, Starlink, and xAI
Investors buying SPCX stock on listing day will not simply be buying a rocket company. The SpaceX IPO bundles three structurally distinct businesses into a single public vehicle.
**The Rocket Business**
Launch services remain the foundation of the SpaceX brand. However, Space segment revenue declined slightly in Q1 2026 due to fewer commercial launch missions and shifts in government contract timing. Despite its iconic status, the rocket business is no longer the primary growth engine inside the filing.
**Starlink Satellite Internet**
Starlink is now the company’s most powerful revenue growth driver. The connectivity segment added $782 million in Q1 2026 as the subscriber base continued expanding globally. Analysts increasingly view Starlink as a potential dominant global communications layer, particularly in markets where terrestrial internet infrastructure remains underdeveloped. No comparable publicly traded satellite internet business exists at this scale.
**xAI and AI Infrastructure**
Earlier in 2026, Elon Musk sold his AI startup xAI into SpaceX, making artificial intelligence a formal third segment of the company. xAI operates the Colossus data centres in Tennessee and generated $3.2 billion in revenue in 2025. However, it lost $6.4 billion in the same period, with capital spending running more than three times higher than the rocket business. The AI segment is the largest source of both cost growth and long-term valuation speculation inside the SpaceX IPO.
This three-segment structure means SPCX stock does not fit neatly into any existing investment category. It is simultaneously an aerospace stock, a telecom stock, and an AI infrastructure stock.
### 4. Binance Is Already Letting Traders Bet on SPCX Before Listing Day
One of the most striking developments surrounding the SpaceX IPO has nothing to do with SpaceX directly. It involves Binance.
Binance launched what it describes as the first pre-IPO perpetual futures contract tied to SPCX, allowing retail traders to gain leveraged price exposure to SpaceX before the company officially lists on any public exchange.
The debut numbers were extraordinary. Over $85 million traded within hours of the contract going live. SPCX moved from $197 to $224, representing a 13 percent jump before volatility rapidly reversed the gains.
According to a report by AMBCrypto, Binance co-CEO Richard Teng described the product as a democratisation of IPO access, arguing that pre-IPO pricing has historically been locked behind institutional and private investor allocations. [Read the full AMBCrypto report here.](https://ambcrypto.com/binance-launches-spacex-perpetual-futures-traders-chase-pre-ipo-exposure/)
Hyperliquid has launched similar pre-IPO markets, and prediction platform Polymarket currently assigns roughly a 70 percent probability to SpaceX reaching a $2 trillion valuation after listing.
Retail traders should understand one critical distinction. Trading Binance SpaceX futures is not the same as owning equity in SpaceX. These are synthetic instruments that track expected future valuations. Several companies planning near-term IPOs have already warned publicly that secondary market instruments tied to their stock may be legally void. The leverage involved amplifies both upside exposure and downside risk in ways that traditional stock investing does not.
### 5. Elon Musk’s Billion-Share Mars Compensation Deal
The SpaceX IPO filing contains one of the most unusual executive compensation structures in corporate history.
Musk controls 85 percent of shareholder voting power through Class B super-voting shares, making him effectively impossible to remove as CEO. He would need to vote against himself to be fired.
His compensation package includes a grant of one billion restricted shares, but only if two conditions are simultaneously met. First, SpaceX must achieve a market capitalisation of $7.5 trillion. Second, SpaceX must establish a permanent settlement on Mars with a population of at least one million people.
Mars is mentioned 63 times in the 270-page S-1 filing. The compensation section alone references Mars colonisation as a condition of executive pay, prompting genuine questions from analysts about how one structures financial incentives for a man who is, by any conventional measure, already beyond ordinary wealth.
The filing also disclosed that SpaceX purchased $131 million worth of Tesla Cybertrucks between 2024 and 2025, accounting for roughly six to nine percent of total Cybertruck sales during that period. This immediately raised conflict-of-interest concerns among institutional investors given the overlap between Musk-controlled companies.
### 6. The Red Flags SpaceX Disclosed in Its Own Filing
#### SpaceX IPO Risk Factors That Investors Cannot Ignore
Unlike most IPO filings that minimise risk language, the SpaceX IPO prospectus contains a notably candid section titled “Our Challenges.” What it admits is worth understanding clearly.
SpaceX openly states that multiple technologies central to its long-term business plan either do not exist yet, do not currently work reliably, or may never become commercially viable. This includes AI satellites intended for orbit by 2028, space-based solar energy capture and transmission, a proposed moon economy, and human augmentation systems.
The AI spending trajectory is also flagging concern among analysts who track infrastructure economics. The company spent $7.7 billion on AI capital expenditure in a single quarter. If AI monetisation growth slows or fails to keep pace with infrastructure costs, the financial model faces serious pressure before Starship and Starlink revenues can compensate.
Governance risk is real. The 85 percent voting control Musk retains through super-voting shares is a structure that many institutional investment mandates actively prohibit exposure to. It limits shareholder recourse in ways that standard public company governance does not.
The Tesla Cybertruck disclosure adds a related-party transaction dimension that will require ongoing scrutiny. Investors will need to assess whether capital allocation decisions at SpaceX are being made purely in the interest of SPCX shareholders or in a broader ecosystem of Musk-controlled entities.
### 7. What the SpaceX IPO Actually Means for Public Markets
The SpaceX IPO is not simply a large listing. It represents a structural shift in how public markets are being asked to value technology companies.
There is no comparable publicly traded business. SpaceX simultaneously combines aerospace infrastructure, satellite broadband, AI compute, defense contracting, and speculative future commerce across the moon and Mars into a single ticker. That structural uniqueness is creating what analysts are calling a scarcity premium, a valuation uplift that exists simply because there is nothing else like it available to buy on a public exchange.
The IPO is effectively asking investors to answer one question: do you believe Elon Musk can build the infrastructure layer of the next industrial era before the debt burden becomes unmanageable?
For public markets more broadly, the SpaceX IPO signals that institutional capital is now willing to price companies not on present profitability but on ownership of future infrastructure layers. That is a meaningful shift from the post-2022 rate environment, which punished growth-at-all-costs businesses aggressively.
If the listing succeeds near its target valuation, it may permanently reshape how venture-backed deep-technology companies approach public market debuts and how retail investors think about accessing transformative infrastructure bets.
| Key Metric | Figure |
|---|---|
| SpaceX IPO Target Raise | $75–80 billion |
| Expected Valuation | $1.75T–$2T |
| Q1 2026 Revenue | $4.69 billion |
| Q1 2026 Net Loss | $4.27 billion |
| Full Year 2025 Revenue | $18.7 billion |
| Long-Term Debt | $29.1 billion |
| Cash Reserves | $15.9 billion |
| AI Capex Q1 2026 | $7.7 billion |
| Nasdaq Ticker | SPCX |
| Target Listing Date | June 12, 2026 |
### Frequently Asked Questions About the SpaceX IPO
**When is the SpaceX IPO date?** SpaceX is targeting a Nasdaq listing on or around June 12, 2026.
**What is the SPCX stock ticker?** SpaceX will trade on the Nasdaq exchange under the ticker symbol SPCX.
**How much is SpaceX raising in its IPO?** Reports indicate the company is targeting between $75 billion and $80 billion in the offering.
**What is the SpaceX valuation for the 2026 IPO?** SpaceX is targeting a post-IPO valuation of $1.75 trillion to $2 trillion, with Polymarket traders currently pricing roughly a 70 percent probability of reaching the $2 trillion mark.
**Can retail investors buy SpaceX stock before the IPO?** Not through conventional channels. Binance has launched a pre-IPO perpetual futures contract under SPCX, but this represents synthetic price exposure and not actual equity ownership in SpaceX.
**Who is leading the SpaceX IPO banking syndicate?** Goldman Sachs is the lead left bookrunner on a 21-bank syndicate that includes Morgan Stanley, Bank of America, Citigroup, and JPMorgan.
**Why is SpaceX losing money if it is going public?** The losses are primarily driven by aggressive investment in AI infrastructure through xAI, Starship development, and data centre expansion. SpaceX is spending at hyperscaler levels to build future infrastructure rather than optimising for near-term profitability.
For deeper coverage of the SpaceX IPO, pre-IPO futures markets, and what the SPCX listing means for global investors, read the full Binance perpetual futures breakdown at [AMBCrypto.](https://ambcrypto.com/binance-launches-spacex-perpetual-futures-traders-chase-pre-ipo-exposure/)
Stay ahead of every major market move, IPO filing, and financial news story at [DF Media.](https://df.media/)
*Published: May 22, 2026*
**Categories:** Banking, Capital Markets, Finance, Global News, Investing
---
### [SEC Proposes Sweeping Rule Changes to Bring More Companies to Public Markets](https://df.media/sec-proposes-major-ipo-rule/)
**Published:** May 20, 2026
**Author:** Laura Anderson
**Excerpt:** The SEC wants to raise filer thresholds and ease shelf offering rules to encourage more companies to go public.
**Content:**
The U.S. Securities and Exchange Commission has unveiled a pair of broad regulatory reform proposals aimed at making it easier, faster, and cheaper for companies to go public a move that signals a significant shift in how Wall Street’s top regulator views the balance between investor protection and market participation.
Announced on Tuesday, May 19, the proposals target two key areas: the rules governing how companies register and issue shares, and the thresholds that determine how much financial scrutiny a public company faces. If adopted, the changes could reshape the IPO landscape at a time when public listings have been declining for years.
## **What Is the SEC Actually Proposing?**
The center piece of the first proposal is a major overhaul of the “large accelerated filer” classification. Under current rules, any company with $700 million or more in publicly traded shares known as the public float is automatically classified as a large accelerated filer. This designation comes with strict obligations: tighter deadlines for annual and quarterly filings, and a requirement that independent auditors certify the quality of internal financial controls.
The SEC is now proposing to raise that threshold from $700 million to $2 billion. Even more notably, the proposal would give all newly public companies a five-year grace period before they can ever be classified as large accelerated filers, regardless of how quickly they grow. Companies would also be relieved of certain executive compensation disclosure requirements tied to shareholder advisory votes during this window.
SEC officials confirmed that under the proposed changes, roughly one in five currently listed companies would still meet the large accelerated filer bar — but that group would still represent approximately 90% of total U.S. market capitalization. In other words, the heavyweights stay heavily scrutinized while smaller and newer public companies get room to breathe.
## **Shelf Offerings Get a Makeover**
The second proposal takes aim at shelf offerings — a mechanism that allows companies to pre-register securities with the SEC and then sell them later when market conditions are most favorable. It is a powerful tool for capital-raising flexibility, but currently limited to companies that already have at least $75 million in public float and have been filing with the SEC for at least one year.
The SEC is proposing to eliminate both of those requirements entirely, opening up shelf offerings to a much broader set of companies, including newly public ones. The change would give smaller firms the same tactical flexibility currently reserved for more established players.
There are carve-outs, however. The expanded rules would not apply to foreign private issuers, blank-check companies, penny stock firms, or shell companies categories that regulators say warrant separate scrutiny.
## **The Politics Behind the Proposals**
These proposals don’t exist in a vacuum. They are part of the Trump administration’s broader financial deregulation agenda, and SEC Chair Paul Atkins has been vocal about wanting to create incentives for companies “to go and stay public.” The administration has argued that over-regulation is one reason the number of publicly listed U.S. companies has been shrinking for decades.
Industry groups have largely welcomed the move. The American Securities Association praised the announcement as a step toward revitalizing public markets.
But not everyone is cheering. Better Markets, a watchdog group that advocates for stronger Wall Street oversight, warned that the proposals would increase the risk of corporate misconduct by reducing transparency requirements. The group’s Ben Schiffrin also pointed to a deeper structural issue: public offerings have been declining not because of over-regulation, but because private markets have expanded to the point where companies can raise all the capital they need without ever going public. Loosening IPO rules, critics argue, doesn’t fix that underlying dynamic.
## **What This Means for the Market**
If the proposals are finalized, the practical effects could be significant. More companies particularly mid-sized growth firms that have historically avoided the compliance costs of going public — may find the public markets more attractive. For investors, the influx of new listings could expand the opportunity set but also introduce more companies at earlier, less-scrutinized stages of their development.
The SEC has maintained that the changes will not compromise core investor protections, noting that the companies exempted from stricter requirements represent only a fraction of overall market value.
Both proposals will now enter a public comment period before any final rules can be adopted.
---
## **Frequently Asked Questions**
1.**What is a large accelerated filer?**
A large accelerated filer is a publicly traded company with a public float of $700 million or more. These companies face the strictest SEC reporting timelines and must have independent auditors evaluate their internal financial controls. The SEC is proposing to raise this threshold to $2 billion.
2.**How would the new rules affect newly public companies?**
Under the proposed changes, all companies that go public would automatically receive a five-year grace period before being classified as large accelerated filers, regardless of how large their market value grows. This would ease compliance burdens during their early years as public companies.
3.**What is a shelf offering and why does it matter?**
A shelf offering allows a company to pre-register securities with the SEC and sell them later at a time of its choosing. It gives companies flexibility to raise capital quickly when market conditions are right. Currently, only companies with a $75 million public float and one year of SEC reporting history can use this tool. The SEC wants to remove both requirements.
4.**Will these changes apply to all public companies?**
No. The expanded shelf offering rules, for example, would not apply to foreign private issuers, blank-check companies, penny stock issuers, or shell companies. These categories are considered higher-risk and are being addressed through separate regulatory efforts.
**Are investor protections being weakened?**
The SEC says no, arguing that companies subject to reduced requirements represent a small fraction of total market capitalization. Critics, however, say that lighter disclosure rules reduce transparency and increase the risk of misconduct, particularly for smaller or newer companies.
**Why are IPO numbers declining in the first place?**
The decline in public listings has multiple causes. The growth of private equity and venture capital markets means companies can raise large sums without going public. Regulatory compliance costs have also been cited as a deterrent. The SEC’s proposals address the compliance side, though critics argue the deeper issue the attractiveness of private markets remains unresolved.
**Categories:** Banking
---
### [Global Markets Crash as Oil Prices Surge, Gulf Drone Attacks Escalate, and Bond Yields Spike](https://df.media/global-markets-crash-as-oil-prices-surge/)
**Published:** May 18, 2026
**Author:** Vishnu Priya
**Content:**
## Oil Shock, AI Earnings, and Middle East Tensions Drive Market Volatility
Global financial markets faced renewed turbulence on May 18, 2026, as rising oil prices, Gulf drone attacks, inflation fears, and soaring bond yields triggered a widespread selloff across stocks and increased anxiety among investors worldwide.
European and Asian stock markets moved lower while US futures weakened sharply ahead of a critical week dominated by geopolitical tensions and major technology earnings, especially from NVIDIA.
The market decline follows escalating conflict in the Middle East after the United Arab Emirates confirmed a drone attack on the Barakah nuclear power plant. Saudi Arabia also announced it intercepted three drones entering from Iraqi airspace, intensifying fears that regional instability could expand further across the Gulf.
## Why Are Global Markets Falling Today?
The biggest reason behind today’s financial market volatility is the growing threat to global oil supply chains.
The Strait of Hormuz, one of the world’s most important oil shipping routes, remains heavily disrupted. The route normally carries nearly 20% of global oil and gas trade, but ongoing attacks and shipping restrictions are now creating fears of long-term shortages.
Analysts estimate nearly one billion barrels of oil could become trapped behind the strait if disruptions continue through May.
Oil prices surged again as Brent crude climbed close to $110 per barrel while US crude oil moved above $106. Long-term oil futures also crossed the $100 mark as traders increasingly priced in the possibility of prolonged shortages and a wider regional conflict.
Energy analysts now warn the world may soon experience demand destruction, a situation where oil prices rise so aggressively that consumer spending and economic growth begin slowing significantly.
## Middle East Conflict Raises Global Economic Risks
The geopolitical situation worsened after reports emerged that President Donald Trump is expected to meet national security advisers to discuss possible military options regarding Iran and the broader Gulf conflict.
At the same time, the US government allowed a sanctions waiver on Russian seaborne oil to expire, potentially tightening global energy supplies even further. Countries including India had previously benefited from the waiver to continue importing Russian crude.
These developments are increasing fears surrounding inflation, fuel prices, economic growth, and global supply chain stability. Investors are becoming increasingly cautious as uncertainty spreads across energy and financial markets.
## Bond Yields Surge as Inflation Fears Return
Global bond markets also came under heavy pressure.
US 10-year Treasury yields climbed to 4.63%, their highest level since early 2025, while 30-year bond yields crossed 5.15%. Investors are increasingly worried that inflation could remain elevated for much longer due to energy price shocks and aggressive government spending.
Japan and Germany also saw major increases in government bond yields, adding pressure to global borrowing costs and stock valuations.
Higher bond yields are especially dangerous for technology stocks because they reduce the present value of future corporate earnings, making expensive growth companies harder to justify.
## Nvidia Earnings Become Wall Street’s Biggest Test
The global AI stock rally now faces a major stress test this week as NVIDIA prepares to release earnings.
Analysts expect Nvidia revenue to reach nearly $78.5 billion, representing almost 80% annual growth driven by explosive demand for artificial intelligence infrastructure and data centers.
However, market expectations remain extremely high after Nvidia shares surged dramatically over the past year. Many analysts believe broader corporate earnings growth outside AI and energy sectors remains relatively weak, making the stock market vulnerable if major technology companies disappoint investors.
## China’s Economy Shows Signs of Weakness
China also released disappointing economic data that added to market concerns.
Retail sales rose only 0.2% in April despite forecasts for 2% growth, while industrial production remained sluggish. The weak numbers suggest rising energy costs and global uncertainty are already hurting economic activity in the world’s second-largest economy.
## G7 Finance Ministers Meet Amid Market Chaos
Global finance leaders are gathering in Paris this week for a G7 meeting focused on oil supply disruptions, inflation risks, global trade stability, energy security, bond market volatility, and raw material shortages.
Investors are closely watching whether policymakers can calm markets before volatility spreads further across global economies.
## What Happens Next for Global Markets?
Financial analysts say the next few days could determine the direction of global markets for the rest of 2026.
Investors are now monitoring the possibility of further escalation in the Middle East, rising oil prices above $120 per barrel, continued inflation pressures, weaker global economic growth, Nvidia’s earnings results, and future central bank interest rate decisions.
With oil shocks, geopolitical tensions, AI-driven stock valuations, and bond market instability colliding simultaneously, global markets are entering one of the most uncertain financial periods in recent years.
**Categories:** Banking
---
### [Finance News Today: Tariffs, Bitcoin, and Market Moves — May 15, 2026](https://df.media/tariffs-bitcoin-and-market-moves-may-15-2026/)
**Published:** May 15, 2026
**Author:** Laura Anderson
**Excerpt:** From Trump's new 10% tariff to Bitcoin crossing $81K and the Bank of England holding rates, here's what's moving global markets today.
**Content:**
It has been a busy morning in global markets. Washington dropped a fresh tariff bombshell, Bitcoin hit a milestone, and central banks continued doing what they do best keeping everyone guessing. If you are trying to make sense of what is happening with your money, your portfolio, or just the economy in general, here is everything you need to know.
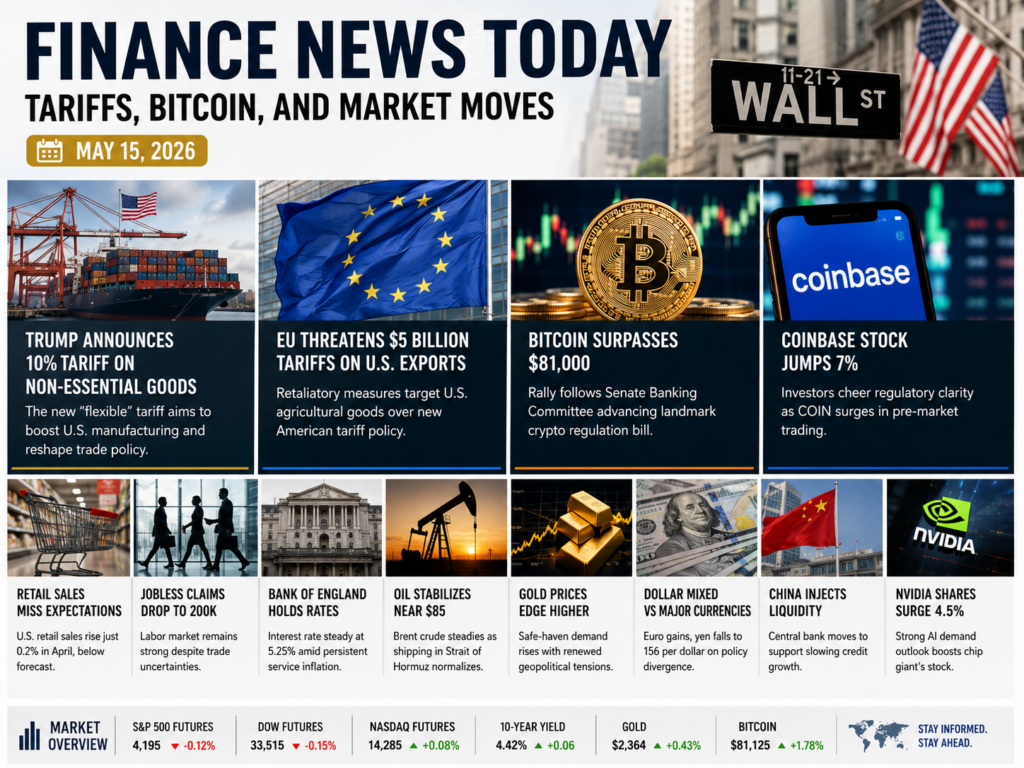## **Washington Just Made Trade Complicated Again**
Let us start where the real action is. The Trump administration announced a new 10% tariff on non-essential manufactured goods from across the globe. The White House called it flexible and temporary. Traders called it something else entirely.
Within hours, the European Union fired back. Brussels is threatening retaliatory tariffs on $5 billion worth of American agricultural goods, arguing the move breaks WTO rules. Germany’s Chancellor got involved too, pushing for a unified European response before next week’s G7 finance ministers meeting. That meeting just got a lot more interesting.
The US and China are still trying to patch things up from years of trade war, but the numbers tell the real story. American tariffs on Chinese goods are still sitting close to 48%. That is not a trade relationship healing at any great speed. And the long-term reshuffling of supply chains is now a fact, not a forecast. Mexico and Canada have officially become America’s top two trading partners, leapfrogging China entirely.
## **Bitcoin Had a Very Good Morning**
Crypto investors woke up to good news. Bitcoin crossed $81,000 after the US Senate Banking Committee pushed forward the Clarity Act, a bill that would hand the CFTC primary regulatory authority over certain digital assets. For a market that has been crying out for regulatory clarity for years, this felt like progress.
Coinbase jumped 7% in pre-market trading. Investors clearly read the committee vote as a sign that the worst of the regulatory uncertainty for crypto platforms may be behind us. Ethereum climbed 2.5% alongside Bitcoin, riding the same wave of optimism.
By mid-session, Bitcoin had slipped back to around $80,481 after running into resistance near $81,500. But the mood in crypto remains positive. One Senate committee vote does not change everything overnight, but it changes the story.
## **The Bank of England Is Still Not Ready to Cut**
Across the Atlantic, the Bank of England kept its key interest rate at 5.25%. The Monetary Policy Committee pointed to stubborn inflation in the services sector as the main reason for holding firm. Anyone hoping for hints of a summer rate cut went home disappointed.
The frustrating part is that the UK housing market showed an unexpected price rebound in April. Consumers are holding up better than a lot of analysts expected. But the central bank is not ready to declare victory on inflation yet, and until it does, borrowing costs are staying where they are.
## **NVIDIA Keeps Climbing**
NVIDIA added another 4.5% today after a major data center client issued strong guidance. At this point, NVIDIA has become the single clearest signal of how serious the corporate world is about building AI infrastructure. When one of its big customers talks up spending, the stock moves. Today it moved up again.
Emerging market equities had a solid session too. India and Brazil both outperformed their global peers, with money flowing into tech and infrastructure plays. It is worth watching. Emerging markets do not always get this kind of attention, and right now they are earning it.
The airline sector was a different story. One major US carrier cut its profit outlook citing high jet fuel costs and the stock dropped 3%. Oil may have stabilized near $85 per barrel today, but it is still high enough to hurt carriers with thin margins.
## **The US Economy is Sending Conflicting Signals**
The labor market data was good. Initial Jobless Claims fell to 200,000, which is historically very low. The American job market is still tight, and that pushed Treasury yields a little higher as bond traders concluded the Fed has less reason to rush any rate cuts.
Then came the retail sales number. Spending rose just 0.2% in April, well below what economists expected. That kind of miss matters because consumer spending is what keeps the US economy moving. One soft month is not a crisis, but two or three in a row would start to raise questions.
Import prices also came in at 1.1% for the month, a touch above forecasts. Some of that is global inflation. Some of it is the effect of existing tariffs. Either way, prices on imported goods are not cooling off as fast as anyone would like.
## **Central Banks Are Running the Show**
China’s central bank injected a significant amount of liquidity into its financial system today in response to slowing credit growth. The goal is simple: keep confidence up and keep the economy moving. Whether it works is a separate question.
Japan is sticking with ultra-loose monetary policy, which is hammering the Yen. It touched 156 per dollar today. Australia’s Reserve Bank hinted it will be cautious about cutting rates for longer than markets expected, and the Australian Dollar fell 0.6% on those comments. The Euro, meanwhile, had a good day after German sentiment data beat expectations, gaining 0.4% against the dollar.
## **Commodities: Crude Steadies, Gold Climbs**
Brent crude settled near $85 per barrel after reports that shipping through the Strait of Hormuz has returned to normal. Supply fears eased. Gold moved in the other direction, ticking higher as investors reached for safety amid the renewed trade tensions between Washington and Brussels.
When tariff headlines start flying again, gold tends to find buyers. Today was no different.
## **What to Watch Next**
The next 48 hours matter. The EU-US tariff standoff could escalate or cool depending on how Washington responds to Brussels. Crypto markets will be watching for any further movement on the Clarity Act. And the Fed will be quietly noting that retail sales missed while the labor market held strong. That is not an easy equation to solve.
**Categories:** Business, Cryptocurrency, Finance, Global News
**Tags:** Finance News Today
---
### [Trump-Xi Summit, AI Stocks, and Rising Inflation Shake Global Markets in 2026](https://df.media/trump-xi-summit-and-ai-stocks-drive-global-markets-in-2026/)
**Published:** May 14, 2026
**Author:** Laura Anderson
**Excerpt:** Global markets rallied on AI enthusiasm as Trump and Xi met in Beijing amid rising inflation, soaring oil prices, and growing geopolitical tensions in 2026.
**Content:**
## Global Markets Rally as Trump Arrives in Beijing
Global financial markets entered a high-stakes phase on Thursday as U.S. President Donald Trump arrived in Beijing for a closely watched summit with Chinese President Xi Jinping.
The meeting comes during one of the most sensitive economic and geopolitical periods in recent years. Investors worldwide are monitoring discussions around trade, artificial intelligence, tariffs, Taiwan, rare earth exports, and the ongoing Iran conflict.
Trump arrived alongside several of America’s biggest technology and business leaders, including Elon Musk and Jensen Huang, signaling how central technology and AI have become in global diplomacy and economic strategy.
Markets across Asia reacted cautiously optimistic, while Wall Street continued its powerful AI-driven rally.
## AI Stocks Continue Dominating Global Markets
Artificial intelligence remained the strongest force driving investor sentiment in 2026. Technology stocks pushed the S&P 500 to another record high as investors continued betting heavily on AI infrastructure, semiconductor manufacturing, and cloud computing expansion.
One of the biggest success stories this year has been SK Hynix, which is now approaching a historic $1 trillion market valuation. The chipmaker’s stock has surged more than 200 percent in 2026 thanks to explosive demand for AI memory chips used in servers and large-scale data centers.
The AI rally also helped Japan’s Nikkei 225 reach another all-time high as Japanese firms benefited from rising global demand for AI-related hardware and infrastructure.
Analysts believe the market is currently being driven by two major themes at the same time: rapid AI growth and rising geopolitical uncertainty.
## Inflation Fears Return to the Spotlight
Despite the optimism surrounding AI stocks, inflation concerns are becoming increasingly difficult for investors to ignore.
New U.S. wholesale inflation data showed producer prices jumped 6 percent year-over-year in April, marking the largest increase since 2022. Consumer inflation also accelerated sharply earlier this week, adding more pressure on policymakers and central banks.
The stronger inflation readings have changed expectations around future Federal Reserve decisions. Many traders now believe the Fed may be forced to consider another interest rate hike if inflation continues rising.
Adding to the uncertainty, Kevin Warsh has officially secured Senate confirmation as the next chair of the Federal Reserve. His leadership will immediately face pressure from rising inflation, higher energy prices, and slowing global stability.
The U.S. dollar strengthened after the inflation reports, while Treasury yields remained elevated as investors adjusted to the possibility of tighter monetary policy.
## Oil Prices Above $100 Raise Global Economic Risks
Energy markets remain one of the biggest threats to global economic stability in 2026.
Brent crude prices stayed above $105 per barrel, while U.S. oil prices traded above $101. The surge comes as disruptions linked to the Iran war continue affecting global oil flows through the Strait of Hormuz.
According to OPEC, oil production has dropped significantly since the conflict intensified earlier this year. The organization also warned that prolonged disruptions could hurt global demand growth and place further pressure on inflation worldwide.
Higher energy costs are already affecting manufacturing, transportation, and consumer prices across major economies.
For investors, this creates a difficult environment where strong AI-driven growth is colliding with rising inflation and geopolitical instability.
## Trump-Xi Talks Could Shape the Global Economy
The summit between Trump and Xi may become one of the defining geopolitical events of 2026.
Markets are hoping both leaders can stabilize trade relations and avoid additional economic restrictions that could damage supply chains and global manufacturing. Investors are also watching for possible agreements involving agriculture, aircraft orders, and technology cooperation.
However, analysts caution that expectations for a major diplomatic breakthrough remain low. Instead, financial markets may simply be hoping the talks prevent tensions from worsening further.
The meeting also arrives during heightened global uncertainty around Taiwan, the Middle East, and strategic AI competition between the United States and China.
For multinational companies and investors, the outcome of the summit could directly impact global trade, semiconductor supply chains, and future technology investment trends.
## Japan’s Defense Industry Gains Global Attention
Another major trend emerging in 2026 is the rapid expansion of Japan’s defense industry.
As global military spending reaches record levels, Japan is easing decades-old restrictions on arms exports, opening the door for significant international growth opportunities.
Defense analysts believe Japanese companies could become major suppliers of air defense systems, armored vehicles, and advanced military technology as countries increase defense spending amid rising geopolitical tensions.
The shift reflects how security concerns are increasingly reshaping global economic priorities alongside AI and energy markets.
## A Market Defined by AI and Geopolitics
The global economy is currently balancing two powerful forces: explosive AI growth and rising geopolitical risk.
Investors remain highly optimistic about artificial intelligence and semiconductor companies, but inflation, oil prices, and international conflicts continue creating uncertainty beneath the surface.
The Trump-Xi summit, Federal Reserve policy decisions, and developments in the Middle East may determine whether markets continue climbing or face a sharper reality check later in the year.
For now, AI remains the dominant market narrative. But in 2026, geopolitics is proving just as influential as technology.
## FAQs
### Why are AI stocks rising in 2026?
AI stocks are rising because companies worldwide are heavily investing in artificial intelligence infrastructure, cloud computing, and advanced semiconductor technology.
### Why is the Trump-Xi summit important?
The summit between Donald Trump and Xi Jinping could impact global trade, tariffs, AI competition, and geopolitical stability.
### Why are oil prices increasing?
Oil prices are climbing due to disruptions linked to the Iran conflict and reduced flows through the Strait of Hormuz.
### What is happening with U.S. inflation?
U.S. inflation has accelerated sharply in 2026, increasing expectations that the Federal Reserve may keep interest rates higher for longer.
### Why is SK Hynix gaining so much attention?
SK Hynix is benefiting from massive demand for AI memory chips and is approaching a $1 trillion market valuation.
**Categories:** Banking
---
### [BofA and Goldman Sachs Delay Fed Rate Cut Forecasts as Inflation Risks Persist](https://df.media/bofa-and-goldman-delay-fed-rate-cut-forecasts/)
**Published:** May 12, 2026
**Author:** Laura Anderson
**Excerpt:** BofA and Goldman Sachs push back Fed rate cut expectations as inflation risks, strong U.S. jobs data, and rising energy prices keep pressure on the Federal Reserve in 2026.
**Content:**
Wall Street firms are rapidly pushing back expectations for U.S. Federal Reserve interest rate cuts as stubborn inflation, rising energy prices, and resilient labor market data complicate the central bank’s path toward monetary easing.
Bank of America and Goldman Sachs are among the latest major financial institutions to revise their forecasts, signaling that interest rates could remain elevated much longer than markets previously anticipated.
BofA Global Research now expects the Federal Reserve to hold rates steady throughout 2026, projecting two quarter-point cuts only in July and September 2027. Goldman Sachs also delayed its outlook, forecasting rate cuts in December 2026 and March 2027, compared with its earlier expectation for the first cut in September this year.
The revised projections reflect mounting concern across financial markets that inflationary pressures remain too strong for the Fed to begin easing policy anytime soon.
The shift comes as the ongoing conflict in the Middle East continues to drive higher oil and energy prices, increasing fears that inflation could remain sticky across key sectors of the U.S. economy. Policymakers have become increasingly cautious about lowering borrowing costs prematurely while inflation still sits well above the Federal Reserve’s long-term 2% target.
Recent economic data has further reinforced the higher-for-longer narrative. U.S. employment growth exceeded forecasts in April, while the unemployment rate held steady at 4.3%, underscoring continued strength in the labor market despite elevated interest rates.
Analysts at Goldman Sachs said the Federal Open Market Committee may ultimately delay easing further if labor market conditions remain resilient through the second half of the year. The bank noted that insufficient economic slowdown could push the final phase of rate cuts into 2027.
The Federal Reserve’s April policy meeting highlighted growing divisions within the central bank itself. Officials voted 8-4 to keep interest rates unchanged, marking one of the closest Fed decisions in decades and signaling heightened uncertainty over the inflation outlook.
Markets are now increasingly pricing in the possibility that rates could remain within the current 3.50% to 3.75% range through the end of 2026.
The changing outlook is already reshaping investor sentiment across global markets. Treasury yields have remained elevated, while growth-oriented equities and technology stocks continue to face pressure from tighter financial conditions. Startups and high-growth companies are also confronting more difficult funding environments as access to low-cost capital becomes increasingly limited.
Meanwhile, a stronger U.S. dollar driven by expectations of prolonged higher rates is adding pressure on emerging markets and global investment flows.
BofA analysts said incoming Federal Reserve Chair Kevin Warsh may favor lower rates over time, but current economic conditions and inflation trends leave little room for immediate policy easing.
For investors, businesses, and policymakers, the latest revisions from Wall Street reinforce a growing consensus that the Federal Reserve’s fight against inflation is far from over.
**Categories:** Global News
---
### [Gold falls 1.2% as Iran Peace Talks Stall and Oil-Driven Inflation Spooks Markets](https://df.media/gold-falls-as-iran-peace-talks-stall-and-oil-rises/)
**Published:** May 11, 2026
**Author:** Vishnu Priya
**Excerpt:** Gold drops 1.2% as Iran peace talks stall and oil prices climb. Goldman Sachs delays Fed rate cut outlook to December 2026 as oil-driven inflation concerns mount.
**Content:**
Gold prices fell sharply on Monday as stalled Iran peace talks pushed crude oil higher, reigniting fears that oil driven inflation could keep interest rates elevated well into 2027 and pressure the non-yielding metal further.
Spot gold dropped 1.2 percent to $4,657.89 per ounce in early trading. US gold futures for June delivery shed 1.4 percent to $4,665.70. A stronger dollar added to the gold price drop 2026 pressure, making bullion more expensive for holders of other currencies.
**Iran Peace Talks Stall, Oil Jumps**
The gold price drop 2026 came directly on the back of deteriorating diplomatic signals. President Trump on Sunday rejected Iran’s latest response to a US peace proposal, calling it totally unacceptable and dashing market hopes for a near-term resolution to the ten-week conflict that has paralysed shipping traffic through the Strait of Hormuz and driven up global energy costs.
“We are essentially seeing an unwinding of hopes for an imminent deal, and gold is feeling the pinch from the renewed rise in crude prices,” said Tim Waterer, chief market analyst at KCM Trade.
With the Strait of Hormuz remaining largely closed, oil prices jumped and supply remained tight. The Iran peace talks stall has now pushed oil driven inflation concerns back to the top of the global macro agenda. The Federal Reserve’s semi-annual financial stability report, released last Friday, identified the Iran war and its energy price shock as the leading threat to financial stability among investors and institutions surveyed.
**Goldman Sachs Pushes Fed Rate Cut Outlook to December 2026**
The most consequential market development to follow the Iran peace talks stall came from Goldman Sachs, which revised its Fed rate cut outlook significantly. The bank pushed its forecast for the first Fed cut back to December 2026 and March 2027, abandoning its previous expectation of cuts in September and December this year. The reasoning was straightforward: elevated energy prices from the Iran conflict are likely to keep oil driven inflation high enough to prevent the Fed from easing on its earlier timeline.
Gold vs interest rates dynamics are well established. While gold is traditionally viewed as an inflation hedge, high interest rates suppress the appeal of the non-yielding asset by raising the opportunity cost of holding it. The revised Fed rate cut outlook makes the gold vs interest rates calculus unfavourable for bulls in the near term.
Investors are now focused on April’s US Consumer Price Index data due later this week, which will provide the clearest read yet on whether oil driven inflation is feeding through to core price pressures. A hotter than expected print would reinforce the Goldman Sachs position and add further downward pressure to the gold price drop 2026 trend.
**China Gold Production Falls in Q1**
Adding to the bearish picture, China’s gold production declined in the first quarter of 2026 compared to the same period a year earlier, according to the China Gold Association. Safety inspections led a number of smelters to suspend operations for maintenance during the quarter, tightening domestic supply even as consumption rose.
Despite the short-term gold price drop 2026, analysts are not calling a structural breakdown. Waterer placed the near-to-medium term trading range at $4,400 to $4,800, noting that the current ceasefire-without-a-peace-deal stalemate keeps both upside and downside scenarios firmly in play until the Iran peace talks stall is resolved one way or the other.
Elsewhere in precious metals, spot silver slipped 0.2 percent to $80.13 per ounce, platinum fell 1.2 percent to $2,029.95, and palladium declined 0.7 percent to $1,481.09.
Stay ahead of global markets, commodities, and financial news that moves money.
**[Read More at df.media →](https://df.media/)**
Your daily source for market intelligence, macro analysis, and financial news that matters.
**Categories:** Banking
---
### [S&P 500 Hits Record Above 7300, Dow Surges 600 Points on Iran Deal Hopes](https://df.media/sp-500-tops-7300-as-dow-surges-600-points-on-iran-deal/)
**Published:** May 7, 2026
**Author:** Vishnu Priya
**Excerpt:** S&P 500 hit a record 7,365 and Dow surged 612 points as US-Iran deal hopes cooled oil prices and boosted chipmakers like AMD
**Content:**
Wall Street delivered one of its strongest sessions of the year on Wednesday as reports emerged that the United States and Iran are closing in on a deal to end the war. The news sent the S&P 500 to its first-ever close above 7,300, pushed the Nasdaq to a fresh all-time high, and drove the Dow Jones Industrial Average up more than 600 points in a single session.
The [S&P 500](https://www.cnbc.com/2026/05/06/stock-market-today-live-updates.html) climbed 1.46% to close at 7,365.12. The Nasdaq Composite surged 2.02% to finish at 25,838.94. The [Dow](https://www.cnbc.com/2026/05/05/stock-market-today-live-updates.html) added 612.34 points, or 1.24%, ending at 49,910.59. Both the S&P 500 and Nasdaq closed at record highs.
## **What Sparked the Rally**
The catalyst came from Axios, which reported, citing multiple U.S. officials and sources briefed on the matter, that the White House believes it is nearing a one-page, 14-point memorandum of understanding with Iran. The proposed agreement would not only end the war but also establish a framework for more detailed nuclear talks, including a moratorium on nuclear enrichment. An Iranian foreign ministry spokesperson confirmed to CNBC that Tehran was evaluating a U.S. proposal toward a resolution.
Markets pulled back from their intraday highs after President Donald Trump added caution to the optimism. Writing on Truth Social, he called it “a perhaps, a big assumption” that Iran would agree to the terms. He warned that if negotiations fail, “the bombing starts, and it will be, sadly, at a much higher level and intensity than it was before.”
Trump had also announced late Tuesday that he was pausing “Project Freedom,” the U.S. plan to escort commercial ships through the Strait of Hormuz, citing what he described as great progress toward a complete and final agreement with Iranian representatives.
## **Oil Drops Sharply**
Oil prices cratered on the prospect of easing hostilities. West Texas Intermediate futures fell 7.03% to settle at $95.08 per barrel. International Brent crude lost 7.83%, closing at $101.27. The Strait of Hormuz, through which a significant share of global oil supply flows, has been a key flashpoint throughout the conflict.
Bill Northey, investment director at U.S. Bank Asset Management Group, said a resolution would deliver wide-ranging economic benefits. “If we truly achieve a point in time where the hostilities begin to slow down or stop in their entirety, and we see the reopening of the Strait of Hormuz, this will allow some of those most economically sensitive and hardest hit regions like Southeast Asia and Europe to potentially avoid their own economic difficulties,” he said. He described the setup as one that could produce a meaningful snapback in global equity markets.
## **Earnings Season Adds Fuel**
Beyond geopolitics, a robust earnings season has been providing independent support for stocks. Chipmaker Advanced Micro Devices led Wednesday’s gains, soaring 18.6% after beating first-quarter expectations on both revenue and profit while issuing a bullish outlook for the second quarter. The broader semiconductor sector followed, with the VanEck Semiconductor ETF jumping 5% and Intel gaining 4.5%.
Samantha McLemore, founder of Patient Capital Management, told CNBC’s Closing Bell that the bull market has further to run. “It’s a secular bull market. People have been talking about whether we’re in a bubble for over a year now, and that’s kept a lid on valuations. We’ve mostly just seen the moves track the earnings,” she said.
## **Thursday Futures and Early Movers**
The positive tone carried into Thursday morning. S&P 500 futures edged up 0.1%, Dow futures added 44 points, and Nasdaq 100 futures hovered near the flatline as traders continued monitoring Iran developments ahead of the open.
Several individual names posted strong premarket moves. DoorDash surged 10% after the food delivery company issued strong second-quarter order guidance. Fortinet climbed 16% after raising its full-year billings forecast. Peloton beat Wall Street revenue expectations in its fiscal third quarter, driven by better-than-expected equipment sales and subscription revenue, with free cash flow up nearly 60%. Shares rose close to 4%.
With geopolitical risk gradually easing and corporate earnings continuing to beat forecasts, traders are watching closely to see whether the S&P 500 can hold above the 7,300 level and extend its record run.
**Stay ahead of every market move. Follow [Daily Finance](https://df.media/) for real-time stock updates, oil price shifts, and breaking global finance news.**
**Categories:** Banking
---
### [Oil Prices Crash Below $100 as Iran Strait of Hormuz Reopening Hopes Grow](https://df.media/oil-prices-fall-below-100-on-strait-of-hormuz-news/)
**Published:** May 6, 2026
**Author:** Vishnu Priya
**Content:**
---
**Brent crude dropped nearly 11% on May 6, 2026, falling below $98 a barrel after Iran’s Islamic Revolutionary Guard Corps navy signalled that the strait of Hormuz could reopen. The announcement, coupled with reports of progress in US-Iran peace talks, triggered one of the sharpest single-day selloffs in energy markets in recent memory.**
## What Happened to Oil Prices Today?
Oil markets experienced a dramatic reversal on Wednesday as hopes of a geopolitical breakthrough sent traders rushing to unwind their positions. Brent crude slid to $97.48 a barrel, shedding more than $12 on the day and hitting its lowest level since April 22. US West Texas Intermediate crude fell 11.3% to $90.74 a barrel. The selloff extended across European gas markets, with the Dutch front-month benchmark contract dropping nearly 12% intraday before recovering to trade down 8.6% at €42.91 per megawatt hour. The British June gas contract fell 8.5% to 105.15p per therm.
The catalyst was a series of statements from Iran’s Islamic Revolutionary Guard Corps navy. In posts on social media in both Persian and English, the IRGC announced that the strait of Hormuz could reopen following what it described as the neutralisation of threats from aggressors. The IRGC thanked captains and shipowners across the Gulf for complying with Iran’s strait regulations and contributing to regional maritime security, stating that safe and stable passage would be ensured under new protocols.
Adding further momentum to the selloff, Reuters reported — citing a Pakistani source — that the United States and Iran are moving closer to an initial peace deal. No further details about the scope or terms of any agreement emerged during trading hours, but the signal alone was enough to send energy prices sharply lower.
## Why the Strait of Hormuz Matters So Much
To understand the scale of Wednesday’s market reaction, it helps to appreciate just how critical the strait of Hormuz is to global energy supply. The waterway is one of the world’s most strategically important shipping chokepoints, connecting the Persian Gulf to the Gulf of Oman and the broader international market. Roughly 20% of the world’s daily oil supply passes through it, making any disruption to traffic through the strait an immediate shock to global prices.
The recent period of elevated tensions had already pushed Brent crude well above $100 a barrel, as markets priced in the risk of prolonged supply constraints. Wednesday’s moves reflected an equally sharp repricing in the other direction — markets quickly adjusting to the possibility that those constraints could ease significantly faster than anticipated.
## Caution Remains Despite the Rally
Not everyone is convinced the selloff reflects the full picture. David Morrison, senior market analyst at Trade Nation, described Wednesday’s moves as a wave of risk-on trading as investors added a peace dividend across the board. But Morrison was quick to add a note of caution: no concrete details have emerged about what any potential deal might include, and even if the strait reopens fully, normalisation in shipping and trade flows would take months, not days.
That caution is well-founded. Oil inventories are not critically low, but uneven distribution and declining buffers in key consuming regions continue to raise concerns about localised shortages. A reopening of the strait eases the headline risk significantly, but it does not immediately resolve the logistical and infrastructure challenges that have built up over a prolonged period of restricted access.
There is also the question of geopolitical durability. Markets have seen false dawns before in the US-Iran relationship, and a Pakistani-sourced report of progress in peace talks, while significant, falls well short of a signed agreement. Traders who locked in gains on Wednesday will be watching closely for any signs that the diplomatic momentum stalls.
## What to Watch Next
The key variables in the coming days are straightforward. First, any official confirmation from either the US or Iranian government about the status of peace negotiations would either validate or deflate Wednesday’s repricing. Second, shipping data from the strait itself will matter — actual vessel movements resuming at pre-tension levels would provide concrete evidence that supply is flowing freely again. Third, OPEC responses bear watching: a sustained fall in prices below $95 could prompt member states to revisit output decisions made when prices were considerably higher.
For now, energy markets are operating on hope rather than certainty. The direction of travel is clear, but the road ahead remains uncertain.
---
## Frequently Asked Questions
1.**Why did oil prices fall so sharply on May 6, 2026?**
Oil prices fell nearly 11% after Iran’s IRGC navy announced that the strait of Hormuz could reopen following the end of what it called threats from aggressors. Reports from Reuters citing a Pakistani source also indicated the US and Iran are moving closer to a peace deal, compounding the selloff as markets priced in a significant easing of supply constraints.
2.**What is the strait of Hormuz and why do oil markets care about it?**
The strait of Hormuz is a narrow waterway connecting the Persian Gulf to the Gulf of Oman. Approximately 20% of the world’s daily oil supply passes through it, making it one of the most critical chokepoints in global energy trade. Any threat to traffic through the strait — whether from military tensions, blockades, or conflict immediately pushes oil prices higher, while signs of reopening push them lower.
3.**What did the IRGC actually announce?**
Iran’s Islamic Revolutionary Guard Corps navy posted statements in both Persian and English on social media, saying the strait of Hormuz could reopen now that threats from aggressors had been neutralised. The IRGC thanked Gulf shipping operators for complying with Iran’s maritime regulations and stated that safe passage would be guaranteed under new protocols.
4.**Will oil prices continue to fall if the strait reopens?**
Not necessarily straightaway. Even if the strait fully reopens, analysts including David Morrison of Trade Nation caution that normalisation in shipping and trade flows could take months. Oil inventories remain unevenly distributed, and no confirmed peace agreement has been signed. Prices could stabilise or recover partially depending on whether diplomatic progress holds and OPEC adjusts its output targets in response.
5.**How low could Brent crude go?**
That depends heavily on whether the US-Iran peace process produces a concrete agreement and whether the strait reopens fully and sustainably. If both happen, analysts expect continued downward pressure. However, OPEC member states are likely to respond if Brent falls significantly below $95 a barrel, providing a floor through potential output cuts.[ source](https://www.theguardian.com/business/live/2026/may/06/oil-prices-retreat-global-stocks-hit-record-highs-trump-great-progress-iran-deal-live-updates)
*Stay ahead of the latest developments in global markets and financial news. Visit* [Daily Finance](https://df.media/) *for in-depth coverage, analysis, and breaking stories.*
**Categories:** Finance, Global News
---
### [South Korean Stocks Hit Record High as Trump Launches Project Freedom](https://df.media/south-korean-stocks-hit-record-high/)
**Published:** May 4, 2026
**Author:** Vishnu Priya
**Content:**
**Asia Markets, May 3, 2026** — South Korean stocks surged to a fresh record on Monday, extending their strongest monthly performance in April, as investors assessed a new U.S. military initiative aimed at reopening commercial shipping through the Strait of Hormuz.
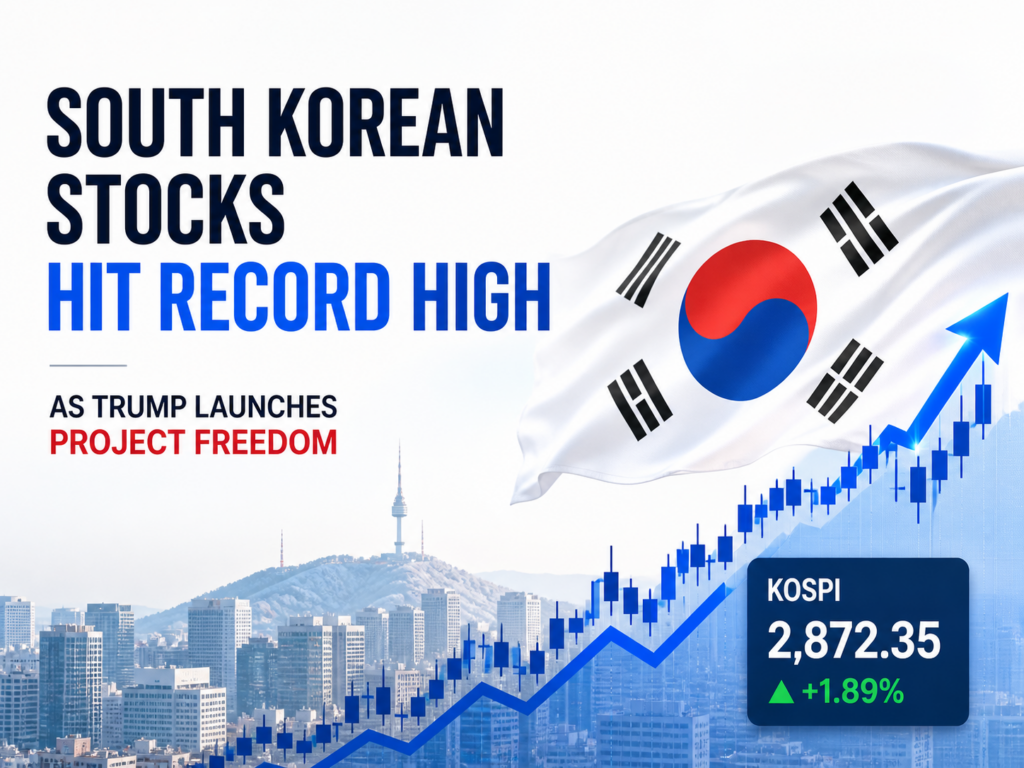The Kospi index closed the session up more than 5% at 6,936.99, its highest level on record. Samsung Electronics and SK Hynix were among the standout movers, climbing 5.44% and 12.52%, respectively, to record intraday highs, lifted by positive sentiment following strong U.S. technology earnings reported last week.
## **Trump Announces Project Freedom**
Over the weekend, President Trump announced a plan he is calling Project Freedom, a U.S. military effort to free civilian vessels that have been stranded in the Strait of Hormuz since the start of the Iran conflict. Trump outlined the initiative in a Truth Social post on Sunday, stating the effort would focus on getting civilian ships flagged in countries not affiliated with the conflict out of the contested waterway so they can freely and ably get on with their business.
U.S. Central Command confirmed shortly after that the operation would begin Monday, Middle East time, and would be backed by guided missile destroyers, over 100 land and sea based aircraft, multi domain unmanned platforms, and 15,000 service members.
## **Oil Prices Volatile but Steady**
Oil markets remained unsettled as traders continued to price in the uncertainty surrounding Project Freedom and its potential to ease the supply crunch. West Texas Intermediate futures for June delivery rose 0.66% to $102.61 a barrel in early Monday trading, while international benchmark Brent crude futures gained 0.64% to $108.86 a barrel.
The Strait of Hormuz has remained effectively closed since the Iran conflict began in late February, triggering what the International Energy Agency has called the biggest supply shock in history.
## **Bitcoin Faces Key Resistance After 30% Surge**
Crypto markets are also in focus Monday as Bitcoin attempts to hold its footing above $78,000 following a sharp 30% rally that has drawn renewed attention from traders and institutional investors alike. BTC/USD has broken out of a multi-month downtrend but is now approaching a cluster of key resistance levels that analysts say will determine whether the rally has staying power or runs out of momentum.
Crypto market participants are watching closely to see whether Bitcoin can clear those levels with conviction, as a confirmed breakout could open the door to further upside, while a rejection at resistance may trigger a near term pullback. The broader digital asset market has tracked the move higher, with several altcoins posting double digit gains over the past two weeks.
## **Broader Asia Pacific Markets Mostly Higher**
Across the region, most major indexes traded in positive territory. Hong Kong’s Hang Seng index gained 1.41%, while India’s Nifty 50 added 0.47%. Australia’s S&P/ASX 200 was the notable exception, slipping 0.37% to 8,697.10. Markets in Japan and China were closed for public holidays.
## **U.S. Futures Edge Higher**
U.S. stock futures pointed to a steady open on Wall Street. S&P 500 futures added 0.11% and Nasdaq 100 futures gained 0.33%, while Dow Jones futures slipped about 48 points, or 0.1%.
The moves follow a strong close on Friday, when both the S&P 500 and Nasdaq Composite rose to new all time intraday and closing highs. The S&P 500 gained 0.29% and the Nasdaq climbed 0.89%, though the Dow dipped 152.87 points, or 0.31%, bucking the broader trend.
With the Strait of Hormuz situation still unresolved and a major U.S. military operation now underway, markets are expected to remain sensitive to any developments in the region through the week ahead.
Follow daily finance coverage at [Daily Finance](https://df.media/) for the latest on oil markets and the Strait of Hormuz situation.
**Categories:** Banking
---
### [Oil Hits Four-Year High as U.S. Weighs Military Action Against Iran](https://df.media/oil-surges-to-four-year-high-on-iran/)
**Published:** April 30, 2026
**Author:** Laura Anderson
**Excerpt:** Brent crude surged over 7% to $126 a barrel after reports that Trump will receive a briefing on military options against Iran, deepening fears over Strait of Hormuz supply disruptions.
**Content:**
---
London/New York, Apr. 30, 2026 — Brent crude surged to its highest level in four years on Thursday after reports emerged that U.S. President Donald Trump is set to receive a briefing on new military options for action against Iran, reigniting fears of a prolonged energy supply crisis centred on the Strait of Hormuz.
The global benchmark jumped as much as 7.1% to surpass $126 a barrel, a level not seen since the immediate aftermath of Russia’s invasion of Ukraine in 2022, before easing slightly to trade near $122. July futures, the more actively traded contract, climbed as high as $114.70 a barrel.
**Strike Plans Under Review**
According to a report by Axios, the head of U.S. Central Command, Admiral Brad Cooper, is scheduled to brief Trump on Thursday regarding options that could include a short and powerful wave of strikes on Iranian infrastructure. Admiral Cooper delivered a similar briefing to the president on February 26, shortly before the United States and Israel launched military operations against Iran.
The development signals that a resumption of active combat operations is now being seriously considered at the highest levels of the U.S. government.
**Strait of Hormuz Remains Effectively Closed**
The Strait of Hormuz, through which a significant share of the worlds crude oil and liquefied natural gas flows, has been effectively shut since the conflict began in late February. Both the United States and Iran have maintained naval blockades of the waterway, choking off energy flows and steadily driving up global prices.
The International Energy Agency has described the conflict as the biggest supply shock in history. Vitol Group estimates the market is facing a total supply loss of around 1 billion barrels. U.S. crude exports meanwhile surged to a record last week, with overseas shipments rising above 6 million barrels a day as global buyers sought American supply to replace lost Middle Eastern volumes.
**No End in Sight**
A ceasefire has technically held since early April, but diplomatic efforts to bring negotiators from both sides to the table have so far failed. Trump told Axios separately that he would not lift the U.S. naval blockade on Iranian ports until a nuclear deal with Tehran is secured. Iranian officials have remained defiant throughout the standoff.
Trump has ripped away the security blanket the market was clinging to, said Robert Rennie, head of commodity research at Westpac Banking Corp. Traders are now being forced to confront a much uglier reality: both sides still think they are winning, neither side has a clear incentive to negotiate, and energy prices are starting to accelerate higher.
**Washington Expands Its Offensive**
The Trump administration is now seeking the forfeiture of two Iran-linked oil tankers seized by U.S. naval forces, a move that would mark a significant escalation of Washington’s economic campaign against Tehran. The U.S. has already turned away dozens of ships since deploying warships to block Iranian vessels on April 13.
Washington is also asking allied nations to join an international coalition that would allow commercial shipping to transit the Strait of Hormuz safely, according to a Wall Street Journal report citing an internal State Department cable sent to U.S. embassies this week.
**Market Outlook**
Supply tightness is increasingly visible in futures pricing. The spread between Brent’s two nearest December contracts has widened to over $11 a barrel, compared to around $3 just two months ago.
Prices have nowhere to go but up until a Strait of Hormuz reopening comes into line of sight, said Vandana Hari, founder of Vanda Insights. As of now, how and when that might happen is anybodys guess.
Karen Young, senior research scholar at Columbia University’s Center on Global Energy Policy, put it plainly. The market is realizing we are not coming to any solution in terms of traffic in the strait, she said. Price pressure just has to mount until we get to some demand destruction.
With no diplomatic breakthrough in sight and military options now back on the table, energy markets are bracing for further volatility in the days ahead.
**Categories:** Banking
---
### [Oil Markets on Edge as Trump Extends Iran Blockade as Brent Hits $114](https://df.media/oil-prices-brent-iran-blockade-strait-hormuz-april-2026/)
**Published:** April 29, 2026
**Author:** Vishnu Priya
**Excerpt:** Brent hits $114 as Trump extends Iran port blockade, deepening Strait of Hormuz supply fears. Oil markets brace for more disruption.
**Content:**
**Daily Finance \| Markets Desk \| April 29, 2026**
Oil prices surged sharply on Wednesday, with Brent crude climbing 3% to hit a one-month high of $114.59 a barrel, as fears of a prolonged supply crunch gripped energy markets. The rally, now stretching across eight consecutive sessions for Brent, was fuelled by reports that U.S. President Donald Trump is preparing to extend his blockade of Iranian ports, a move that traders fear will deepen an already fragile supply situation in the Middle East.
The Wall Street Journal reported late Tuesday, citing U.S. officials, that Trump has instructed aides to plan for a continued port blockade aimed at squeezing Iran’s economy and oil exports. Trump himself stoked tensions further on Wednesday, posting on Truth Social that Iran “better get smart soon,” signalling that any near-term diplomatic resolution remains distant.
U.S. West Texas Intermediate futures climbed alongside Brent, rising 3.6% to $103.48 a barrel, its highest level since April 13. WTI has now posted gains in seven of the last eight trading sessions, accumulating a staggering 49% rise since the U.S. and Israeli-led military campaign against Iran began on February 28.
## **Strait of Hormuz Remains the Central Pressure Point**
The ongoing closure of the Strait of Hormuz continues to sit at the heart of the oil market’s anxiety. The strait, through which roughly 20% of the world’s oil supply passes, has been effectively shut to normal commercial traffic since the conflict escalated. Abu Dhabi National Oil Company has already notified select customers that two crude grades will need to be loaded from outside the Gulf next month, reflecting the logistical strain rippling across the industry.
Yang An, analyst at Haitong Futures, put it plainly: if Trump extends the blockade, supply disruptions will worsen and continue pushing prices higher with little near-term relief in sight.
## UAE’s OPEC Exit Adds Complexity, Not Immediate Supply
Energy markets also absorbed the shock of the United Arab Emirates announcing its departure from OPEC, effective May 1. While the move was widely interpreted as a long-term bearish signal, freeing the UAE to pump beyond its quota, analysts were quick to temper expectations of any immediate impact.
ING analysts noted that the UAE’s exit, though a significant institutional blow to OPEC, cannot translate into additional market supply until the Strait of Hormuz reopens and oil flows normalise. ANZ Research echoed this, stating that prices remain driven by geopolitics, logistics, and inventory levels rather than organisational shifts within producer blocs.
In the medium term, the UAE’s unconstrained output potential is expected to push the Brent forward curve into deeper backwardation, a market structure that typically signals tight near-term supply against expectations of future easing.
## Inventories Add a Modest Tailwind
Compounding the upward price pressure, the American Petroleum Institute reported a second consecutive weekly decline in U.S. domestic crude inventories. Formal confirmation from the U.S. Energy Information Administration was awaited later Wednesday and, if confirmed, would add further support to an already bullish market sentiment.
### The Bigger Picture
With negotiations between the U.S. and Iran stalled and no ceasefire agreement formalised despite a temporary pause in hostilities, markets have little reason to price in a supply recovery in the near term. Until there is a clear resolution that restores uninhibited energy flows through the Strait of Hormuz, both Brent and WTI look set to remain elevated. Traders will be watching Trump’s next move closely, and in this market, every Truth Social post carries a price tag.
**Categories:** Banking
---
### [Gold Price 2025 Hits $4,300: 5 Powerful Signals Shaking Global Finance](https://df.media/gold-price-2025-breaks-4300/)
**Published:** December 17, 2025
**Author:** Laura Anderson
**Excerpt:** Gold price 2025 surges above $4,300 as the dollar weakens and Fed rate cut expectations rise. Here’s why global markets are watching gold closely.
**Content:**
The **gold price 2025** has surged past a historic milestone, climbing above **$4,300 per ounce** as global markets respond to a weakening US dollar and rising expectations of Federal Reserve rate cuts. This move is being widely interpreted as a decisive signal from investors that macroeconomic uncertainty is far from over and that gold remains the world’s most trusted safe-haven asset
- [Gold price 2025 and the weakening US dollar](#gold-price-2025-and-the-weakening-us-dollar)
- [Fed rate cut expectations fuel gold demand](#fed-rate-cut-expectations-fuel-gold-demand)
- [Central banks reinforce the gold price 2025 trend](#central-banks-reinforce-the-gold-price-2025-trend)
- [Inflation concerns keep gold in focus](#inflation-concerns-keep-gold-in-focus)
- [Global market reaction to the gold price 2025 surge](#global-market-reaction-to-the-gold-price-2025-surge)
- [What lies ahead for the gold price 2025](#what-lies-ahead-for-the-gold-price-2025)
- [Why gold matters more than ever in 2025](#why-gold-matters-more-than-ever-in-2025)
- [What is driving the gold price in 2025?](#what-is-driving-the-gold-price-in-2025)
- [Will gold prices continue to rise in 2025?](#will-gold-prices-continue-to-rise-in-2025)
- [Is gold a safe investment in 2025?](#is-gold-a-safe-investment-in-2025)
- [How do Fed rate cuts affect gold prices?](#how-do-fed-rate-cuts-affect-gold-prices)
Across the US, Europe, Asia, and emerging markets, institutional investors are repositioning portfolios as monetary policy expectations shift. The rally in the gold price 2025 is not driven by speculation alone. It reflects a deeper realignment of capital toward assets perceived as stable during periods of slowing growth, persistent inflation risks, and geopolitical tension.
### Gold price 2025 and the weakening US dollar
One of the most immediate drivers behind the surge in the gold price 2025 is the sustained decline of the US dollar. As the dollar index slipped to multi-month lows, gold became increasingly attractive to investors holding non-dollar currencies. Historically, gold and the dollar share an inverse relationship, and current market conditions have amplified that trend.
Currency strategists note that concerns over US fiscal deficits, slowing economic momentum, and policy uncertainty have weighed heavily on the dollar. As confidence in fiat currencies weakens, gold benefits from its role as a globally recognized store of value.
### Fed rate cut expectations fuel gold demand
Expectations of Federal Reserve rate cuts have played a central role in driving the gold price 2025 higher. Recent economic data has strengthened the case for monetary easing, with softer inflation readings and signs of cooling labor markets influencing market sentiment.
Lower interest rates reduce the opportunity cost of holding gold, which does not offer yield. As real yields decline, gold becomes more competitive compared to bonds and other interest-bearing assets. This dynamic has prompted renewed interest from hedge funds, pension funds, and long-term asset managers.
Market pricing now reflects growing confidence that rate cuts are approaching, and gold is increasingly seen as a strategic hedge against policy uncertainty rather than a short-term trade.
### Central banks reinforce the gold price 2025 trend
Central bank buying continues to provide a powerful structural foundation for the gold price 2025. Monetary authorities across Asia, the Middle East, and emerging economies have accelerated gold purchases as part of broader efforts to diversify reserves away from the US dollar.
This trend reflects long-term concerns over currency risk, sanctions exposure, and global financial fragmentation. Central bank demand is particularly significant because it reduces downside volatility and reinforces gold’s status as a core reserve asset rather than a speculative instrument.
Analysts widely agree that official sector buying has transformed the gold market, making price pullbacks shallower and rallies more durable.
### Inflation concerns keep gold in focus
While inflation has moderated in some regions, price pressures remain uneven across the global economy. Energy costs, supply chain realignments, and geopolitical disruptions continue to inject uncertainty into inflation forecasts.
For investors, the gold price 2025 represents protection against the erosion of purchasing power. Gold’s role as an inflation hedge has gained renewed relevance as markets grapple with the possibility that inflation may remain structurally higher than pre-pandemic norms.
This perception has been particularly strong in Europe and parts of Asia, where currency volatility and energy price risks have reinforced demand for physical gold and gold-backed financial products.
### Global market reaction to the gold price 2025 surge
The surge in the gold price 2025 has sent ripple effects across global financial markets. Equity investors are increasingly viewing gold’s rally as a cautionary signal, suggesting heightened risk aversion and declining confidence in growth-sensitive assets.
Banking and financial stocks have shown sensitivity to shifting interest rate expectations, while commodities markets have broadly taken cues from gold’s strength. Among all major commodities, gold has emerged as a clear outperformer, reinforcing its leadership role during periods of macroeconomic stress.
Retail investors have also re-entered the market, driven less by short-term gains and more by the desire to preserve capital amid uncertain economic conditions.[source](https://uk.finance.yahoo.com/news/gold-price-oil-gold-commodities-pound-084746433.html?guccounter=1&guce_referrer=aHR0cHM6Ly93d3cuZ29vZ2xlLmNvbS8&guce_referrer_sig=AQAAAFcaK8X47TLC8Xi-9ketestfUWKUQLvjkddIKT9dl39qColtUwB2qiElOA907f6rLDoF5xe51c0B6to2MostCGPy2CpNA5SOdJBukkjQMX4_qk2mDojjYTlqy9iPENm_ZqgoU1WXWN_Ung0ilhud0cn6XydsZyiLGk5KE17utiN2)
### What lies ahead for the gold price 2025
Looking forward, most analysts expect the gold price 2025 to remain well supported if the Federal Reserve moves toward easing and the US dollar continues to weaken. Any escalation in geopolitical tensions or signs of a sharper economic slowdown could push prices even higher.
That said, volatility is likely to persist. Short-term corrections may occur if inflation surprises to the upside or if central banks delay policy shifts. However, the broader outlook remains constructive, with gold increasingly viewed as a strategic allocation rather than a cyclical trade.
### Why gold matters more than ever in 2025
The rally in the gold price 2025 is not an isolated market event. It reflects a broader transformation in how global capital responds to uncertainty, policy risk, and currency instability. In an environment where traditional financial anchors are under pressure, gold continues to function as a universal hedge.
For policymakers, investors, and institutions, gold’s move above $4,300 serves as a clear signal of shifting confidence across the global financial system. As markets await clearer direction from central banks, gold remains firmly at the center of the global finance conversation. FAQ
### What is driving the gold price in 2025?
The gold price 2025 is driven by US dollar weakness, rising Fed rate cut expectations, persistent inflation risks, and strong central bank demand.
### Will gold prices continue to rise in 2025?
If interest rates fall and geopolitical uncertainty remains high, analysts expect the gold price 2025 to stay elevated with upside potential.
### Is gold a safe investment in 2025?
Gold remains one of the most trusted safe haven assets in 2025, particularly during periods of market volatility and monetary policy shifts.
### How do Fed rate cuts affect gold prices?
Fed rate cuts lower real yields, reducing the opportunity cost of holding gold, which historically supports higher gold prices.
Stay ahead of global markets, gold prices, central bank policy, and breaking finance news.👉 [Daily Finance ](https://df.media/)
**Categories:** Global News
---
### [Gold Price 2026 Breaks $4300 as Fed Rate-Cut Signals Rattle Global Markets](https://df.media/gold-price-2026-breaks-fed-rate-cut/)
**Published:** January 28, 2026
**Author:** Laura Anderson
**Excerpt:** Gold price 2026 hits record highs as gold surges past $4,300 amid Fed rate cut bets, dollar weakness, and global market volatility.
**Content:**
Gold price 2026 is flashing a major warning and opportunity signal for global markets as gold surged past the $4,300 level, driven by aggressive Federal Reserve rate cut expectations, a weakening US dollar, and rising geopolitical and financial uncertainty. Investors across equities, bonds, crypto, and commodities are closely watching gold’s breakout as a defining macro moment for 2026.
## Gold Price 2026 Breaks Above $4,300
The 2026 gold rally represents more than a commodity spike—it’s a market-wide signal that risk sentiment is shifting. When gold breaks $4,300, institutional investors interpret this as a flight-to-safety trade, meaning equities and bonds are facing headwinds. The breakout comes as real yields turn negative, the US dollar weakens against major currencies, and geopolitical tensions push safe-haven demand higher.
This isn’t speculative retail trading. Major central banks, pension funds, and hedge funds are accumulating gold at these levels. The $4,300 threshold matters because it represents psychological resistance that, once broken, typically attracts algorithmic buying and technical fund flows.
## Why Gold Price Is Rising in 2026
Three macro forces are driving the gold price 2026 surge:
**Federal Reserve Rate Cuts.** Market expectations for aggressive 2026 Fed rate cuts are the primary catalyst. Lower rates reduce the opportunity cost of holding non-yielding gold, making it more attractive relative to bonds. Each Fed pivot signal sends gold higher because investors anticipate currency weakness ahead.
**Dollar Weakness.** A declining US dollar makes gold cheaper for international buyers, boosting demand from Europe, Asia, and emerging markets. The inverse relationship between the dollar and gold is one of the most reliable correlations in finance.
**Geopolitical Risk.** Escalating tensions in Eastern Europe, the Middle East, and Asia-Pacific regions push capital into defensive positions. Gold serves as the ultimate political insurance, which explains why uncertainty spikes consistently trigger gold rallies.
These three factors combined create a perfect storm for gold price 2026 strength.
## Fed Rate Cut Expectations and the Gold Rally
The Federal Reserve’s 2026 guidance is reshaping portfolio allocation. If the Fed cuts rates three to four times this year, real yields—adjusted for inflation—will turn deeply negative. This creates a powerful incentive to rotate out of cash and short-duration bonds and into hard assets like gold.
Market pricing shows a 60%+ probability of at least two 25-basis-point cuts before June 2026. Each cut increases gold’s relative value because the metal doesn’t pay interest, so it becomes competitive when bond yields are suppressed. Additionally, rate cuts typically coincide with dollar weakness, creating a double tailwind for gold price 2026.
## Gold Price 2026 vs Stocks, Bonds, and Bitcoin
Gold’s 2026 performance reveals critical portfolio dynamics:
- **vs Stocks:** Gold is outperforming equities, signaling investor caution about valuations and earnings growth.
- **vs Bonds:** As bond yields fall from Fed cuts, gold becomes competitive again after years of underperformance.
- **vs Bitcoin:** Gold and crypto both benefit from rate cuts, but gold carries less volatility and regulatory risk, making it the institutional choice in risk-off environments.
The correlation shift matters: when gold rallies while stocks fall, it confirms that fear, not greed, is driving markets.
## Gold Price Forecast 2026: What Happens Next
Analysts differ on 2026 targets, but the consensus range is $4,500–$5,000 by year-end if:
- The Fed follows through with expected rate cuts
- The dollar weakens another 5–10% from current levels
- Geopolitical tensions remain elevated
- Inflation stays sticky, requiring longer-duration gold exposure
Downside risk exists if the Fed pauses cuts due to inflation surprises, which could push gold back toward $4,000. But the structural case for higher gold prices—negative real yields, geopolitical risk, central bank accumulation—remains intact.
---
## Frequently Asked Questions
**Q: What is the current gold price 2026 level?** A: Gold price 2026 has broken above $4,300 per troy ounce, marking a major technical and psychological breakout driven by Fed rate cut expectations and dollar weakness.
**Q: Why is gold price 2026 rising?** A: Gold is rising due to three factors: (1) Expected Federal Reserve rate cuts reducing opportunity cost, (2) US dollar weakness making gold cheaper internationally, (3) Geopolitical risk creating demand for safe-haven assets.
**Q: How do Fed rate cuts affect gold price 2026?** A: Rate cuts lower real yields (bond yields minus inflation), making non-yielding gold more attractive. They also typically weaken the dollar, which increases international demand for gold and supports higher prices.
**Q: What is the gold price 2026 target?** A: Consensus forecasts range from $4,500–$5,000 by end of 2026, assuming Fed rate cuts continue and geopolitical risks remain elevated. Downside to $4,000 exists if inflation surprises force Fed to pause cuts.
**Q: Should I buy gold in 2026?** A: This depends on your portfolio allocation and risk tolerance. Gold serves as portfolio insurance against currency debasement and geopolitical risk, making it suitable as a 5–10% position for most investors. Consult a financial advisor for personalized guidance.
**Q: Is gold price 2026 a buying opportunity or a warning?** A: Gold breaking $4,300 sends both signals: opportunity for accumulation if you believe rates will fall further, and warning that equity investors are losing confidence in stock valuations. Both interpretations are valid depending on your time horizon and risk profile.
---
Learn more about **[Federal Reserve interest rate policy](https://www.federalreserve.gov/monetarypolicy.htm)** to understand how central bank decisions drive gold rallies.
**Stay ahead of global markets, gold prices, central bank policy, and breaking finance news only on [Daily Finance](https://df.media/)**
**Categories:** Finance, Global News
**Tags:** gold price 2026
---
### [Oil Prices Rise as US-Iran Peace Talks Stall, Markets Brace for Fresh Supply Risks](https://df.media/oil-prices-rise-as-us-iran-talks-stall/)
**Published:** April 27, 2026
**Author:** Vishnu Priya
**Excerpt:** Oil prices rise after US-Iran peace talks stall again. Brent crude climbs as markets monitor Strait of Hormuz risks and global energy supply pressure.
**Content:**
April 27, 2026
Global oil markets moved higher on Monday as renewed uncertainty surrounding US-Iran peace talks created fresh pressure on energy prices. Investors reacted after planned negotiations between Washington and Tehran were delayed once again, increasing concerns that tensions in the Middle East could continue disrupting global crude supplies.
Brent crude, the international benchmark, climbed around 1% to trade near $106.50 per barrel, while West Texas Intermediate crude rose roughly 1% to $95.40. The gains extend a broader rally that has kept energy markets volatile in recent weeks and reinforced fears that geopolitical tensions remain a serious threat to supply stability.
The latest jump in crude prices followed comments from US President Donald Trump, who said Washington had canceled plans to send officials to Pakistan for another round of talks with Iranian representatives. Markets had been watching the diplomatic channel closely in the hope that progress could calm tensions and reduce the risk premium built into oil prices. Instead, the cancellation has revived worries that the conflict may continue longer than expected.
Much of the concern centers on the Strait of Hormuz, one of the most important shipping routes in the global energy market. Nearly one-fifth of the world’s crude oil and liquefied natural gas normally passes through the narrow waterway. Any threat to safe passage can have an immediate impact on prices, insurance costs, and shipping schedules.
That explains why oil prices rise so quickly whenever tensions flare in the Gulf region. Traders understand that even limited disruption in the strait can tighten supply and force buyers to seek more expensive alternatives elsewhere.
Iranian officials have recently indicated that discussions are taking place with Oman regarding regional security and safe maritime transit. While those signals may appear positive, investors are no longer responding strongly to verbal assurances alone. After several failed ceasefire efforts and repeated diplomatic setbacks, markets now want concrete evidence before pricing in a sustained decline in crude.
This shift in sentiment is significant. In earlier phases of the conflict, a peace headline could send oil lower almost instantly. Now, traders seem more cautious, preferring to wait for confirmed action rather than promises. As a result, prices remain elevated despite occasional optimistic statements.
Higher oil prices also raise wider economic concerns. Crude remains one of the most influential commodities in the global economy, affecting transportation, manufacturing, logistics, and household fuel bills. If Brent remains above the $100 level for an extended period, inflation risks could return in multiple regions just as many central banks were beginning to see price pressures ease.
For import-dependent economies such as India, Japan, and South Korea, expensive oil can create additional strain. Higher energy bills often widen trade deficits, weaken currencies, and increase the cost of goods across the supply chain. Consumers may feel the impact through higher petrol prices, airline fares, and transport-linked goods.
Interestingly, Asian stock markets showed resilience despite the latest rise in oil. Japan’s Nikkei 225 advanced strongly, while South Korea’s Kospi also posted gains. Investors appear to believe that regional economies can manage near-term energy shocks so long as supply routes remain open and the crisis does not escalate further.
However, that optimism could be tested if crude prices continue moving higher. Levels above $110 per barrel would likely place new pressure on transport companies, airlines, manufacturers, and chemical producers. Equity markets may also become more volatile if investors begin to price in renewed inflation and slower economic growth.
Looking ahead, the direction of oil markets will depend largely on diplomacy and security developments. If negotiations between the United States and Iran resume and meaningful progress is made, prices could cool quickly. On the other hand, any confirmed threat to tanker traffic or additional military escalation could push crude sharply higher in a short period.
Analysts expect Brent to remain highly volatile this week, with traders reacting rapidly to headlines from Washington, Tehran, and Gulf shipping routes. Official statements, inventory data, and comments from major oil producers are all likely to influence short-term moves.
For now, geopolitical risk remains the dominant force in the market. Oil prices rise because traders see too much uncertainty and too little progress. Until there is credible diplomatic movement or improved confidence around the Strait of Hormuz, energy markets are likely to stay tense.
For businesses, consumers, and policymakers, the message is clear: oil volatility is not over, and the global economy remains highly sensitive to events in the Middle East.
## FAQs
### Why are oil prices rising today?
Oil prices are rising because peace talks between the United States and Iran have stalled, increasing fears of supply disruption in the Middle East.
### Why is the Strait of Hormuz important?
The Strait of Hormuz is a major shipping route through which around 20% of the world’s crude oil and LNG supplies pass.
### Could petrol prices rise again?
Yes, if crude oil remains elevated for several weeks, fuel prices in many countries may increase.
### How high could Brent crude go?
Analysts believe Brent could test the $110 range if geopolitical tensions worsen or shipping routes are disrupted.
### Will oil prices fall soon?
Prices may fall if diplomatic talks restart and markets receive clear evidence of easing tensions.
## CTA
Stay ahead of breaking finance, markets, crypto, and global business news with **DF Media** — your trusted source for fast, sharp, and reliable coverage that matters.
**Categories:** Banking
---
### [Trump Threatens Big Tariff on U.K. Over Digital Tax on U.S. Tech Firms](https://df.media/trump-threatens-tariff-on-u-k-over-digital-services-tax/)
**Published:** April 24, 2026
**Author:** Vishnu Priya
**Excerpt:** President Trump warns of major tariff on U.K. unless Britain drops its digital services tax on U.S. tech firms including Apple, Google, and Meta.
**Content:**
Trump Threatens Big Tariff on U.K. if Britain Keeps Digital Tax on U.S. Tech Firms
Washington, Apr. 24, 2026 — U.S. President Donald Trump has threatened to impose major tariffs on the United Kingdom unless Britain withdraws its digital services tax on American technology companies, raising fresh concerns over transatlantic trade relations.
Speaking from the Oval Office on Thursday, Trump criticised the levy as an unfair burden on U.S. businesses and warned that Washington could retaliate through new import duties on British goods if the tax remains in place.
If they do not drop the tax, we will probably put a big tariff on the U.K., Trump told reporters, without specifying the size or timeline of any proposed measure.
The remarks mark a sharp escalation in tensions between two historically close allies and could create new uncertainty for businesses operating across both markets.
**Tax Targets Major U.S. Technology Firms**
The U.K. digital services tax, introduced in 2020, applies a 2% charge on revenues earned from British users by search engines, social media platforms, and online marketplaces. The policy affects several large U.S.-based firms, including Apple, Alphabet, and Meta Platforms.
British officials have long defended the measure, arguing it ensures multinational digital companies contribute fairly to public finances. Government data shows the tax raised around £800 million ($1.08 billion) during the 2024 to 2025 fiscal year.
**Trade Dispute Revives Uncertainty**
Trumps comments come despite an existing trade framework between Washington and London reached last year. While the digital tax remained untouched in that agreement, Trump recently suggested earlier terms could be reopened for renegotiation.
Analysts said the latest warning may be part of a broader White House effort to pressure allies over taxes targeting American corporations.
This is about more than Britain, said one trade analyst in Washington. It sends a signal that the U.S. is prepared to respond aggressively when foreign governments impose digital taxes on American firms.
**Markets Watching Potential Fallout**
Any tariffs on British imports could affect a wide range of sectors, including automotive manufacturing, consumer goods, pharmaceuticals, and industrial exports. Investors will also be watching for potential effects on the British pound and U.K.-listed multinational companies if the dispute deepens.
Shares of major U.S. technology companies could stand to benefit if Britain eventually revises or removes the levy, reducing their tax exposure in a key overseas market.
**Diplomatic Pressure Ahead of Royal Visit**
The tariff threat arrives just days before a planned state visit to the United States by King Charles III and Queen Camilla. The royal trip had been widely expected to focus on strengthening ties between the two nations, but the renewed trade dispute may now overshadow those efforts.
**What Happens Next**
British officials have not yet publicly responded to Trumps latest comments. Analysts expect London to pursue negotiations rather than immediate concessions, potentially offering amendments to the digital tax structure rather than a full repeal.
For now, markets are treating the remarks as a negotiating tactic, though investors remain alert to any formal tariff announcement. If enacted, new duties would add another layer of uncertainty to global trade flows already under pressure from geopolitical tensions and slowing economic growth.
**Categories:** Banking
---
### [Tesla Q1 2026 Earnings: Beat on Revenue, But a $25 Billion Warning Rattles Markets](https://df.media/tesla-q1-2026-earnings-beat-on-revenue-but-a-25-billion-warning-rattles-markets/)
**Published:** April 23, 2026
**Author:** Vishnu Priya
**Content:**
Tesla delivered a surprise to the upside in Q1 2026, beating both revenue and earnings estimates in a quarter where many had braced for worse. But the celebrations were short-lived. After hours, shares reversed as the company announced plans to spend over $25 billion this year to fund its pivot into robotics and autonomous driving, well above the $20 billion it guided for back in January.
The result? A mixed picture that perfectly captures where Tesla sits right now: fundamentally resilient, but burning cash at a pace that demands a lot of faith in the long game.
---
**What the Q1 Numbers Tell Us**
Tesla’s core automotive business held up better than feared. Margins, deliveries, and revenue came in ahead of consensus estimates — a meaningful positive after a string of disappointing quarters. The beat signals that demand, while not explosive, is stabilising and that Tesla’s relentless cost discipline is still paying off at the factory level.
For bulls, this was the proof they needed that Tesla’s manufacturing machine remains one of the most efficient in the world, capable of protecting the bottom line even when the top line is under pressure.
---
**The $25 Billion Question**
Here’s where it gets complicated.
Tesla now says it will spend more than $25 billion in capital expenditure in 2026 a significant jump from the $20 billion it forecast in January, just three months ago. The bulk of that spending is directed at two moonshots: robotics (Optimus) and autonomous driving (Full Self-Driving and robotaxi).
This is a company making a very deliberate bet. Rather than consolidating gains and returning cash to shareholders, Tesla is doubling down aggressively on the most speculative parts of its business.
The market’s after-hours reaction tells you everything. Investors were relieved by the beat. They were unsettled by what comes next.
---
**The Rest of the Market: Winners and Losers**
Tesla wasn’t the only name in focus. Thursday’s premarket session saw a wide range of corporate results:
**Comcast** rose after shedding fewer broadband subscribers than analysts feared — a signal that cord-cutting may be plateauing faster than expected.
**American Express** ticked higher, with its wealthier client base helping deliver better-than-expected Q1 profit. Premium consumers are still spending freely, which bodes well for the higher-end segment of the economy.
**American Airlines** climbed after posting stronger-than-anticipated quarterly revenue and a narrower adjusted loss — despite rising fuel costs linked to geopolitical tensions in the Middle East.
**IBM** slipped after revenue growth slowed, weighed down by weakness in its software division — a concern for investors who have been watching Big Blue’s transformation story closely.
**Thermo Fisher Scientific** beat on both profit and revenue, with strength in laboratory products and biopharma services helping offset weakness elsewhere. Despite the beat, shares fell — a reminder that good numbers don’t always equal a higher stock price when valuations are stretched.
**Honeywell** warned that Iran-related disruptions would impact its business and guided below Wall Street expectations for the current quarter, sending shares lower.
**Lockheed Martin** dropped after reporting negative free cash flow of $291 million — a sign the defence giant burnt through more cash over winter than the market had anticipated.
---
**The Macro Backdrop**
U.S. stock futures were broadly lower heading into Thursday’s session. Dow futures fell over 350 points, while S&P 500 and Nasdaq 100 futures each slipped around 0.5%. Geopolitical tensions in the Middle East — particularly around the Strait of Hormuz — continued to weigh on sentiment, with investors monitoring potential disruptions to global oil supply.
The combination of earnings uncertainty and macro risk is creating a cautious tone across markets, even as individual names deliver pockets of upside.
---
**The Bottom Line on Tesla**
Tesla’s Q1 beat matters. It shows the company can execute operationally even in a tough environment. But the $25 billion capex commitment is a pivotal signal — this management team is not managing for near-term stock performance. They are swinging for the fences on autonomy and robotics.
Whether that’s brilliant capital allocation or reckless spending depends entirely on whether FSD and Optimus deliver. The next 12–18 months will go a long way toward answering that question.
For investors, Tesla remains exactly what it has always been: a high-conviction, high-volatility bet on a very specific version of the future.
👉 **Visit [daily finance](https://df.media) for daily market news, stock analysis, and investment insights — straight to the point.**
**Categories:** Banking
---
### [Global Finance News Today: US-Iran Ceasefire, Markets, Earnings and Oil Prices](https://df.media/global-finance-news-today-us-iran-ceasefire-markets-earnings-and-oil-prices/)
**Published:** April 22, 2026
**Author:** Vishnu Priya
**Content:**
Global financial markets on April 22, 2026 are navigating a complex mix of geopolitical developments, heavy corporate earnings, and shifting commodity prices. The indefinite extension of the US-Iran ceasefire is the dominant macro theme driving cross-asset moves today, while investors simultaneously monitor a packed earnings calendar featuring Tesla, IBM, Boeing, and Texas Instruments.
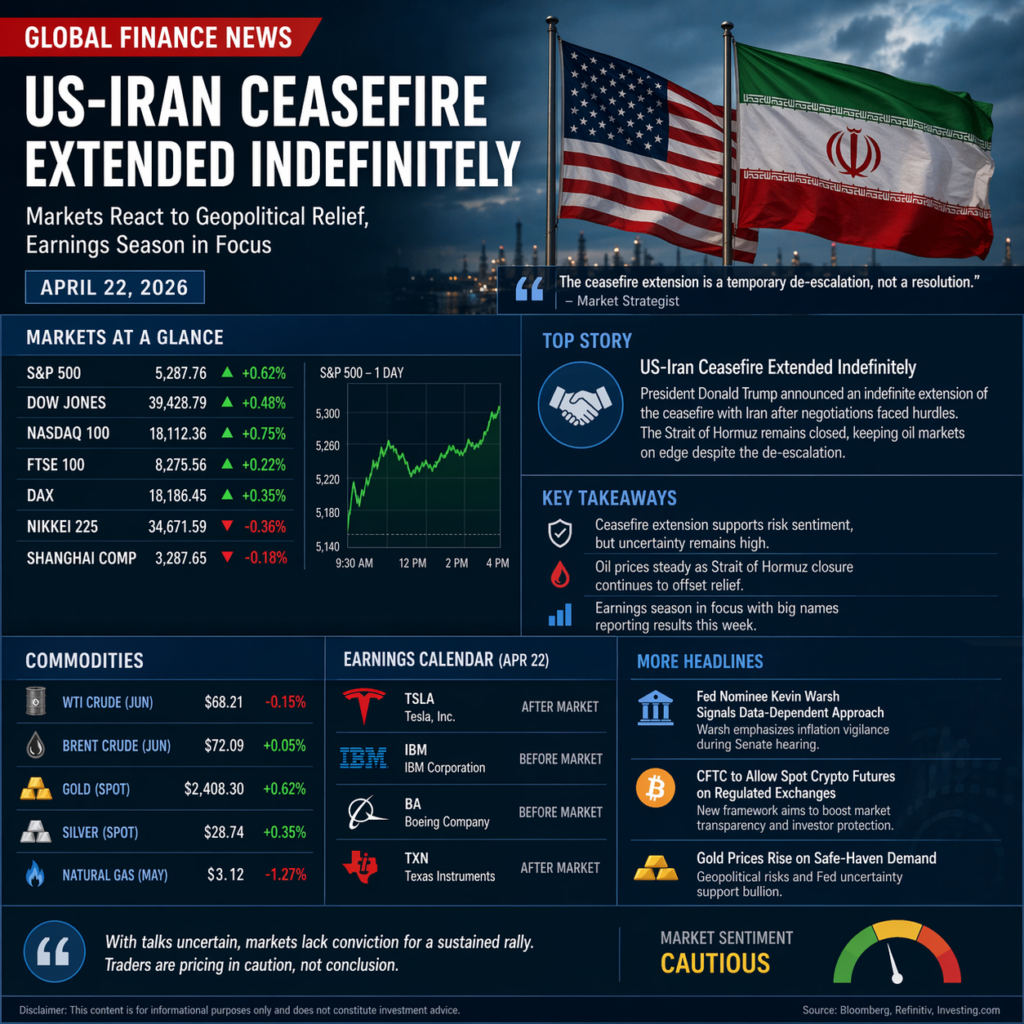---
### US-Iran Ceasefire Extended: What It Means for Markets
President Donald Trump announced an indefinite extension of the ceasefire with Iran on Tuesday evening, after reports emerged that Vice President JD Vance’s trip to join negotiations was paused due to a lack of commitment from Tehran. The extension was welcomed by equity markets but failed to produce a clear directional move in oil, given that the Strait of Hormuz remains closed and a comprehensive resolution appears distant.
Strategists note that with the outcome of talks still uncertain, markets lack the conviction needed for a sustained rally. The ceasefire extension is best understood as a temporary de-escalation rather than a resolution, and traders are pricing it accordingly.
---
### Stock Markets: US Indices and Global Equities
US equities closed Tuesday in negative territory ahead of the ceasefire announcement. The S&P 500 fell 0.63% to close at 7,064.01, the Nasdaq Composite declined 0.59% to 24,259.96, and the Dow Jones Industrial Average shed approximately 293 points to finish at 49,149.38. The sell-off was driven primarily by nervousness over the fate of the Iran peace talks before Trump’s announcement.
On Wednesday, European markets opened higher, tracking improved sentiment from US futures. Major indices including the DAX and FTSE 100 posted gains at the open. In Asia, South Korea’s Kospi hit a record high of 6,388.47, gaining 2.72%, led by Samsung Electronics and SK Hynix. China’s Shanghai Composite edged higher on domestic stimulus expectations, while Japan’s Nikkei 225 slipped on yen strength.
---
### Earnings Season: What to Watch on April 22
April 22 is one of the heaviest single-day earnings releases of the season. Tesla reports after market close and is under particular scrutiny for production targets and profit margins amid intensifying global EV competition. Texas Instruments will provide critical insight into semiconductor demand trends. IBM, Boeing, AT&T, ServiceNow, Southwest Airlines, Lam Research, and Boston Scientific are also reporting today.
Key premarket moves heading into Wednesday’s session: GE Aerospace shares dropped roughly 6% after its CEO linked elevated energy prices to a potential pullback in airline maintenance work. Boston Scientific rose 1.2% on strong quarterly results. Adobe gained 2.8% after announcing new generative AI features across its product suite.
---
### Oil Prices: Ceasefire Eases Supply Fear But Uncertainty Persists
Brent crude futures fell 0.2% to $98.27 per barrel on Wednesday, while US West Texas Intermediate dropped to $89.39 per barrel. Both benchmarks had gained approximately 3% in the prior session before the ceasefire extension was confirmed. The slight pullback reflects investor relief at the diplomatic progress, tempered by the reality that the Strait of Hormuz remains closed and no full agreement is in sight.
US crude inventories are projected to have drawn down by approximately 4.5 million barrels for the week ended April 17, a figure that could provide upward price support if confirmed by official data.
High crude prices continue to pressure central banks globally, reducing market expectations for near-term interest rate cuts. Several S&P 500 CEO earnings call transcripts this week cited energy costs as a primary business risk factor.
---
### Gold and Commodities
Gold rebounded nearly 1% to approximately $4,768 per ounce on Wednesday, snapping a two-day losing streak. The move was supported by a softer dollar, continued geopolitical uncertainty, and safe-haven demand. Silver retreated 1.8% to around $77.80 per ounce during Asian trading despite the gold price recovery. Copper prices slid on profit-taking as investors rotated out of defensive positions following the temporary improvement in Middle East risk sentiment.
---
### Federal Reserve: Warsh Hearing and Rate Cut Expectations
Fed Chair nominee Kevin Warsh appeared before the Senate Banking Committee on Tuesday in a closely watched confirmation hearing. Warsh denied making any promises to President Trump regarding future rate cuts and sought to establish his independence from White House influence. He backed the role of digital assets within the US financial system and outlined what observers described as a regime-change plan for the Federal Reserve.
Fed nominee Kevin Warsh’s confirmation hearing comes at a sensitive moment. Elevated energy costs are keeping inflation stickier than markets had hoped, and expectations for near-term rate cuts have been scaled back significantly across the US, UK, and European markets. UK inflation data expected this week is forecast to show marginal deceleration but remain above the Bank of England’s 2% target.
---
### Global Trade: Critical Minerals and Supply Chain Talks
The US trade representative urged allied nations to pay a national security premium for critical minerals not sourced from China. The proposal involves a coalition of trading partners setting minimum pricing floors for non-Chinese sourced minerals, combined with steep tariffs on outside producers. Trade official Jamieson Greer argued that decades of prioritizing cost efficiency created dangerous Western dependence on Beijing for key industrial inputs.
Separately, the US Commerce Secretary initiated supply chain diversification talks with a major Asian partner, and the Trump administration is reportedly in early discussions over a currency swap line with the United Arab Emirates.
---
### Crypto: Perpetual Futures, Kraken, and Bitcoin
The US crypto market is preparing for a significant regulatory shift. Trump’s CFTC Chair nominee Michael Selig indicated the agency plans to fully approve perpetual crypto futures products, a high-leverage derivatives instrument popular offshore. In anticipation, Kraken acquired Bitnomial for up to $550 million to establish perpetual futures capability in the US market. Coinbase has been positioning itself with long-dated futures contracts designed to replicate perpetuals ahead of the rule change.
Bitcoin held near the $60,000 level overnight, consolidating despite minor outflows from US spot BTC exchange-traded funds. Cantor Fitzgerald raised its Coinbase price target to $250, maintaining an Overweight rating based on the company’s expanding product outlook.
---
### Key Data Points Summary
**S&P 500:** 7,064.01 (down 0.63% Tuesday)
**Dow Jones:** 49,149.38 (down 293 points Tuesday)
**Nasdaq:** 24,259.96 (down 0.59% Tuesday)
**Brent Crude:** $98.27/barrel (down 0.2%)
**WTI Crude:** $89.39/barrel (down 0.3%)
**Gold:** $4,768/oz (up ~1%)
**Silver:** $77.80/oz (down 1.8%)
**Bitcoin:** ~$60,000 (stable)
---
### Conclusion
April 22, 2026 presents investors with a classic risk-on, risk-off tension. The US-Iran ceasefire extension has temporarily improved sentiment, but the absence of a concrete resolution keeps uncertainty elevated across oil, currencies, and equities. A historically heavy earnings day adds company-level volatility on top of an already complex macro backdrop. Traders and long-term investors alike will be watching Tesla’s results after close as the day’s most consequential single data point.
**Categories:** Banking
---
### [Algreen Capital: Pioneering Investments With Purpose](https://df.media/algreen-capital-pioneering-investments-with-purpose/)
**Published:** April 21, 2026
**Author:** Vishnu Priya
**Excerpt:** Discover Algreen Capital, a future-focused family office investing in property, AI, blockchain, media, and impact ventures through iBig with ESG and SDG leadership.
**Content:**
### Welcome to Algreen Capital
Algreen Capital is a forward-thinking family office built on the belief that successful investing should create more than financial returns. While traditional investment models often focus purely on short-term gains, Algreen Capital takes a broader and more strategic view. The firm believes that long-term wealth creation is strongest when capital supports businesses, ideas, and assets that improve lives, strengthen communities, and contribute to a healthier planet.
This philosophy has helped position Algreen Capital as a modern investment group focused on both growth and meaningful impact. At a time when many firms are only recently adapting to sustainability trends, Algreen Capital was founded with purpose embedded into its investment DNA.
The firm recognises that tomorrow’s strongest opportunities will come from businesses solving real-world problems through innovation, responsibility, and scalable commercial models.
---
## A Diversified Investment Strategy
Algreen Capital operates across a wide range of sectors and asset classes. This diversified investment model enables the firm to manage risk effectively while identifying opportunities in industries shaping the future global economy.
Its portfolio interests include:
- Property and real estate
- Publicly listed companies
- Private and unlisted businesses
- Bonds and fixed income assets
- Blockchain infrastructure
- Artificial intelligence
- Media and communications
- Emerging technologies and innovation sectors
This broad exposure creates resilience while allowing the firm to participate in long-term growth trends. Every investment is approached with discipline, strategic analysis, and a commitment to sustainable value creation.
Rather than chasing short-term hype cycles, Algreen Capital focuses on businesses and assets with durable relevance, strong leadership, and long-term commercial potential.
---
## Why the Family Office Structure Matters
One of Algreen Capital’s greatest strengths is its family office structure. Unlike institutional funds that often face quarterly reporting pressures, investor redemption cycles, or narrow mandates, family offices have the flexibility to think long term.
This creates several strategic advantages.
### Long-Term Thinking
Algreen Capital can remain invested through market volatility and economic cycles, allowing strong businesses time to compound value.
### Flexible Capital Allocation
The firm can move quickly across sectors and opportunities without being constrained by rigid mandates.
### Better Alignment
Investment decisions are based on conviction, fundamentals, and long-term outcomes rather than short-term optics.
### Support for Innovation
Many transformative companies need patient capital before mainstream markets fully recognise their value. Algreen Capital is designed to provide that support.
This structure is especially powerful in sectors such as clean technology, healthcare innovation, AI, digital infrastructure, and responsible finance.
---
## Investing With Purpose
Algreen Capital believes that financial returns and positive impact increasingly go hand in hand. Businesses that solve meaningful challenges often become stronger, more resilient enterprises over time.
This includes companies that:
- Improve efficiency
- Expand access to services
- Reduce waste
- Support inclusion
- Build trust and transparency
- Strengthen sustainability
Purpose is not treated as an afterthought or branding exercise. It is integrated directly into the firm’s investment philosophy.
Every opportunity is considered not only for its commercial upside, but also for its ability to contribute to a stronger and more sustainable future.
---
## Founding Parent of iBig
Algreen Capital is the founding parent company and lead investor behind **Impact Business Investment Group (iBig)**.
iBig is a specialist investment platform focused on supporting and accelerating businesses that create measurable positive change across society and the environment.
Its target sectors include:
- Clean energy
- Sustainable infrastructure
- Financial inclusion
- Responsible artificial intelligence
- Healthcare access
- Education innovation
- Circular economy solutions
By focusing on measurable outcomes, iBig stands apart from many investment groups that discuss ESG principles without embedding them deeply into strategy.
Supported by Algreen Capital’s long-term capital base and strategic leadership, iBig operates as a serious platform for growth and impact.
---
## ESG and SDG Leadership
A defining feature of iBig is its strong alignment with ESG principles and the **United Nations Sustainable Development Goals (SDGs)**.
The SDGs offer a globally recognised framework for progress across major global priorities such as:
- Climate action
- Reduced inequalities
- Innovation and infrastructure
- Health and wellbeing
- Education
- Responsible consumption
- Economic opportunity
For Algreen Capital and iBig, these frameworks help ensure impact is credible, measurable, and aligned with internationally recognised standards.
This disciplined approach creates stronger accountability, clearer positioning, and more meaningful long-term outcomes.
---
## Investing in the Future Economy
Markets are changing rapidly. Technology disruption, changing consumer expectations, regulatory shifts, and environmental pressures are reshaping how capital is deployed around the world.
Algreen Capital is positioned for this transition through investments in future-focused sectors.
### Artificial Intelligence
Backing businesses using AI to improve productivity, healthcare, finance, and operational efficiency.
### Blockchain
Supporting decentralised systems that improve ownership transparency, financial access, and digital infrastructure.
### Media
Investing in businesses that shape communication, trust, audience engagement, and information distribution.
### Sustainable Real Assets
Property and infrastructure investments aligned with long-term demand and resilience.
By combining exposure to established sectors and emerging innovation, Algreen Capital creates a balanced platform for growth.
---
## Why Founders and Partners Choose Algreen Capital
Modern founders often seek more than funding. They want strategic investors who understand growth, innovation, and long-term mission alignment.
Algreen Capital offers:
- Long-term investment perspective
- Flexible decision-making
- Multi-sector expertise
- Strong impact credentials through iBig
- Strategic support beyond capital
This makes the firm attractive to entrepreneurs building ambitious businesses with real purpose.
---
## A New Model of Capital
Traditional investing often treated profit and purpose as separate goals. Algreen Capital represents a more advanced model where both can reinforce each other.
The firm understands that tomorrow’s strongest businesses are likely to be those solving real needs, adapting responsibly, and building trust in changing markets.
That insight shapes every part of the organisation—from direct investments to the development of iBig and its impact ecosystem.
---
## Pioneering Investments With Purpose
Algreen Capital is more than an investment firm. It is a future-focused family office helping redefine how capital can be deployed in the modern world.
Through diversified investments, disciplined long-term thinking, and meaningful commitment to ESG and SDG principles, Algreen Capital continues to build a portfolio designed for both performance and progress.
For investors, founders, and partners seeking a smarter model of growth, Algreen Capital offers a compelling vision of modern investing.
**Pioneering Investments. With Purpose.**
**Categories:** Banking
---
### [Wall Street Hits the Brakes: Oil Prices Skyrocket as Historic Refund Portal Opens](https://df.media/wall-street-alert-oil-nears-100-175b/)
**Published:** April 20, 2026
**Author:** Vishnu Priya
**Excerpt:** Oil nears $100 as Iran shuts Strait & $175B tariff refunds go live. Wall Street updates for April 20, 2026.
**Content:**
If you feel like the economy is moving in two different directions today, you are right. This Monday, April 20, 2026, Wall Street is dealing with a massive split. On one side, we have a major energy crisis in the Middle East pushing oil prices toward $100. On the other, the U.S. government just opened a portal to give $175 billion back to American businesses.
As your top source for financial news, I am breaking down exactly what this means for your wallet and your portfolio.
---
### 1. The Energy Crisis: Why Gas Prices are Climbing
The biggest headline today is the closure of the Strait of Hormuz. This narrow waterway is the most important path for oil in the world. Over the weekend, the situation between the U.S. and Iran got much worse. After a U.S. ship seizure and military tension, Iran shut down the strait.
- **The Price Jump:** Brent Crude oil prices shot up over 6% to reach $95.92. U.S. oil followed, jumping more than 7% to hit $90.
- **The Big Picture:** About 20% of the global oil supply is now stuck. This is causing a shock to the system. While stock markets in Asia stayed steady, U.S. futures are down because investors worry that high energy costs will keep inflation high.
---
### 2. The $175 Billion Payback: A Win for Businesses
In a major piece of domestic news, the U.S. Customs and Border Protection officially launched the CAPE portal today. This is a huge deal for companies that import goods.
A recent Supreme Court ruling found that certain past tariffs were illegal. Now, the government has to pay that money back.
- **A Massive Refund:** There is about $175 billion waiting to be claimed. Over 56,000 businesses have already signed up to get their share.
- **FedEx Leads the Way:** Big companies like FedEx are already filing claims today. They plan to pass some of these refunds back to their customers, which could help lower costs for some services.
- **New Obstacles:** Even as this money goes out, new 50% tariffs on metals like steel and copper just started this month. The government is giving money back with one hand and taking it with the other.
---
### 3. The Struggle on Main Street
While big corporations are waiting for refund checks, everyday Americans are feeling the pinch. A famous study from the University of Michigan shows that consumer confidence is at an all-time low.
It is hard to feel good about the economy when inflation is at 3.3% and gas prices are up nearly 19% compared to last year. Most people are seeing their paychecks buy less at the grocery store, even as the stock market tries to stay strong.
---
### 4. Winners in the Chaos: Tech and Bitcoin
Even with all the bad news, a few areas are still growing fast:
- **Sigma Lithium (SGML):** This stock jumped 32.8% today. They secured $100 million to double their production. It shows that investors still believe in green energy, even when oil prices are crazy.
- **Bitcoin (BTC):** The digital currency is holding steady near $74,500. Traders are waiting to see if big investors like Michael Saylor make another massive purchase today.
---
### 📅 What to Watch This Week
- **Peace Talks:** U.S. officials are meeting in Pakistan tonight. If they can get the Strait of Hormuz reopened, oil prices will drop fast. If they fail, $100 oil is likely by tomorrow.
- **Interest Rates:** The Federal Reserve is watching these oil prices closely. If energy costs stay this high, the Fed might wait much longer before cutting interest rates.
---
### ❓ Common Questions
**What is the CAPE portal?** It is a new website where businesses can claim refunds for tariffs that the Supreme Court ruled were illegal. It launched today, April 20.
**Why is oil so expensive right now?** It is mainly because of the conflict in the Middle East. Since the Strait of Hormuz is closed, there is less oil available for the world to use, which drives the price up.
**Are we in a recession?** Not officially. The economy is growing very slowly, and prices are high. This is what experts call stagflation. It means the economy is not shrinking, but it does not feel healthy for most people.
---
**The Bottom Line:** We are seeing a divided economy. If you are in the tech or energy business, things are looking up. If you are a consumer trying to pay for gas and food, it is a tough time. That $175 billion refund is a massive wildcard—it could be the boost the economy needs to stay afloat during this oil crisis.
**Categories:** Banking
---
### [🚨 TRENDING: Trump Tariffs Return by July, Fed Beige Book Drops Tonight, Bitcoin Rallies to $71K — Global Markets React](https://df.media/fed-beige-book-tonight-bitcoin-71k-rally/)
**Published:** April 15, 2026
**Author:** Vishnu Priya
**Content:**
**Live · Updated: Wednesday, April 15, 2026 \| 10:00 AM IST
Global Trade \| Central Banks \| Crypto \| Markets**
> BREAKING: Trump Tariffs Are Coming Back Bessent Confirms July Deadline
The trade war is officially back on the table. U.S. Treasury Secretary Scott Bessent announced this morning that Section 301 studies are now underway to restore President Trump’s previous tariff levels by early July, marking a decisive shift in Washington’s trade policy following a Supreme Court setback.
Bessent’s statement came as European leaders in Brussels began emergency discussions on coordinated retaliatory measures, signaling that a full-scale transatlantic trade conflict could be on the horizon. The EU is preparing a unified response should the U.S. proceed with restoring higher tariff walls.
**Court Battle Over Section 122 Tariffs Heats Up**
Meanwhile, a specialized federal court is hearing arguments against Trump’s temporary 10% Section 122 global tariffs. The legal challenge represents one of the most significant tests of the administration’s trade authority. Businesses across manufacturing, agriculture, and consumer goods sectors are watching closely, as any ruling could reshape import costs for thousands of products.
Bessent also revised his economic outlook dramatically, stating that U.S. GDP growth could easily exceed 3.5% this year despite geopolitical headwinds. The comment signals confidence in domestic resilience even as trade tensions escalate.
**Fed Beige Book Drops Tonight — Regional Price Pressures in Focus**
Wall Street is bracing for one of the Fed’s most closely watched releases. The Federal Reserve Beige Book publishes tonight, offering anecdotal evidence on economic conditions across all 12 Federal Reserve districts.
The key focus is regional price pressures. After weeks of Middle East-driven energy volatility, Fed officials have signaled that their rate cut path in 2026 now depends more heavily on incoming inflation, energy, and labor data. A single rate cut this year is expected, but only if energy prices stabilize and wage growth cools.
FOMC minutes released earlier highlighted that prolonged conflict in the Middle East could lead to more persistent energy price increases, directly impacting core inflation. The Fed is now in a holding pattern, waiting for data to guide its next move.
**Bond Market Reacts: 10-Year Treasury Yield Dips**
The 10-year Treasury yield dropped slightly as investors positioned ahead of the Beige Book release. The marginal decline reflects caution, as markets are pricing in uncertainty around both inflation and the Fed’s response. The US Dollar Index (DXY) saw minor gains, showing that currency traders are also bracing for the report’s impact.
**Bitcoin Rallies to Mid-$70,000s — Coinbase Shares Surge 6.9%**
Crypto markets are back in risk-on territory. Bitcoin has rebounded to the mid-$70,000 range, holding above $71,000 even as total crypto market cap dipped 2.89% over the 24-hour snapshot.
Coinbase shares rallied 6.9% in sympathy with the broader crypto move, a strong signal that institutional appetite for digital assets remains intact. Adding to the positive momentum, Coinbase received conditional approval for a federally chartered trust structure, expanding its custody services and strengthening its regulatory positioning with the OCC.
**New Crypto Regulation Framework Emerges in Congress**
US lawmakers have introduced draft legislation for a comprehensive digital asset regulatory framework targeting stablecoins and exchanges. The bill aims to provide clear guidelines for stablecoin issuance and increase oversight of major crypto platforms, a move that could bring much-needed clarity to the industry.
Separately, the Concodium (CCD) network announced a strategic partnership with a major Asian tech firm for supply chain integration, signaling continued blockchain adoption beyond speculative trading.
**S&P 500 Futures Point Higher — Tech Leads the Recovery**
After days of geopolitical-driven volatility, S&P 500 futures are pointing higher as Wall Street looks to recover. The modest rebound is being led by large-cap technology stocks, with Alphabet (Google) up 3.25% and NVIDIA climbing 2.82% as AI enthusiasm continues to fuel the semiconductor sector.
Large-cap tech stocks continue to drive S&P 500 performance, disproportionately outweighing the equal-weighted index. This concentration risk remains a key concern for strategists, as the market’s health is increasingly tied to a handful of mega-cap names.
Citigroup and Johnson & Johnson both reported Q1 earnings that exceeded analyst expectations, lifting financial and healthcare sectors across the board.
**Oil Retreats Below $90 — Brent Crude Slips on Peace Talk Reports**
In a notable reversal from last week’s $104 peak, Brent crude slipped below $90 as reports of progress in Middle East peace talks emerged alongside continued U.S. Hormuz blockade operations. The pullback suggests traders are beginning to price in a potential diplomatic resolution.
US crude oil production levels also saw a minor decline amid maintenance shutdowns, providing marginal support to prices. The energy sector remains a top recommendation from major investment banks, with one large firm issuing an overweight stance on energy stocks citing the persistent geopolitical premium.
**Gold Holds Near $2,350 — Safe-Haven Demand Persists**
Gold prices stabilized after their recent surge, trading near $2,350 per ounce. The safe-haven metal maintains elevated levels as geopolitical concerns and inflation fears continue to support demand.
**Industrial Metals Surge — Copper Leads on Chinese Demand**
Copper and other industrial metal prices jumped sharply on renewed Chinese demand data. Better-than-expected industrial output and consumption figures from Beijing sent commodity traders rushing back into base metals, a sign that the world’s second-largest economy may be stabilizing faster than anticipated.
**European Stagflation Fears Mount After Weak PMI Data**
European fund managers are expressing growing caution after softer-than-expected Purchasing Managers’ Index (PMI) data across the eurozone. The stagflationary risk, which means slow growth paired with persistent inflation, is now a mainstream concern among institutional investors.
The European Central Bank (ECB) is widely expected to hold rates steady at 2.15% at its late April meeting, mirroring the Fed’s cautious stance.
**Emerging Markets Outperform — EM Equities Buck the Trend**
While US and European markets navigate volatility, emerging market equities continue to outperform in April. EM indices finished in positive territory, reflecting investor rotation toward higher-growth, lower-valuation markets as developed economy uncertainty persists.
**Categories:** Banking
---
### [TRENDING NOW: Oil Breaks $100, Markets Plunge, Stagflation Fears Return](https://df.media/oil-tops-100-as-u-s-navy-blockades-iran/)
**Published:** April 13, 2026
**Author:** Vishnu Priya
**Content:**
**Live · Updated: Monday, April 13, 2026 \| Global Finance · Energy · Markets**
---
## BREAKING: Oil Tops $100 as U.S. Navy Blockades Iran
**This is the largest oil supply disruption in modern history.**
Crude oil has officially crossed the $100 barrier, with WTI crude futures spiking nearly 8% to $104.20 per barrel, and Brent crude climbing 7% to $101.86. The surge comes as the U.S. Navy prepares to enforce a full naval blockade on Iranian ports, beginning Monday at 10 a.m. ET.
The move marks a dramatic escalation in the ongoing U.S.–Iran conflict and has already sent shockwaves through global energy markets.
The blockade, announced by U.S. Central Command, will target all maritime traffic entering or exiting Iranian ports — while sparing vessels transiting to non-Iranian destinations. President Donald Trump took to Truth Social, declaring: “The United States Navy, the Finest in the World, will begin the process of BLOCKADING any and all Ships trying to enter, or leave, the Strait of Hormuz.”
## Why This Oil Price Surge Is Different
This isn’t just another oil price volatility event. Three factors make this moment unique:
**1. The Strait of Hormuz crisis is at its peak.** The narrow waterway — responsible for nearly 20% of global oil supply — has seen tanker traffic plummet from over 100 daily vessels to just a handful. Three supertankers made the crossing on Saturday, but that is a fraction of pre-war levels.
**2. The Trump Hormuz blockade announcement is now policy.** U.S. Central Command has confirmed the U.S. will interdict any ship in international waters that has paid Iran a toll to transit the strait. Iranian senior advisor Ali Akbar Velayati responded that the “key to the Strait of Hormuz” remains in Iran’s hands.
**3. This is the largest oil supply disruption on record.** With Middle East oil producers cut off from their primary export route, supply chains are facing the tightest squeeze since the 1973 oil crisis.
## U.S. Navy Iran Ports Blockade: What Happens Monday
At 10 a.m. ET Monday, the U.S. Navy begins enforcement across all Iranian ports on the Arabian Gulf and Gulf of Oman. The blockade will be enforced impartially against vessels of all nations, marking a significant shift in how Washington is approaching the Middle East oil supply disruption.
Meanwhile, President Trump is reportedly considering limited strikes on Iran to break the diplomatic stalemate, according to The Wall Street Journal. The combination of a naval blockade and potential military action has traders pricing in a crude oil price surge that could push WTI toward $120 per barrel.
---
## The Talks Failed: JD Vance Returns from Islamabad Without a Deal
Peace negotiations in Islamabad collapsed over the weekend, with U.S. Vice President JD Vance leaving without any agreement after Iran refused to commit to abandoning its nuclear program.
The U.S.–Iran negotiations in Islamabad had raised hopes for a ceasefire extension, but Tehran’s leadership, including Mohammad-Bagher Ghalibaf, accused Washington of failing to earn trust. Iran is now demanding control over the Strait of Hormuz, war reparations, and the release of frozen assets.
Pakistan officials say they will attempt to restart talks in the coming days. But for now, the gap between Washington and Tehran has only widened.
---
## INFLATION SPIKE: U.S. CPI Hits 3.3%, Fed to Hold Rates
The macroeconomic picture just got darker. The March 2026 CPI report revealed U.S. headline inflation at 3.3% year-over-year, driven primarily by soaring energy prices as gasoline costs jumped alongside crude.
**What this means for the Federal Reserve:**
The March CPI report has essentially ended any near-term hopes of rate cuts. The Fed is now expected to hold rates steady, prioritizing inflation control over growth support. The Fed’s 2026 rate decision is likely to keep monetary policy tight as long as energy-driven inflation persists.
**IMF cuts 2026 global growth outlook.** In a concerning parallel development, the International Monetary Fund has announced plans to downgrade its worldwide growth forecasts for 2026, citing geopolitical risk and the ongoing Middle East conflict as key headwinds.
**Stagflation risk 2026 is now a mainstream concern.** The combination of slowing global growth and persistent inflation has economists and market strategists dusting off a term last seen in the 1970s: stagflation. Higher energy costs and GDP pressure are creating a perfect storm where traditional policy tools lose effectiveness.
## The IMF Stagflation Warning: What Markets Are Missing
The IMF’s decision to cut global growth forecasts while inflation remains stubborn represents the worst possible scenario for investors. Central banks and the energy shock are now operating at cross purposes — raising rates to fight inflation could trigger recession, while easing to support growth risks unleashing further price pressures.
Energy prices are now the primary transmission channel from geopolitics to consumer wallets. Oil at $104 per barrel and Brent crude above $101 mean gasoline prices will keep pushing headline inflation higher, regardless of what the Fed does.
---
## DOW FUTURES DROP 500 POINTS: Markets Open in Panic Mode
**The market reversal is stunning.**
Just one week ago, the S&P 500 rallied 3.6% on ceasefire hopes, marking its best week since November. The Dow gained 3%, and the Nasdaq jumped nearly 4.7%. That optimism evaporated overnight.
**Dow futures are down 517 points, or 1.1%. S&P 500 futures fell 1.1%, and Nasdaq 100 futures shed 1.2%** as Monday morning trading began. Stock futures fell on the Hormuz blockade announcement, with traders rapidly repricing risk across every asset class.
## Asia Markets Decline on Oil Shock
The contagion spread instantly across the Asia-Pacific session:
| Market | Performance | Key Driver |
|---|---|---|
| India Nifty 50 | -2.0% | Energy import exposure |
| Japan Nikkei 225 | -1.09% | Oil price sensitivity |
| Hong Kong Hang Seng | -1.22% | Geopolitical risk-off |
| South Korea Kospi | -1.26% | Export slowdown fears |
| Australia S&P/ASX 200 | -0.53% | Commodities mixed |
India’s Nifty 50 emerged as the worst performer among major Asian indices, reflecting how energy-importing emerging markets face the dual pressure of higher oil costs and currency weakness.
The Nikkei and Nifty fall today mirrors the broader risk-off sentiment gripping global equities. With crude oil price surge today sending energy costs higher, Asian economies that rely heavily on imported oil are feeling the pinch immediately.
## Why Wall Street Banks Matter This Week
Adding complexity to the sell-off, first-quarter earnings season kicks off this week. Goldman Sachs reports Monday, followed by Citigroup, Wells Fargo, JPMorgan Chase, Morgan Stanley, and Bank of America throughout the week.
The Goldman Sachs Q1 2026 earnings could provide crucial insight into how trading desks are positioning for geopolitical risk and equities. If banks flag energy exposure or credit deterioration from oil price spikes, the market reaction could deepen.
---
## Key Themes at a Glance: What’s Moving Markets Today
| Theme | What’s Happening | Why It Matters |
|---|---|---|
| **Oil prices above $100** | WTI and Brent surge on U.S. Navy Iran ports blockade | Energy costs push inflation higher globally |
| **Strait of Hormuz crisis** | Tanker traffic collapsed from 100+ daily to a handful | 20% of global oil supply at risk |
| **U.S. inflation 3.3% March 2026** | CPI driven by gasoline and energy | Fed expected to hold rates indefinitely |
| **IMF cuts 2026 global growth** | Downgrade cites Middle East conflict | Stagflation risk enters mainstream |
| **Dow futures drop 500 points** | S&P 500, Nasdaq futures off ~1% | Ceasefire optimism replaced by risk-off |
| **Asia markets decline** | Nikkei, Nifty, Kospi, Hang Seng all down | Energy importers hit hardest |
| **Trump Hormuz blockade** | U.S. Navy to interdict Iran-linked shipping | Potential for direct military escalation |
---
## What Traders Need to Know Right Now
## The Three-Pressure Framework
Markets are navigating three overlapping forces simultaneously:
**1. Rising oil prices and crude oil price surge today** — WTI at $104+, Brent above $101 — are feeding directly into global inflation. The Middle East oil supply disruption is the tightest on record, with the Iran war impact on oil now being priced into every energy-linked asset.
**2. Geopolitical risk and equities** are at their most fragile level since the war began. The U.S.–Iran negotiations in Islamabad collapsed, and the U.S. Iran war market impact is now a daily headline. Trump is considering limited strikes on Iran, which could trigger a further geopolitical risk spike.
**3. Economic uncertainty and the stagflation risk 2026** is the macro backdrop. The IMF’s decision to cut global growth forecasts alongside the U.S. March CPI report at 3.3% creates a policy trap where central banks can neither fight inflation nor support growth effectively.
## The Scenarios Ahead
| Scenario | Probability | Oil Price Target | Market Impact |
|---|---|---|---|
| Blockade holds, no escalation | 40% | $110–$120/bbl | Gradual equity stabilization |
| Limited strikes on Iran | 35% | $130+/bbl | Sharp equity sell-off, flight to safety |
| Diplomatic breakthrough | 25% | $85–$95/bbl | Sharp relief rally, V-shaped recovery |
---
## The Bottom Line: Volatility Is the New Normal
The global economy has entered a regime where geopolitical events, not fundamentals, dominate pricing. Oil crossing $100 is a watershed moment — it signals that energy security is now the primary driver of inflation, growth, and market sentiment.
For investors: defensive positioning, energy hedges, and reduced exposure to rate-sensitive sectors are the logical response. The risk-off sentiment global markets are showing today could persist for weeks.
For businesses: supply chain resilience and energy cost hedging are no longer optional. The energy market geopolitical risk is structural, not cyclical.
For policymakers: the stagflation trap is real. The Fed holding rates while the IMF cuts growth forecasts creates a narrowing window for soft landings.
This isn’t a blip. This is the new baseline. And in this environment, agility beats prediction every time.
**Categories:** Banking
---
### [US Stock Futures Slip as Economic Signals Turn Cautious](https://df.media/us-stock-futures-slide-as-weak-data-challenges-growth/)
**Published:** April 10, 2026
**Author:** Vishnu Priya
**Content:**
US stock futures moved lower today, reflecting a market that is beginning to question the strength of the economic recovery. The shift comes as fresh data on jobless claims and economic growth signals a more fragile outlook than investors had priced in.
Futures linked to the Dow Jones Industrial Average declined 0.3 percent, while the S&P 500 slipped 0.2 percent. The Nasdaq 100 edged down 0.1 percent, showing relative resilience but still aligning with the broader cautious tone across markets.
This is not a sharp selloff. It is something more subtle and potentially more important. Confidence is starting to soften.
**Labor Market Momentum Begins to Slow**
A key trigger behind today’s movement is the latest increase in initial jobless claims. While the rise is not dramatic, it signals that the labor market may be losing some of its strength after a long period of resilience.
For months, strong employment has supported consumer spending and corporate performance. Now, even early signs of weakness are enough to shift sentiment.
Investors understand the implication clearly. If hiring slows or layoffs increase, spending power weakens. That feeds directly into earnings expectations and broader economic growth.
The concern is not where the labor market stands today, but where it could be heading next.
**Growth Revision Changes the Narrative**
At the same time, a downward revision to fourth-quarter economic growth has added pressure to the outlook. The US economy is still expanding, but at a slower pace than previously estimated.
This revision matters because markets had been operating under a “soft landing” assumption. That scenario depends on steady growth, stable employment, and easing inflation.
Today’s data introduces friction into that story.
Growth is still there, but the margin for error is getting smaller. And markets are highly sensitive to that shift.
**Investors Shift from Optimism to Caution**
The reaction in futures markets highlights a broader change in investor behavior. Over recent months, markets have been driven by optimism around rate cuts and economic resilience.
Now, that optimism is being tested.
Instead of pricing in a smooth path forward, investors are beginning to prepare for a more uneven environment. This includes slower growth, policy uncertainty, and increased volatility across asset classes.
The declines in futures are relatively modest, but they reflect hesitation. And hesitation often signals a turning point in market psychology.
**Federal Reserve Faces a Strategic Dilemma**
The latest data also complicates the outlook for the Federal Reserve.
Weaker growth and rising jobless claims would typically support the case for interest rate cuts. However, inflation remains a concern, limiting how quickly policymakers can act.
This creates a challenging balance.
If the Fed moves too quickly to ease policy, inflation risks could resurface. If it waits too long, the economy could slow more sharply. Investors are now adjusting expectations, with many anticipating a more cautious and delayed approach to rate cuts.
This uncertainty around policy direction is adding another layer of pressure to markets.
**Markets Enter a Data-Driven Phase**
What we are seeing now is a transition in how markets operate.
Instead of being driven by broad narratives, markets are becoming increasingly dependent on incoming data. Each economic release is now carrying more weight, and each data point has the potential to shift expectations quickly.
This creates an environment where volatility is likely to increase, even in the absence of major shocks.
Short-term moves may appear small, but they are building toward a larger recalibration.
**The Bigger Picture Remains Intact, But Fragile**
It is important to keep the broader context in view. The US economy is not in a downturn. Growth is still positive, and the labor market, despite early signs of softening, remains relatively stable.
However, the trend is changing.
The combination of slower growth, rising jobless claims, and policy uncertainty suggests that the economy is moving into a more delicate phase. One where resilience is tested and assumptions are challenged.
Markets are adjusting to that reality.
**What Investors Should Watch Next**
Looking ahead, several factors will determine the next move in markets.
Labor market data will remain critical. Continued increases in jobless claims could accelerate concerns about a slowdown.
Inflation data will also play a key role. If inflation remains elevated, it could delay policy easing and add further pressure to equities.
Finally, signals from the Federal Reserve will be closely watched. Any shift in tone or policy direction could quickly reshape market expectations.
**Bottom Line**
Today’s decline in US stock futures is not about panic. It is about positioning.
Investors are beginning to recognize that the path forward may be more complex than expected. Growth is slowing, risks are rising, and policy clarity is limited.
This is the kind of environment where markets do not move in a straight line. They react, reassess, and adapt.
And right now, the message from the market is clear. The confidence that defined recent months is being replaced by caution.
**Categories:** Banking
---
### [US Iran Ceasefire Triggers Relief Rally, But Risks Remain](https://df.media/us-iran-ceasefire-triggers-relief-rally-but-risks-remain/)
**Published:** April 8, 2026
**Author:** Daniel Reynolds
**Content:**
Oil’s war risk premium is unwinding fast after a two week truce and Strait of Hormuz reopening pledge, lifting stocks and Fed rate cut hopes even as geopolitical fault lines remain exposed.
Global markets are staging a powerful relief rally after Washington and Tehran agreed to a fragile two week ceasefire that reopens the Strait of Hormuz and temporarily averts a deeper Gulf energy shock. President Donald Trump paused planned strikes on Iranian infrastructure on Tuesday night in exchange for Tehran’s promise to allow safe navigation through the world’s most critical oil chokepoint.
The deal, brokered with last minute help from Pakistan and announced just before Trump’s deadline expired, instantly knocked crude prices back below the psychologically important 100 dollar mark and triggered a sharp risk on rotation across global assets. But with both sides treating the agreement as leverage rather than peace, investors are treating the move as a tradable truce, not the end of the crisis.
## Oil’s war premium evaporates for now
West Texas Intermediate (WTI) crude futures for May delivery tumbled roughly 15% on the headline, settling around 95.63 dollars per barrel by late Tuesday in New York trading. Brent crude slid in tandem, with some estimates putting the combined intraday move above 15–17%, one of the largest single session percentage drops since the Gulf War era.
The mechanics are straightforward. For six weeks, oil had been pricing in the risk that Hormuz, which carries a big share of global seaborne crude, could be partially or fully choked off by missile strikes, mines, or harassment of tankers. That war risk premium propelled Brent toward 120–130 dollars and pushed pump prices higher worldwide. By explicitly tying the ceasefire to immediate and safe transit through the Strait, the US Iran deal removed the most extreme near term disruption scenario at least for the next 14 days.
Traders responded by aggressively unwinding long positions and volatility hedges. Both benchmarks are still well above the roughly 70 dollar pre war range, underscoring that the market is discounting a pause, not a full normalization in Gulf supplies. Any hint of attacks on tankers or infrastructure could quickly re inflate that premium.
## Equities cheer, safe havens stay alert
The oil plunge lit a fire under global stocks. US equity futures jumped, with S&P 500 contracts up over 2.5% and Nasdaq 100 futures gaining more than 3% in early trade, pointing to a strong open and pushing the S&P closer to fresh record territory. Asian markets followed through: indexes across Tokyo, Seoul and Mumbai logged gains of 3–6% as traders rushed back into cyclicals, financials and rate sensitive tech names.
Europe joined the party as well, with major benchmarks climbing on the prospect of lower energy costs and reduced tail risk to global growth. Airlines, shipping and energy intensive industrials led the rebound after weeks of underperformance.
Yet the message from safe haven assets is more nuanced. Gold, which had spiked on war fears, remains elevated even after giving back some gains, while silver and other precious metals continue to attract demand from investors hedging against both geopolitical flare ups and policy missteps. Bitcoin and other digital assets are also holding up, reflecting ongoing appetite for alternative macro hedges.
## Fed rate cut hopes get a second life
The biggest macro shift for a US audience sits in the rates market. Treasuries rallied as crude collapsed, with two year yields dropping around 7 basis points and the 10 year sliding roughly 4 basis points in early Wednesday Asia trading. That bull steepening reflects a rapid rethink of the Federal Reserve’s reaction function now that the worst case oil price spike appears less likely at least temporarily.
Before the ceasefire, the Iran war had narrowed the Fed’s already tight path to easing. Sticky core inflation, strong US labor data and 100 plus dollar oil had prompted some Wall Street houses to scrap 2026 rate cut calls entirely and even float the risk of renewed hikes. The March FOMC dot plot penciled in just one 25 basis point cut this year off a 3.50–3.75 percent policy range.
Post ceasefire, rate futures and overnight index swaps are again leaning toward a softer stance. Traders now see materially higher odds around 60% in some estimates of at least one cut by December, and some desks are tentatively reopening scenarios with two small moves if oil drifts lower and headline inflation rolls over.
For US equity investors, that combination of lower energy prices and revived Fed cut hopes is potent. It eases stagflation fears, supports valuations in growth and tech, and offers relief to credit sensitive pockets like high yield and leveraged loans that had started to wobble under higher for longer assumptions.
## Gulf risk hasn’t gone away
Despite the strong market response, the ceasefire itself is narrow, time bound and fragile. Trump has framed the deal as leverage to secure a broader settlement, while Iranian officials stress that safe passage through Hormuz will be managed by their military and subject to technical limitations, leaving room for friction.
Diplomats are scrambling to turn the two week window into a more durable framework, with talks expected in Islamabad and other regional capitals. But the underlying flashpoints Iran’s nuclear program, proxy networks, Israel’s security, and US sanctions remain unresolved.
For global investors, that means positioning for volatility rather than a straight line normalization. Energy importers from Europe to Asia gain breathing room from sub 100 dollar crude, but supply chains, shipping insurance and Gulf risk premia will continue to whipsaw with every headline out of the Strait of Hormuz.
If the truce holds and is extended, the narrative could shift toward softer inflation, friendlier central banks and a more durable risk on regime. If it breaks, markets will quickly reprice a return to triple digit oil, a tougher Fed, and renewed pressure on global growth. For now, the message from the Gulf is simple: enjoy the rally, but keep one eye on Hormuz.
**Categories:** Finance, Global News, Investing
---
### [US Stock Market Today: Iran Deadline, Oil Crisis and 5 Things Investors Must Watch](https://df.media/us-stock-market-today-iran-oil-and-5-key-risks/)
**Published:** April 7, 2026
**Author:** Vishnu Priya
**Excerpt:** Oil above $110, Trump's Iran deadline hits today. Here is what is moving US markets right now and what investors need to watch.
**Content:**
Wall Street is not having a normal Tuesday. President Trump has set an 8 p.m. deadline for Iran to reopen the Strait of Hormuz. Oil is sitting above $110 a barrel. Gas prices at the pump have hit $4.11 a gallon nationally. And every trader on the floor is watching one question: does this war end today or get a lot worse?
Here is everything moving the US stock market right now.
**1. Trump’s Iran Deadline Is the Biggest Risk in the Market Today**
On Monday, Trump reiterated his warning that the US will destroy Iran’s power plants and bridges if the nation does not reopen the Strait of Hormuz by 8 p.m. ET on Tuesday. [CNBC](https://www.cnbc.com/2026/04/06/stock-market-today-live-updates.html) That deadline is the single biggest variable hanging over markets right now.
Axios reported that the US, Iran, and a group of regional mediators were discussing terms for a potential 45-day ceasefire that could lead to a permanent end to the war, though the chances for reaching a partial deal before the Tuesday deadline were slim. [CNBC](https://www.cnbc.com/2026/04/05/stock-market-today-live-updates.html)
The market is caught between hope and fear. If a ceasefire deal comes through, expect a sharp rally. If Trump follows through on strikes, oil spikes and stocks drop fast.
**2. Oil Above $110 Is Hitting American Consumers Hard**
US oil futures rose to $111.96 a barrel, and Brent crude climbed to $110.04. The national average gasoline price reached $4.11 a gallon on Sunday, up from $2.98 before the war. In Europe, shortages forced Italy to limit supplies at several airports, while several countries in Asia have already started rationing energy. [Fortune](https://fortune.com/2026/04/05/stock-market-today-oil-prices-stock-futures-fuel-shortages-trump-threats-iran-hormuz-deadline/)
This is not just a number on a trading screen. Every business that moves goods, runs vehicles, or uses energy is paying more right now. And those costs flow directly into inflation.
Goldman Sachs strategists recently warned that persistent disruptions to global oil supplies could drag the S&P 500 down to 5,400 in 2026, representing a 22% decline from its January peak. [The Motley Fool](https://www.fool.com/investing/2026/04/06/stock-market-crash-oil-shock-economy-do-this-next/) That is not a small risk. That is bear market territory.
**3. Monday’s Session Gave Bulls Some Hope**
Despite all the tension, Monday actually closed in positive territory. The S&P 500 added 0.44% to close at 6,611.83, while the Nasdaq Composite gained 0.54% and the Dow Jones Industrial Average climbed about 165 points. [CNBC](https://www.cnbc.com/2026/04/05/stock-market-today-live-updates.html)
What drove that? Ceasefire hopes and a surprisingly strong jobs report from Friday. The US reported 178,000 new jobs in March and a 4.3% unemployment rate. [Charles Schwab](https://www.schwab.com/learn/story/stock-market-update-open) That number beat expectations and told investors the economy is still holding up despite the war pressure.
But Tuesday is a different story. S&P 500 futures and Nasdaq 100 futures opened little changed Monday night, with Nasdaq 100 futures down about 0.2%. [CNBC](https://www.cnbc.com/2026/04/06/stock-market-today-live-updates.html) Markets are waiting, not moving.
**4. The Fed Is Not Coming to the Rescue**
Investors who were hoping for rate cuts this year are now adjusting their expectations. Investors came into 2026 looking for the Federal Reserve to cut interest rates one or two times. As the second quarter kicks off, those hopes have been dashed. [Yahoo Finance](https://finance.yahoo.com/news/live/stock-market-today-us-stock-futures-rise-as-hopes-emerge-for-a-mideast-end-to-hostilities-002656513.html)
With oil this high, inflation is not cooling fast enough for the Fed to act. Higher rates for longer means tighter conditions for businesses and consumers. Mortgage rates stay elevated. Credit card costs stay high. Corporate borrowing gets more expensive.
This is the environment US companies are reporting earnings into, starting this week with Delta Air Lines and Constellation Brands reporting on Wednesday.
**5. Bright Spots: Bitcoin, Healthcare and Tech**
Not everything is suffering. Bitcoin climbed 4% Monday, nearing the $70,000 threshold as geopolitical tensions eased slightly. [The Motley Fool](https://www.fool.com/investing/2026/04/06/stock-market-today-live-coverage/)
Healthcare stocks also had a strong session. Humana popped 11%, CVS Health added 6%, and UnitedHealth Group rose 8% after the Centers for Medicare and Medicaid Services finalized a Medicare Advantage payment rate increase of 2.48% for 2027. [CNBC](https://www.cnbc.com/2026/04/06/stock-market-today-live-updates.html)
In tech, Netflix was upgraded to buy by Goldman Sachs. Tesla, however, continues to struggle, with JPMorgan maintaining its underweight rating and warning of further downside risk.
**What Happens Next**
The next 24 hours will define the market’s direction for the rest of April. If Trump’s deadline passes without escalation and ceasefire talks advance, markets could see a significant relief rally. If strikes happen, oil surges past $120 and equities take a hard hit.
Beyond that, Friday’s March CPI report will be the first major inflation reading to capture the full impact of war-driven energy prices. That number could reshape the Fed’s thinking and investor positioning for the rest of the quarter.
**Categories:** Banking
---
### [How iBig Turns Purpose-Driven Startups Into Global Businesses](https://df.media/algreen-capital-impact-investment-firm-ibig/)
**Published:** April 2, 2026
**Author:** Vishnu Priya
**Content:**
Most investors write a check and step back. iBig does the opposite. The Impact Business Investment Group was built on a straightforward but uncommon premise: capital is the easy part. What founders actually need, and rarely get, is infrastructure, strategic depth, and a partner willing to stay in the room until the work is done. With a portfolio approaching $100 million across technology and sustainability-focused ventures, iBig isn’t pitching a vision. It’s demonstrating one.
## **Beyond the Typical VC Model**
There’s a familiar frustration among ESG and enterprise tech founders who’ve raised through traditional venture capital. The funding lands, the paperwork is signed, and then the investor largely vanishes, leaving the founder to navigate the hardest parts alone. That model is inadequate for businesses operating at the intersection of sustainability and technology. These companies need real market knowledge, credible global relationships, and partners who’ve actually built something.
iBig was designed specifically to fill that gap. Working at pre-seed and seed stage, iBig embeds directly into the businesses it backs, providing strategy, execution support, market positioning, and network access as core parts of the partnership, not add-ons.
## **From Local to Global, Literally**
iBig’s stated mission, from small and local to big and global, is less a tagline than a description of what actually happens inside its portfolio. The objective isn’t incremental improvement. It’s transformation: taking a company serving one market and applying structural thinking, strategic repositioning, and network leverage to unlock global scale. The same methodology applies whether iBig is backing an early-stage startup or acquiring an established SME and rebuilding it for international reach. The difference between a local business and a global brand is rarely talent. It’s almost always access, to the right people, infrastructure, and timing. That’s what iBig provides.
## **Built for the ESG Moment**
Every business in the iBig ecosystem sits at the convergence of two forces reshaping global commerce: technology and sustainability. The timing is deliberate. Regulatory requirements around environmental responsibility are tightening across major economies. Consumer behaviour is increasingly values-driven. Institutional capital is flowing toward ESG-compliant businesses at an accelerating pace. iBig has positioned its entire portfolio to operate within and benefit from this shift.
## **A Conglomerate With a Unified Mission**
What sets iBig apart from other investment groups isn’t just how it works with individual companies. It’s what it’s building overall. The goal isn’t a collection of independent portfolio companies that happen to share an investor. It’s a globally integrated conglomerate: businesses that support each other, share resources, and operate under a unified mission to generate strong returns while creating measurable positive impact. Inside that structure, no company grows in isolation. Each one has the combined reach and experience of the entire group working behind it.
## **Is iBig Right for You?**
iBig isn’t looking for every founder. It’s looking for the right ones. Specifically, founders building at the intersection of technology and sustainability, who have genuine global ambition, and who want a true co-builder rather than a passive funding source. The ideal partner arrives with deep conviction in what they’re building and is ready to use strategic infrastructure and network access to accelerate something already strong. iBig brings the scaling engine. The founder brings the vision. The goal, exceptional returns and lasting impact, stays the same.
.iBig, the Impact Business Investment Group, goes beyond traditional investing. Instead of simply providing capital and stepping back, iBig actively partners with ESG and technology founders. Its mission is to scale purpose-driven ventures, transforming local operations into thriving global businesses.Learn more at [ibig.vc](https://www.ibig.vc/).
**Categories:** Banking
---
### [Global Markets Rebound Amid Iran War and Tech Selloff](https://df.media/global-markets-rebound-amid-iran-war-and-tech-selloff/)
**Published:** April 1, 2026
**Author:** Laura Anderson
**Excerpt:** Global markets rebound as Iran war tensions ease, but tech selloffs, AI competition, and rising yields keep investors cautious in a volatile landscape
**Content:**
**April 1, 2026**
Global financial markets are navigating a high-stakes transition, as a mix of geopolitical signals, rising bond yields, and a deepening technology sector selloff reshape investor sentiment worldwide. After a sharp correction earlier this week, markets are now attempting a fragile rebound, driven largely by expectations that tensions around the Iran conflict may ease.
However, beneath the surface, structural risks remain firmly in place suggesting that this is not a simple recovery, but a broader recalibration of global market dynamics.
## Geopolitical Signals Drive Short-Term Optimism
Investor sentiment received a temporary boost after Donald Trump indicated that the United States could exit the Iran conflict within weeks. The announcement, along with an upcoming national address, has fueled speculation that geopolitical tensions may de-escalate sooner than expected.
Markets responded quickly. U.S. futures ticked higher, while European and Asian equities showed signs of recovery. Oil prices, which had surged during the conflict, retreated below key levels as traders priced in a potential reduction in supply disruptions.
This reaction highlights a consistent pattern in global markets: even the possibility of geopolitical stability can trigger rapid inflows into risk assets.
Yet, this optimism remains highly conditional. Analysts caution that policy unpredictability continues to act as a major overhang, particularly given the shifting tone of U.S. foreign policy and its broader implications for global trade and alliances.
## Tech Sector Remains Under Pressure
While geopolitical relief has supported broader indices, the technology sector continues to face significant headwinds. The recent selloff has been both sharp and widespread, signaling a deeper shift in how investors value high-growth companies.
The Nasdaq Composite has entered correction territory, falling more than 10% from its recent highs. This decline reflects a growing reassessment of valuations, particularly among companies that have benefited from artificial intelligence-driven enthusiasm over the past year.
Several major firms have led the downturn. Shares of Meta Platforms dropped sharply following a landmark legal verdict linking social media platforms to user addiction. The ruling has raised concerns about potential regulatory changes that could impact business models built on user engagement and digital advertising.
Similarly, Alphabet Inc. saw its stock decline as the implications of the verdict extended across the broader digital ecosystem.
The selloff has not been limited to these companies. NVIDIA Corporation and Amazon also posted notable losses, reinforcing the view that this is a sector-wide correction rather than isolated weakness.
For investors, this marks a critical shift—from growth optimism to risk reassessment.
## Rising Bond Yields Tighten Financial Conditions
At the same time, macroeconomic pressures are intensifying. The surge in the 10-year U.S. Treasury yield to 4.43% is adding a new layer of complexity to the market environment.
Higher bond yields directly impact borrowing costs across the economy. Mortgage rates, business loans, and consumer credit are all becoming more expensive, which in turn can slow economic activity.
More importantly for equity markets, rising yields reduce the relative attractiveness of stocks—especially those that rely heavily on future earnings projections. Growth-oriented companies, particularly in the tech sector, tend to be the most sensitive to these shifts.
The result is a tightening liquidity environment, where capital becomes more selective and risk tolerance declines.
## Corporate Developments Reflect Structural Shifts
Recent corporate announcements further underscore the changing landscape. Oracle Corporation revealed plans to cut thousands of jobs as part of a broader strategy to redirect resources toward artificial intelligence investments. The move reflects a growing trend among large tech firms to prioritize AI infrastructure while streamlining legacy operations.
Meanwhile, Microsoft is facing increased scrutiny after reporting one of its weakest quarters in years, raising questions about its competitive positioning in the rapidly evolving AI space.
On the global stage, competition is intensifying. Chinese AI firm Zhipu reported a significant surge in revenue, highlighting the accelerating race for dominance in artificial intelligence.
These developments point to a broader transformation within the tech sector—one that goes beyond short-term market fluctuations and into long-term strategic realignment.
## Energy and Defense Markets React to Policy Signals
Energy markets have also experienced sharp volatility. Oil prices dropped significantly after signals that the U.S. could scale back its involvement in the Iran conflict. This decline reflects how quickly geopolitical developments can shift supply expectations and market sentiment.
At the same time, the defense sector remains in focus, as ongoing tensions continue to influence government spending priorities. Investors are increasingly looking at defense and energy stocks as potential hedges against geopolitical uncertainty.
Financial institutions such as Morgan Stanley have pointed to dividend-paying energy companies as potential beneficiaries in this environment, as investors seek stability and consistent returns.
## Emerging Markets Show Mixed Signals
While global markets remain volatile, certain regions are showing resilience. In India, shares of IndiGo surged after the announcement of a new CEO, signaling confidence in leadership and growth prospects.
Across Asia, markets have responded positively to signs of potential de-escalation in geopolitical tensions. South Korea and Japan, in particular, have seen improved sentiment, although analysts warn that this optimism may be short-lived if underlying risks persist.
These mixed signals highlight the uneven nature of the current recovery, where localized gains coexist with broader global uncertainty.
## A Market in Transition
Taken together, recent developments suggest that global markets are entering a transitional phase. The combination of geopolitical shifts, regulatory pressures, and tightening financial conditions is forcing investors to rethink traditional strategies.
Capital is increasingly moving away from high-growth, high-risk assets and toward more defensive sectors and fixed-income investments. At the same time, legal and regulatory risks are becoming a more prominent factor in valuation models—especially for companies operating in highly scrutinized industries.
This shift represents a move toward a more disciplined investment environment, where profitability, resilience, and risk management take precedence over rapid expansion.
## Outlook: Volatility Likely to Persist
Looking ahead, markets are expected to remain highly sensitive to incoming data and policy signals. Key factors to watch include central bank communication, inflation trends, and further developments in the Iran conflict.
While the possibility of geopolitical relief offers a pathway to stabilization, the broader macroeconomic environment suggests that volatility is far from over.
For investors and businesses alike, the coming weeks will be critical. The decisions made during this period—whether to reduce risk, rotate assets, or double down on long-term opportunities—will shape performance in the months ahead.
The current market environment is defined by complexity and rapid change. What appears on the surface as a rebound is, in reality, part of a deeper structural reset.
Global markets are shifting away from an era of easy liquidity and aggressive growth toward one defined by tighter financial conditions, increased regulation, and heightened geopolitical awareness.
**For those navigating this landscape, the message is clear:** adaptability, discipline, and strategic foresight are no longer optional they are essential.
**Stay ahead of global market shifts, tech trends, and geopolitical insights—explore more in-depth analysis at [Daily Finance](https://df.media/).**
**Categories:** Banking
---
### [US Stock Market Sinks as Iran War Hits Week 5 and Dow Futures Drop 253 Points](https://df.media/us-stock-market-sinks-iran-war-hits-week-5/)
**Published:** March 30, 2026
**Author:** Vishnu Priya
**Excerpt:** Dow futures drop 253 points Monday as Iran war enters week 5 and Brent hits $112. Here is what is happening and what investors must do today.
**Content:**
The US stock market today is opening under serious pressure, and this time the reason is not complicated. A war that nobody expected to last this long is now reshaping how investors think about every asset class from tech stocks to oil futures, and the damage is visible in every index on the board.
This is not background noise. This is the story of your money right now.
## Table of Contents
1. Where the US Stock Market Stands This Morning
2. Why the Iran War Is Driving Everything Right Now
3. The Stagflation Word Nobody Wanted to Hear
4. Which Stocks Are Hurting and Which Are Holding
5. What the Federal Reserve Is Thinking
6. What Happens This Week and Why It Matters
7. What You Should Actually Do With Your Money Today
8. Your Questions Answered
---
## Where the US Stock Market Stands This Morning
Sunday night, before a single trade was placed, the signals were already bad. US equity futures fell Sunday evening. Dow Jones futures dropped 253 points, or 0.6%, while S&P 500 futures and Nasdaq 100 futures each lost 0.5%.
That follows one of the worst Fridays Wall Street has seen in years. The Dow Jones Industrial Average tumbled 793.47 points, or 1.73%, closing at 45,166.64. The S&P 500 dropped 1.67% and ended at a seven-month low of 6,368.85, notching its fifth straight weekly decline. The Nasdaq Composite declined 2.15% and settled at 20,948.36.
Five consecutive weeks of losses. That is the longest losing streak since 2022, a year nobody in the investment world looks back on fondly.
The picture under the surface is actually worse than the headline numbers suggest. The maximum drawdown for the S&P 500 has been around 7% from recent highs, but the average member of the index has seen a 17% drawdown. In the Nasdaq Composite, the average member has seen a 31% drawdown. Corrections are happening through a process of rotation and churn rather than indexes falling all at once.
Put simply, most individual stocks have been hit far harder than the indexes are showing. If your portfolio feels worse than the Dow suggests, that is exactly why.
---
## Why the Iran War Is Driving Everything Right Now
Let us be direct about what is actually happening here. This market is not falling because of quarterly earnings disappointments or a slowing tech cycle. It is falling because a war in the Middle East is refusing to end, and that war is sending oil prices to levels that change the math for every business in America.
Equity losses accelerated into the close Friday, with the S&P 500 dropping 1.7%. The Nasdaq 100 fell into a correction, sliding over 10% from its peak. Brent topped $112 per barrel.
As the war in Iran stretches into a fifth week, investors who had been hopeful for a quick resolution are growing increasingly uneasy about the real-world fallout from the conflict. Yemen’s Houthis said Saturday they had launched missiles at Israel, marking their first direct involvement in the war and signaling the conflict is widening.
Japan’s Nikkei 225 fell 3.97% and Australia’s ASX 200 lost 1.46%. Hong Kong’s Hang Seng dropped 1.52%. This is a globally synchronized risk-off move, not a uniquely American problem.
When oil stays above $110, the ripple effects are everywhere. Trucking costs rise. Airline fuel bills explode. Food distribution becomes more expensive. Every business that moves goods or uses energy, which is almost every business that exists, starts to feel the squeeze. And consumers feel it at the pump before they feel it anywhere else.
---
## The Stagflation Word Nobody Wanted to Hear
There is a word starting to appear in analyst notes and Fed speeches that markets have not had to take seriously in decades. That word is stagflation, and it means what it sounds like: high inflation combined with slowing growth. It is the economic scenario that gives central bankers nightmares because there is no clean policy response to it.
From a technical standpoint, the S&P 500 remains in a downtrend, well below its 200-day moving average of 6,633. Technical support is not evident much below this week’s lows until the 6,200 level on the index.
The surge in energy prices had already dimmed expectations of a Fed rate cut this year, while concerns magnified after China opened a trade probe against the US in retaliation to tariffs imposed by Washington.
The Fed came into 2026 expecting to cut rates. Markets were pricing in those cuts. Neither the Fed nor the markets expected oil above $110, and neither built a proper contingency for what happens to inflation when a Middle East conflict disrupts global energy supply for more than a month.
Philadelphia Federal Reserve President Anna Paulson said that inflation running above the central bank’s 2% target is making her more apprehensive about policy. “If inflation were at the 2-percent target, I would feel more comfortable being patient,” she said directly.
She is nowhere near 2%. The OECD is now forecasting US inflation at 4.2% for 2026, nearly double what Fed officials themselves projected just months ago. That gap between expectation and reality is precisely what markets are currently pricing with five weeks of losses.
---
## Which Stocks Are Hurting and Which Are Holding
The market is not falling evenly, and that distinction matters enormously for how you think about your own portfolio right now.
Tech heavyweights remained under significant pressure with Nvidia dropping 2.2%, Microsoft falling 2.5%, and Alphabet shedding 2.5%, while Meta saw steeper declines of 4% amid shifting risk sentiment. Financial and credit-sensitive stocks also struggled, with JPMorgan falling 3% and Visa losing 3.3%. The decline in the Dow was led by Amazon falling 3.85%, Salesforce dropping 3.41%, and Visa losing 3.38%.
Growth stocks, technology companies, and anything dependent on cheap borrowing costs or global supply chains is getting punished daily. The logic is straightforward and brutal. These companies’ valuations depend on future earnings, and when interest rates stay elevated, those future earnings are worth less in today’s money.
On the other side of this trade, energy giants like Exxon Mobil bucked the broader trend, gaining 3.5% as WTI crude futures topped $99 per barrel. Gold and commodities are absorbing the capital flowing out of growth stocks. Defensive, cash-generating businesses with real pricing power are surviving while speculative positions collapse.
Cybersecurity stocks including CrowdStrike and Palo Alto Networks were among the worst performers, falling 6% and 4% respectively, as the pullback in risk positioning dented confidence in speculative AI-adjacent positions.
---
## What the Federal Reserve Is Thinking
The Fed is in an impossible position, and the market knows it. If they cut rates to support growth, they pour fuel on an inflation fire already burning hotter than projected. If they hold or raise rates to fight inflation, they risk tipping an already wobbling economy into contraction.
When surveyed, almost two thirds of market participants, 66.5%, said the Fed’s decision to hold rates unchanged was the right move. Only one in seven, 14.2%, said the Fed should have cut rates, while 13.7% said the central bank should have raised rates.
That 13.7% who think rates should go higher is the number worth watching. Three months ago, that figure was essentially zero. The fact that it is now approaching 14% tells you how dramatically the inflation conversation has shifted since the war began.
---
## What Happens This Week and Why It Matters
This is a shortened trading week, with markets closed Friday for Good Friday. That compression makes every data point hit harder than normal because there are fewer trading days to absorb the reaction.
Today, March 30, no major earnings or data releases are scheduled, giving markets a chance to move on sentiment and geopolitical headlines alone. Tuesday brings the March Consumer Confidence index and JOLTS Job Openings data, along with Nike earnings, which will serve as a real-world gauge of consumer demand. Wednesday delivers the ADP Employment Survey, ISM Manufacturing PMI, and retail sales data. Friday brings the March nonfarm payrolls report at 8:30 a.m. Eastern, but markets are closed, meaning the reaction comes Monday, April 6.
Nike reporting on Tuesday carries more weight than a normal consumer company earnings call right now. If Nike signals weakening demand or rising costs from logistics, it validates the stagflation narrative in a tangible, headline-friendly way. If they beat, it offers a small but real counterargument to the doom loop.
The jobs report on Friday is the most important single data point of the entire week, even though markets cannot react until the following Monday. Economists are expecting job creation to have recovered strongly in March after a weak February. If those expectations are met, it complicates the Fed’s situation further: a strong labor market alongside 4% inflation means rate cuts are truly off the table.
---
## What You Should Actually Do With Your Money Today
The most dangerous thing you can do in a fear-driven market is make permanent decisions based on temporary panic. The second most dangerous thing is doing absolutely nothing and assuming this resolves itself.
Do not panic sell this morning. Five weeks of consecutive losses is exactly when markets often find short-term relief. Selling at the point of maximum fear locks in losses at the worst possible price. If you have held through five weeks of this, the intelligent question is not whether to exit, it is whether your current allocation still makes sense.
Revisit your sector exposure honestly. If a large portion of your portfolio is concentrated in high-growth tech, that bet is being tested in a way it has not been since 2022. Energy, gold, defense, and value-oriented businesses with strong cash flows have been the consistent outperformers across this entire period. Rebalancing toward these is not speculation, it is recognizing what the current macro environment actually rewards.
Watch the VIX closely. It is approaching 30 and investors are paying up for hedges with a strong bias toward puts. A VIX reading above 30 signals extreme fear. When it starts moving below 25, that is the first real signal that market anxiety is genuinely easing.
Watch Brent crude above everything else. This market does not recover until energy prices give investors a reason to believe inflation is peaking. Brent falling sustainably below $95 would be the single clearest signal that the worst of this inflation shock is passing.
Seasonally, April is historically the second-best month for the Dow Jones Industrial Average, averaging a 1.8% gain going back to 1950. That mean reversion opportunity only exists if you have capital available to deploy when the turn comes. Holding some cash right now is not a sign of weakness. It is preparation.
---
> ### Stay Ahead of Every Market Move
>
> The market does not wait for anyone. Neither should you. DF Media delivers daily US market analysis, breaking financial news breakdowns of what is actually moving your money and why.
>
> **[Read Today’s Full Market Coverage at DF Media](https://df.media/)**
---
## Your Questions Answered
**Why is the US stock market falling today on March 30 2026?**
Dow futures opened 253 points lower Sunday night as the Iran war enters its fifth week with no ceasefire in sight, Brent crude sits above $110, and stagflation fears are pushing markets to price in the possibility of a Fed rate hike rather than a cut by year end.
**Is this a stock market crash or a correction?**
The Nasdaq and Dow are both officially in correction territory, defined as a decline of more than 10% from recent highs. The S&P 500 is approaching that threshold. This is a correction with crash-like characteristics under the surface, where the average Nasdaq stock has already fallen 31% from its high.
**Which stocks are actually going up right now?**
Energy companies with direct exposure to oil prices, gold-linked assets, and selective defensive names with strong cash flows. Exxon Mobil gained 3.5% on Friday while the rest of the market fell sharply.
**What is the next major support level for the S&P 500?**
Technical analysts are pointing to 6,200 as the next meaningful support level below current prices. The index closed Friday at 6,368.85.
**Should I buy this dip or wait?**
No financial advice can apply to your specific situation, but the historically relevant pattern is that buying during fifth or sixth week losing streaks, when the VIX is above 30 and sentiment is at multi-month lows, has tended to produce positive returns over the following six to twelve months. The risk is that this time the macro environment, a war, rising oil, and a trapped Fed, is different enough to extend the timeline significantly.
---
*Published: March 30, 2026 \| Focus Keyword: US stock market today \| Reading Time: 6 minutes \| Source: DF Media*
**Categories:** Banking
---
### [US Stock Market Today: War Fears Drive Inflation Surge, Rate Cut Hopes Evaporate](https://df.media/us-stock-market-today-war-fears-drive-inflation-surge-rate-cut-hopes-evaporate/)
**Published:** March 26, 2026
**Author:** Vishnu Priya
**Content:**
US Stock Market Today: War Fears Drive Inflation Surge **DJIA** 43,218 ▲ 0.65% **S&P 500** 5,701 ▼ 0.42% **GOLD** $3,114 ▲ 3.9% **USD/EUR** 1.0821 ▼ 0.38% **10Y YIELD** 4.18% ▼ 6bps **PMI** 51.4 ▼ 11-MO LOW **ARM** ▲ 13.0% **CHWY** ▲ 7.0% **KBH** ▼ 1.8% **FED CUT ODDS** 8% **DJIA** 43,218 ▲ 0.65% **S&P 500** 5,701 ▼ 0.42% **GOLD** $3,114 ▲ 3.9% **USD/EUR** 1.0821 ▼ 0.38% **10Y YIELD** 4.18% ▼ 6bps **PMI** 51.4 ▼ 11-MO LOW **ARM** ▲ 13.0% **CHWY** ▲ 7.0% **KBH** ▼ 1.8% **FED CUT ODDS** 8%
Breaking Analysis MARCH 26, 2026 US MARKETS EDITION
# US Stock Market Today Slips as War Fears Drive Inflation Higher and Erase Rate Cut Hopes
Stagflation signals are mounting. With the US Composite PMI at an 11-month low and input costs surging at their fastest pace in nearly a year, the Federal Reserve finds itself boxed in — and markets are repricing every assumption built on 2025’s rate-cut narrative.
MARKETS DESK MARCH 26, 2026 8 MIN READ
Fed Cut Probability 2026
8%
Down from 95% one month ago
Gold Price Move Today
+3.9%
Safe-haven demand surging
US Composite PMI March
51.4
11-month low · S&P Global
Rate Hike Probability 2026
16%
Was near zero four weeks ago
Geopolitical risk has moved from background noise to front-and-center market driver — and it is landing on an economy that has limited capacity to absorb the hit.
The latest Flash PMI data from S&P Global delivered a double verdict on Thursday: US business activity contracted to an 11-month low of 51.4 in March, while input costs accelerated at their fastest pace in nearly a year. The culprit, in both cases, is the same — energy prices spiking on the back of sustained Middle East conflict, with no clear resolution in sight.
What made Thursday’s data particularly uncomfortable for investors was the combination. Slowing growth alongside rising prices is not just a drag — it is the specific configuration that limits the Federal Reserve’s options most severely.
## The Fed’s Hands Are Tied
Nothing illustrates the Fed policy bind more sharply than the collapse in rate-cut expectations. According to CME Group’s FedWatch Tool, the probability of a Federal Reserve rate cut in 2026 has fallen from 95% just one month ago to 8% today. That is not a gradual shift — it is a repricing event.
More telling: markets are now assigning a 16% probability to a rate hike in 2026, a scenario that was virtually unthinkable as recently as late February. The math is straightforward. If inflation 2026 re-accelerates faster than growth recovers, the Fed cannot cut. And if cost pressures persist long enough, the next move may be up, not down.
“The rate-cut trade that anchored 2025’s equity rally is being systematically unwound. What replaces it is still unclear — and that uncertainty is the trade right now.”
Markets Desk Analysis · March 26, 2026
Fed Chair messaging will be scrutinized closely in the weeks ahead. Any shift toward a more hawkish tone — particularly referencing energy-driven inflation as persistent rather than transitory — could accelerate the repricing further.
## Gold Prices Jump as Safe Havens Surge
Gold prices surged nearly 4% in early Thursday trading, benefiting from a weaker US dollar, softening Treasury yields, and a classic flight-to-safety dynamic that tends to accelerate when geopolitical risk feels open-ended. The move puts gold firmly back in institutional portfolio conversations that had largely shifted to equities during last year’s rally.
The combination of a falling dollar and rising gold prices sends a clear message: global investors are hedging against a scenario where US monetary policy stays constrained longer than expected, and where real yields compress further if growth disappoints.
## Stock Market Today: Divergence, Not Direction
Today’s US stock market is not moving as a unified trade — it is splitting along structural fault lines. Companies with secular growth tailwinds are holding or advancing. Companies exposed to rate sensitivity and consumer discretionary pressure are giving ground.
**Arm Holdings (+13%)** was the session’s standout performer, rallying sharply after reaffirming guidance and raising its operating margin targets. AI-driven semiconductor demand continues to act as a buffer against macro headwinds, and Arm’s results confirm the structural demand story remains intact regardless of PMI prints.
**Chewy (+7%)** beat expectations on both revenue and earnings, with management issuing a positive forward outlook. Essential consumer spending — particularly pet care — is demonstrating the kind of demand inelasticity that makes it a defensible position in a slowing economy.
**KB Home (−1.8%)** missed on both top and bottom lines, underscoring the compounding pressure on homebuilders: elevated mortgage rates reducing buyer qualification, rising material costs squeezing margins, and demand uncertainty capping pricing power. Housing remains one of the most rate-sensitive sectors in the market, and the new rate outlook is not friendly to it.
## Dow Holds, But the Margin Is Thin
The Dow Jones Industrial Average closed 0.65% higher on Wednesday, supported by cautious optimism around potential diplomatic progress in the Middle East. But futures are pointing lower into Thursday’s open, and the session’s gain has the feel of relief rather than conviction.
The underlying picture remains fragile. Volume patterns suggest institutional positioning is defensive, not constructive. Until there is either a geopolitical de-escalation or a clear signal from the Fed on its tolerance for inflation persistence, the path of least resistance for equities is sideways to lower.
## Strategic Positioning in a Stagflation-Risk Environment
The trades working in this environment share a common characteristic: insulation from both rate risk and growth deceleration. AI infrastructure, essential services, and real assets like gold are performing. Rate-sensitive sectors — housing, long-duration growth, consumer discretionary — are under pressure.
The next two to three weeks are pivotal. Any escalation in Middle East tensions that pushes energy prices materially higher will force a further repricing of the inflation 2026 outlook. Conversely, credible de-escalation could restore some of the rate-cut probability and with it, significant equity upside in the sectors that have sold off most sharply.
Until then, the market’s message is unambiguous: geopolitical risk is now a macro variable, and portfolios that have not accounted for it are running an unhedged position.
Today’s Movers
ARM
Arm Holdings
+13.0%
CHWY
Chewy Inc.
+7.0%
GOLD
Spot Gold
+3.9%
DJIA
Dow Jones
+0.65%
KBH
KB Home
−1.8%
Key Data Points
51.4
US Composite PMI at an 11-month low, signaling slowing growth momentum
95% to 8%
Fed rate cut probability collapsed in just 30 days per CME FedWatch
+4%
Gold price surge as safe-haven demand accelerates globally
16%
Market-implied probability of a Fed rate hike in 2026
Watch List
🔴**Fed Communications**Any “persistent” inflation language would accelerate rate-hike repricing
🟡**Middle East Developments**De-escalation would restore rate-cut probability quickly
🟢**AI Sector Earnings**Structural demand insulating tech from broader macro drag
🔴**Energy Prices**Primary inflation transmission mechanism to watch closely
SEO & Publishing Package
Meta Title · 57 Characters
US Stock Market Today: War Fears Spike Inflation, Kill Rate Cuts
✓ 57 chars · within 60-char limit
Alternate Meta Title · 55 Characters
Gold Prices Surge as Inflation 2026 Fears Grip US Markets
✓ 55 chars · strong keyword front-load
Meta Description · 157 Characters
Today’s US market analysis: geopolitical risk drives inflation higher, gold prices surge 4%, and Fed rate cut odds collapse to 8% as stagflation signals mount in 2026.
✓ 157 chars · within 160-char limit · all 5 target keywords embedded
Primary H1 Headline
US Stock Market Today Slips as War Fears Drive Inflation Higher and Erase Rate Cut Hopes
Social / OG Title
Rate Cuts Are Dead. Gold Is Up 4%. Here’s What’s Driving US Markets Today.
Target Keyword Placement Map
stock market today · H1, intro, subhead Federal Reserve / Fed policy · body paras, sidebar inflation 2026 · H2, body, meta desc gold prices · H2, stats strip, sidebar geopolitical risk · kicker, intro, meta CME FedWatch Tool US Composite PMI S&P Global Flash PMI rate hike 2026 stagflation safe-haven assets Arm Holdings AI chips
Shareable Stat Cards
📉
95% to 8%
Fed rate cut probability collapsed in just 30 days · CME FedWatch
🥇
+3.9%
Gold prices surge as geopolitical risk drives safe-haven demand higher
⚠️
16%
Market-implied chance of a Fed rate hike in 2026, near zero a month ago
📊
51.4
US Composite PMI at 11-month low while input costs hit 10-month high
🚀
+13%
Arm Holdings rallies on AI chip demand, a rare bright spot in today’s session
💬
“The rate-cut trade that anchored 2025’s rally is being unwound. That uncertainty is the trade right now.”
Markets Desk · March 26, 2026
**Categories:** Banking
---
### [Dow Jumps 600 Points as US–Iran Talks Spark Market Rebound](https://df.media/dow-jumps-600-points-on-us-iran-talk-optimism/)
**Published:** March 24, 2026
**Author:** Vishnu Priya
**Content:**
**Updated Tue, Mar 24 2026 \| 6:20 PM EDT**
Global stock markets staged a powerful comeback on Monday after Donald Trump indicated that the United States and Iran had made progress in ongoing discussions. The update offered a sense of relief to investors who had been navigating rising tensions, surging oil prices, and fears of a broader economic slowdown.
The Dow Jones Industrial Average surged 631 points, or 1.38%, closing at 46,208.47. The S&P 500 rose 1.15% to finish at 6,581.00, while the Nasdaq Composite gained 1.38%, ending the day at 21,946.76. The strong performance across all three major indices signals renewed investor confidence, at least in the short term.
---
## **A Market Searching for Relief**
For weeks, markets have been under pressure due to escalating geopolitical tensions in the Middle East. Concerns about disruptions in global oil supply and the potential for a prolonged conflict had pushed equities closer to correction territory.
Earlier on Monday, futures suggested another negative session. However, sentiment shifted dramatically after Trump stated that the U.S. and Iran had engaged in “very good and productive conversations.” He also announced a temporary pause on planned military strikes targeting Iranian energy infrastructure.
This single development was enough to trigger a broad-based rally. At one point during the trading session, Dow futures surged more than 1,000 points, highlighting just how eager investors were for positive news.
The phrase “Dow jumps 600 points” quickly became symbolic of the market’s reaction — not just to confirmed developments, but to the possibility of de-escalation.
---
## **Oil Prices Drop and Markets Respond**
One of the most immediate reactions was seen in energy markets. Oil prices, which had surged in recent sessions, dropped sharply following the announcement.
West Texas Intermediate crude fell more than 10% to settle at $88.13 per barrel. Meanwhile, Brent crude declined nearly 11% to close at $99.94.
This sharp pullback in oil prices helped ease inflation concerns, which have been a major worry for investors. Lower energy costs tend to support economic growth by reducing expenses for businesses and consumers alike.
The “oil prices drop news” quickly became a key driver behind the broader stock market rally 2026 is now witnessing.
---
## **Gains Across All Major Sectors**
The rally was not limited to a single sector — it spread across the entire market, reflecting widespread optimism.
Financial stocks saw steady gains, with JPMorgan Chase and Morgan Stanley moving higher. Industrial companies such as Caterpillar and Deere & Company also advanced, benefiting from improved economic outlook expectations.
Technology stocks joined the rally as well, with Nvidia and Apple both posting gains.
Airline stocks were among the biggest beneficiaries of falling oil prices, as lower fuel costs directly improve profitability. This contributed to the broader “global market rebound” narrative that is now shaping investor sentiment.
---
## **Lingering Doubts and Market Sensitivity**
Despite the optimism, uncertainty remains. Reports from Iranian state media suggested that no direct talks had taken place between the two countries, which briefly cooled market enthusiasm.
This contradiction highlights a key reality of the current environment: markets are highly sensitive to headlines and can shift direction quickly.
The “US Iran talks 2026” storyline is still developing, and investors are closely watching for concrete outcomes rather than just positive signals.
---
## **What Comes Next for Markets**
Monday’s rally is widely seen as a relief rally — a sharp upward move driven by reduced fear rather than confirmed resolution. After weeks of selling pressure, markets were primed for a rebound.
Before this recovery, both the Dow and Nasdaq were nearing correction territory, while the S&P 500 had already posted notable declines. The latest developments provided a reason for investors to re-enter the market.
However, analysts caution that volatility is far from over. Oil prices, geopolitical developments, and central bank responses will continue to shape market direction in the coming days and weeks.
---
## **The Bigger Picture**
At its core, this rally reflects how modern markets operate. Investors are not waiting for final outcomes — they are reacting to expectations and probabilities.
The strong “stock market rally 2026” narrative now depends on whether diplomatic progress continues. If tensions ease further, markets could build on these gains. If not, the current momentum could reverse just as quickly.
For now, the takeaway is simple: even a small sign of stability can move billions in global capital.
**Categories:** Banking
---
### [Oil Price Surge 2026 Signals a Global Risk Shift](https://df.media/oil-price-surge-2026-signals-a-global-risk-shift/)
**Published:** March 20, 2026
**Author:** Laura Anderson
**Content:**
The **oil price surge 2026** is no longer being driven by speculation or routine geopolitical tension. Instead, it reflects a deeper structural shift in global energy markets following the **Iran Qatar LNG attack**, which has intensified fears of a prolonged **global oil supply shock**.
Brent crude price today climbed above $111, while U.S. West Texas Intermediate approached the $100 mark. These movements are not isolated spikes. They represent a recalibration of risk as traders and institutions begin pricing in the possibility of sustained disruption across key energy corridors.
What makes this moment significant is the nature of the escalation. For the first time in this cycle, critical energy infrastructure has become the direct target, pushing the **Middle East energy crisis 2026** into a more dangerous and unpredictable phase.
---
## What Happened: Iran Qatar LNG Attack Hits a Global Energy Hub
The escalation unfolded when Iranian missile strikes targeted Ras Laffan Industrial City, widely recognized as the largest liquefied natural gas export facility in the world.
Qatar confirmed that the site suffered extensive damage, raising immediate concerns about **Qatar LNG export disruption**. Emergency crews managed to contain fires, but the scale of the impact has not yet been fully assessed.
This attack followed Israeli strikes on Iran’s South Pars gas field, one of the largest natural gas reserves globally. The sequence of actions highlights a dangerous pattern of retaliation where both sides are now directly targeting energy production capabilities.
This is a turning point. Energy infrastructure is no longer peripheral to conflict it is central to it.
---
## Why This Matters: From Regional Conflict to Global Oil Supply Shock
The implications of this event extend far beyond the Middle East. Qatar is one of the world’s leading LNG exporters, accounting for a significant portion of global supply. Any sustained disruption creates ripple effects across multiple continents.
The current situation is rapidly evolving into a **global gas supply crisis**, particularly for countries heavily reliant on LNG imports. Europe and Asia are especially vulnerable, as they depend on stable LNG flows to meet industrial and residential demand.
This is why the **global oil supply shock** narrative is gaining traction. Markets are no longer reacting to potential risks but to real supply constraints that could take months to resolve.
---
## Strait of Hormuz: The Chokepoint Driving Market Anxiety
The crisis is further intensified by disruptions in the Strait of Hormuz, one of the most critical oil transit routes in the world.
Roughly 20% of global oil supply passes through this narrow channel. Any disruption here has immediate consequences for the **Strait of Hormuz oil supply** chain.
Current challenges include:
- Reduced tanker movement
- Higher shipping and insurance costs
- Increased delivery delays
Even if production levels remain stable, logistical disruptions alone can tighten supply and push prices higher. This dual pressure is amplifying **oil market volatility** at a global scale.
---
## Market Reaction: Brent Crude Price Today Reflects Rising Risk
Energy markets responded swiftly to the escalation.
- **Brent crude price today** surged above $111
- **WTI crude price update** approached $100
- Overall gains ranged between 3% and 4%
These movements reflect a growing risk premium embedded into oil pricing. Traders are increasingly factoring in worst-case scenarios, including prolonged disruptions and further escalation.
This is a classic example of how the **geopolitical impact on oil prices** can reshape market dynamics almost instantly.
---
## From Supply Chain Disruption to Structural Supply Crisis
One of the most critical shifts in this situation is the transition from supply chain issues to actual supply constraints.
In previous disruptions, delays were often caused by logistics such as shipping or refining bottlenecks. These could typically be resolved within weeks.
Now, the focus has shifted to production itself. Damage to infrastructure reduces output capacity, and rebuilding or restoring operations can take significantly longer.
This is the defining characteristic of a **global gas supply crisis**:
- Production capacity is reduced
- Supply cannot quickly rebound
- Prices remain elevated for extended periods
As a result, the **crude oil market analysis** is becoming increasingly bullish, with many analysts revising their **oil price forecast 2026** upward.
---
## Escalation Risks: What Happens If the Conflict Expands
The current situation remains highly fluid, and the next phase will depend on how the conflict evolves.
Key escalation risks include:
- Attacks on additional energy infrastructure across the Gulf
- Involvement of other major producers such as Saudi Arabia or the UAE
- Expansion of conflict beyond the region
If such scenarios materialize, the **energy infrastructure attack** trend could become more widespread, significantly amplifying the **global oil supply shock**.
In extreme cases, oil prices could surge far beyond current levels, potentially triggering a new wave of economic instability.
---
## Economic Impact: Oil Price Surge 2026 and Inflation Pressure
The consequences of the **oil price surge 2026** extend beyond energy markets and into the broader global economy.
Rising oil prices typically lead to:
- Higher fuel and transportation costs
- Increased production expenses for businesses
- Upward pressure on inflation
For central banks, this creates a complex challenge. Efforts to control inflation may conflict with the need to support economic growth.
Emerging markets, in particular, may face heightened pressure due to their reliance on energy imports. This makes the current situation not just an energy issue but a macroeconomic one.
---
## Big Picture: A New Era of Energy Market Volatility
What we are witnessing is not just a temporary spike in prices but a fundamental shift in how energy markets operate.
The **Middle East energy crisis 2026** is redefining risk perception, with infrastructure security becoming a key factor in pricing.
This new environment is characterized by:
- Persistent **oil market volatility**
- Elevated geopolitical risk premiums
- Greater uncertainty in supply forecasts
For investors, policymakers, and businesses, adapting to this new reality will be critical.
---
## Conclusion: Markets Repricing Risk in Real Time
The **Iran Qatar LNG attack** has accelerated the transition into a high-risk energy environment. The **global oil supply shock** is already influencing prices, and the potential for further escalation remains high.
As the **Brent crude price today** reflects rising uncertainty, it is clear that markets are no longer reacting to hypothetical risks. They are responding to real, measurable disruptions.
The coming weeks will be crucial in determining whether this crisis stabilizes or escalates further. Either way, the **oil price surge 2026** marks a pivotal moment for global energy market.*[Source](https://www.cnbc.com/2026/03/19/oil-jumps-iran-strikes-qatar-lng-facility-supply-worries.html)*
---
**Stay ahead of global markets, gold prices, central bank policy, and breaking finance news only on [Daily Finance](https://df.media/)**
**Categories:** Business, Finance, Global News
---
### [Top 5 Finance News Shaping Global Markets Today: Oil Above $100, AI Deals Surge](https://df.media/top-5-finance-news-today-oil-100-ai-deals-market-moves/)
**Published:** March 16, 2026
**Author:** Vishnu Priya
**Excerpt:** Oil prices surge above $100, AI investments accelerate, and markets turn volatile. Here are the top finance stories shaping global markets today.
**Content:**
Global financial markets began the week with heightened volatility as geopolitical tensions, technology investments, and major corporate developments influenced investor sentiment. Energy prices are rising, supply chains face new risks, and artificial intelligence investments continue to accelerate across the technology sector.
Investors, analysts, and policymakers are closely monitoring several major developments that could shape financial markets in the coming weeks. Here are the five biggest finance stories influencing global markets today.
### Oil Prices Surge Above $100 Amid Middle East Tensions
Global oil prices have climbed above $100 per barrel as tensions between the United States and Iran intensify. Concerns over potential strikes on key Iranian oil infrastructure have triggered fears of supply disruptions across global energy markets.
One major focal point is Kharg Island, which handles a significant share of Iran’s crude oil exports. Reports suggesting possible attacks or operational disruptions at the facility have pushed traders toward risk-averse positions, driving oil prices higher.
The situation is particularly sensitive because shipping routes through the Strait of Hormuz carry roughly one-fifth of the world’s oil supply. Any disruption in this corridor could significantly impact global fuel prices and logistics costs.
The ripple effects are already being felt across multiple industries. Airlines face higher jet fuel costs, fertilizer production is becoming more expensive, and shipping companies are paying significantly higher insurance premiums for vessels operating in the region.
Economists warn that prolonged energy price spikes could increase inflation pressures globally and complicate monetary policy decisions for central banks.
### U.S. Stocks Extend Three-Week Losing Streak
[Wall Street markets ](https://www.cnbc.com/2026/03/16/stocks-making-the-biggest-moves-premarket-mu-nbis-dltr.html)continue to show signs of strain as the S&P 500 posted its third consecutive weekly decline. Investor confidence has been shaken by geopolitical risks and ongoing uncertainty surrounding interest rate policy.
Political developments also influenced the market narrative after comments from Donald Trump suggested the possibility of easing tensions with Iran in the near future. While those remarks briefly lifted investor sentiment, the broader market trend remains cautious.
Technology companies tied to artificial intelligence have shown stronger resilience compared with other sectors. These companies continue to attract strong investment as businesses worldwide increase spending on advanced computing infrastructure.
However, analysts note that market volatility could remain elevated as investors evaluate both geopolitical developments and potential changes in monetary policy.
## Market Movers to Watch
Several companies saw major movements in early trading:
| Company | Market Move | Key Reason |
|---|---|---|
| Nebius Group | +14% | AI partnership with Meta |
| Micron Technology | +6% | New chip factory announcement |
| MARA Holdings | +8% | Crypto rally |
| Dollar Tree | -5% | Mixed earnings report |
| National Storage Affiliates | +22% | Acquisition by Public Storage |
### Federal Judge Blocks Probe Into the Federal Reserve
In a significant legal development, a U.S. federal judge has halted a criminal investigation targeting the Federal Reserve.
The court determined that the investigation appeared to be part of a broader political effort to pressure the central bank into lowering interest rates. The ruling reinforces the independence of the Federal Reserve, which plays a crucial role in setting monetary policy and managing inflation.
Maintaining central bank independence is considered essential for market stability. Investors often rely on the credibility and neutrality of monetary authorities when making long-term investment decisions.
Analysts say the ruling could ease some political pressure on policymakers ahead of upcoming interest rate discussions and economic outlook updates.
### Shipping Disruptions Near the Strait of Hormuz
Global shipping routes are experiencing major disruption as more than 1,000 vessels remain delayed near the Strait of Hormuz.
War risk insurance premiums for ships traveling through the region have surged dramatically. As a result, several shipping companies are delaying voyages, rerouting cargo, or temporarily suspending routes through the area.
The disruption is affecting nearly 10 percent of the world’s container shipping capacity. Logistics companies warn that delays could ripple across global supply chains, affecting everything from manufacturing components to consumer electronics.
If the geopolitical situation continues to escalate, analysts believe global trade costs could increase sharply, potentially impacting commodity prices and consumer goods worldwide.
### AI Investment Boom Accelerates
Artificial intelligence continues to dominate global investment trends as technology companies race to build the infrastructure required for next-generation computing.
Nebius Group recently announced a massive $12 billion infrastructure partnership with Meta Platforms to expand global AI computing capacity. The deal highlights the growing demand for advanced data centers capable of handling large-scale AI workloads.
The partnership also builds on collaboration with Nvidia, whose specialized processors are widely used for training AI models and powering data center infrastructure.
Meanwhile, Micron Technology revealed plans to construct a second advanced semiconductor manufacturing facility in Taiwan. The facility will focus on producing high-performance DRAM chips used in artificial intelligence systems and cloud computing platforms.
Industry analysts estimate that global investments in AI infrastructure could exceed $3 trillion over the next decade, making it one of the largest technology investment cycles in modern history.
### Market Movers to Watch
Several companies recorded notable movements in early trading sessions:
• Nebius Group shares surged after announcing its AI infrastructure partnership.
• Micron Technology gained momentum following expansion plans in Taiwan.
• Crypto-related companies such as MARA Holdings moved higher as Bitcoin rallied early in the week.
• Dollar Tree shares declined after reporting mixed quarterly earnings.
• National Storage Affiliates surged after agreeing to a $10.5 billion acquisition by Public Storage.
### The Bottom Line
Three powerful forces are shaping the current financial landscape.
Geopolitical risks are pushing energy prices higher. Artificial intelligence investments are fueling massive capital flows into the technology sector. At the same time, stock markets are navigating policy uncertainty and global trade disruptions.
For investors and businesses, the intersection of energy markets, AI expansion, and supply chain stability will likely define global financial trends throughout 2026. Monitoring these developments closely will be critical for understanding where markets move next.
**Stay ahead of global markets, gold prices, central bank policy, and breaking finance news only on [Daily Finance](https://df.media/)**
**Categories:** Banking
---
### [Oil Tops $100 Again as Iran Ramps Up Strikes and Threatens Strait of Hormuz](https://df.media/oil-tops-100-as-iran-threatens-strait-of-hormuz-again/)
**Published:** March 12, 2026
**Author:** Jonathan Algreen
**Excerpt:** Oil tops $100 as Iran threatens the Strait of Hormuz, raising fears of global supply disruption and renewed volatility in energy markets.
**Content:**
Global energy markets were jolted on Thursday after oil prices surged back above the critical $100 level. Escalating attacks on shipping routes in the Persian Gulf and warnings from Iran’s leadership about blocking the Strait of Hormuz have raised serious concerns about a potential global supply crisis.
Benchmark Brent Crude Oil briefly touched more than $101 per barrel before easing slightly, while U.S. benchmark West Texas Intermediate climbed sharply as investors reacted to growing geopolitical risks in the Middle East.
The renewed spike in oil prices highlights how fragile global energy supply chains have become and signals that commodity market volatility may dominate financial markets in 2026.
---
## Iran’s Warning Triggers Global Market Reaction
Oil markets reacted quickly after Iran’s new supreme leader, Mojtaba Khamenei, made a strong statement declaring that the Strait of Hormuz should remain closed and that Iran would continue targeting military bases and infrastructure across the Gulf region.
The narrow shipping corridor connects the Persian Gulf to global markets and carries roughly **20 percent of the world’s oil supply** each day. Any disruption to this route can quickly trigger dramatic swings in global energy prices.
Following the announcement, oil futures surged as traders rushed to price in the possibility of a prolonged supply disruption.
---
## Tanker Attacks Escalate Supply Fears
The latest oil rally also followed a series of attacks on cargo vessels and oil tankers across the Gulf. Reports indicate that at least six ships have been targeted within a two-day period.
Two Iraqi tankers were reportedly struck offshore, forcing operations at nearby export terminals to temporarily halt. At the same time, Oman evacuated vessels from its major export terminal at Mina Al Fahal due to rising security concerns.
These incidents have intensified fears that global oil shipments could face serious disruptions if tensions escalate further.
---
## Historic Supply Disruption Warning
The escalating conflict has prompted warnings from global energy agencies. In its latest market report, the International Energy Agency said the situation could lead to one of the largest oil supply disruptions in modern history.
According to the agency, Gulf countries have already reduced oil production by nearly **10 million barrels per day** due to security risks and infrastructure disruptions.
The organization also warned that global oil supply could fall by about **8 million barrels per day this month**, even after accounting for increased production from other countries.
---
## Record Emergency Oil Reserve Release
To stabilize energy markets, the International Energy Agency announced the **largest coordinated release of emergency oil reserves ever recorded**.
The organization’s member countries agreed to release **400 million barrels of oil** from strategic reserves to help offset the supply shock.
However, the move has not fully calmed markets. Investors remain concerned that the reserve release may only provide temporary relief if the conflict continues to escalate.
---
## Oil Market Volatility Surges
The dramatic price swings have pushed oil market volatility to its highest levels in years. The Cboe Crude Oil Volatility Index, which measures uncertainty in the oil market, surged sharply and is approaching levels last seen during the early months of the pandemic.
Market analysts say the combination of military conflict, tanker attacks, and supply disruptions is creating a highly unstable trading environment.
Some experts now believe commodity price volatility will remain a key theme in global markets for the foreseeable future.
---
## Economic Risks Begin to Grow
Rising oil prices often ripple across the broader economy. Higher energy costs can increase transportation expenses, drive up consumer prices, and slow economic growth.
Analysts at Deutsche Bank warn that if oil remains near or above $100 per barrel, it could increase the risk of stagflation, a situation where inflation rises while economic growth slows.
That scenario would create a difficult challenge for central banks, which are already navigating uncertain economic conditions.
---
## Global Markets Brace for Energy Shock
For investors, the key question now is whether tensions in the Middle East will escalate further or begin to stabilize. With critical shipping routes under threat and geopolitical risks rising, traders are closely watching developments around the Strait of Hormuz.
If the corridor remains disrupted, global oil markets could face prolonged supply pressure. That would likely keep energy prices elevated and drive further volatility across financial markets.
For now, the surge above $100 serves as a reminder that geopolitical shocks can still move global markets overnight—and that energy security remains one of the most important forces shaping the world economy today. [Source](https://www.marketwatch.com/story/oil-taps-101-as-iran-dramatically-changes-strategy-and-iea-calls-conflict-biggest-supply-disruption-in-history-b38215b5?mod=home_ln)
---
## FAQs
### Why did oil prices rise above $100?
Oil prices surged due to escalating attacks on ships and infrastructure near the Strait of Hormuz, raising fears of a major disruption to global oil supply.
### Why is the Strait of Hormuz so important?
The Strait of Hormuz is a crucial shipping route connecting Gulf oil producers to global markets. Around 20 percent of the world’s crude oil exports pass through it.
### What is Brent crude oil?
Brent Crude Oil is the global benchmark used to price most internationally traded crude oil.
### What is West Texas Intermediate crude?
West Texas Intermediate is the primary oil benchmark used in the United States and reflects domestic crude prices.
### What did the IEA do to stabilize markets?
The International Energy Agency approved a record release of 400 million barrels of emergency oil reserves to reduce supply pressure in global markets.
**Stay ahead of global markets, gold prices, central bank policy, and breaking finance news only on [Daily Finance](https://df.media/)**
**Categories:** Business, Finance, Global News
**Tags:** Iran War, oil price
---
### [5 Powerful Reasons Reliance Industries US Oil Refinery Deal Is India's Biggest Global Win in 2026](https://df.media/reliance-industries-us-oil-refinery-indias-biggest-win/)
**Published:** March 11, 2026
**Author:** Vishnu Priya
**Excerpt:** Reliance Industries backs the first new US oil refinery in 50 years at Brownsville Texas. Discover Trump India energy deal 2026 that changed everything.
**Content:**
The world just witnessed India’s most powerful moment on the global energy stage. The Reliance Industries US oil refinery deal, announced by US President Donald Trump on March 11 2026, is not just a business transaction. It is a declaration that Indian enterprise has arrived at the highest table of global power. Here are five powerful reasons this deal changes everything for India in 2026.
---
**Table of Contents**
1. What Is the Reliance Industries US Oil Refinery Deal
2. Why Trump Publicly Thanked India by Name
3. Reliance’s 20-Year Commitment Explained
4. Why the Timing of This Deal Is a Masterstroke
5. What This Means for Indian Startups and Investors
---
## 1. What Is the Reliance Industries US Oil Refinery Deal
The Reliance Industries US oil refinery deal marks the construction of the first new oil refinery in the United States in 50 years. The refinery will be located at the Port of Brownsville, Texas, and will be operated by a new entity called America First Refining.
The facility is designed to process 160,000 barrels of oil daily, running entirely on US shale oil. Groundbreaking is planned for Q2 2026, and the project already has all necessary permits in place following site preparation completed by the original developer Element Fuels in June 2024.
US President Donald Trump described the project as a historic $300 billion deal, calling it the biggest in US history and a massive win for American workers, energy, and the people of South Texas.
The Reliance Industries US oil refinery deal puts Mukesh Ambani’s conglomerate at the centre of American energy infrastructure at one of the most critical moments in global energy history.
---
## 2. Why Trump Publicly Thanked India by Name
In his Truth Social announcement, Trump specifically wrote: “Thank you to our partners in India, and their largest privately held energy company, Reliance, for this tremendous investment.”
This is not diplomatic language buried in a press release. This is the President of the United States publicly crediting India on social media in front of a global audience.
The Trump India energy deal 2026 signals a fundamental shift in how Washington views New Delhi. India is no longer just a trade partner or an outsourcing destination. India is now a strategic energy ally at a time when the Middle East is in crisis and global oil supply chains are under severe pressure.
Iranian retaliatory strikes following Operation Epic Fury have already hit US military bases, embassies, and energy infrastructure across six Gulf countries including the UAE, Saudi Arabia, Qatar, Kuwait, Bahrain, and Jordan. The Strait of Hormuz, through which nearly 20 percent of the world’s oil supply passes, is under direct threat. In this environment, a domestic refinery backed by Indian capital is both an economic asset and a national security priority for the United States.
---
## 3. Reliance’s 20-Year Commitment Explained
The most underreported aspect of the Reliance Industries US oil refinery deal is the nature of Reliance’s involvement. Mukesh Ambani’s company has signed a 20-year offtake agreement, meaning Reliance has committed to purchasing the fuels produced by the Brownsville refinery for two full decades.
This is not a headline sponsorship. This is a long-horizon strategic commitment that ties one of India’s most powerful conglomerates to the heart of American energy production well into the 2040s. It reflects a level of confidence in the project’s viability, profitability, and geopolitical durability that no short-term investor would make.
For more context on India’s growing role in global energy markets, the International Monetary Fund’s global energy outlook provides useful background on shifting supply dynamics worldwide.
---
## 4. Why the Timing of the First New US Oil Refinery in 50 Years Is a Masterstroke
The first new US oil refinery in 50 years is being announced at exactly the right moment. Global energy markets are in their most volatile state in years. The Middle East conflict has disrupted supply routes, oil prices are rising, and the White House has confirmed it is considering releasing emergency reserves and providing military escorts for tankers through the Strait of Hormuz.
Against this backdrop, the Brownsville refinery sends a powerful message to global markets. America has a long-term plan. That plan is backed by Indian capital. And it is already permitted, sited, and ready to break ground.
Reliance did not stumble into this position. The groundwork was being laid quietly in 2024 when Element Fuels completed site preparation. Reliance identified the opportunity early and moved with the kind of strategic patience that defines truly generational business thinking.
For more on US energy infrastructure policy, the World Bank’s energy data portal tracks global refining capacity and investment trends.
---
## 5. What the Mukesh Ambani America Energy Investment Means for Indian Startups and Investors
The Mukesh Ambani America energy investment is a signal that every Indian entrepreneur needs to hear clearly.
Indian capital commands respect on the world stage. Indian vision is shaping global infrastructure. Indian enterprise is being publicly credited by heads of state.
If you are building a startup in India in 2026, you are building in the most credible environment Indian business has ever operated in. The perception of Indian ambition has changed permanently. What was once called overreach is now called strategy.
The era of waiting for the world to take India seriously is over. The Reliance Industries US oil refinery deal is proof of that.
---
**Key Facts at a Glance**
| Detail | Info |
|---|---|
| Deal | America First Refining, Brownsville Texas |
| Indian Partner | Reliance Industries, Mukesh Ambani |
| Capacity | 160,000 barrels per day |
| Reliance Commitment | 20-year fuel offtake agreement |
| Groundbreaking | Q2 2026 |
| Announced | March 11, 2026 by President Trump |
**Categories:** Banking
---
### [US Stocks Erase Massive Losses as Oil Prices Crash From $120 to Below $90 After Trump Iran War Comments](https://df.media/us-stocks-recover-as-oil-crashes-below-90-after-trump-says-iran-war-is-over/)
**Published:** March 10, 2026
**Author:** Ethan Brooks
**Excerpt:** US stocks erased steep losses on March 10 after oil crashed from $120 to below $90 following Trump's comments that the Iran war was over.
**Content:**
US stocks staged a remarkable recovery on Monday, March 10, 2026, wiping out steep early losses to close in positive territory after oil prices collapsed from nearly 120 dollars per barrel back below 90 dollars. The dramatic reversal was triggered by comments from President Donald Trump suggesting the military conflict with Iran was largely over.
## **WHAT HAPPENED ON WALL STREET TODAY**
The US stock market experienced one of its most volatile trading sessions in recent memory on Monday. All three major US indices opened sharply lower before executing a stunning late-session reversal.
The S&P 500 fell as much as 1.5 percent in morning trading before recovering to close up 0.8 percent, finishing at 6,795.99. The Dow Jones Industrial Average, which had plunged nearly 900 points at its lowest point of the day, ultimately closed up 239.25 points, or 0.5 percent, settling at 47,740.80. The Nasdaq Composite, which is heavily weighted toward technology stocks, climbed 1.4 percent to close at 22,695.95.
These gains represent a dramatic turnaround for a market that began the week deeply rattled by the escalating conflict between the United States and Iran and the resulting spike in global oil prices.
### WHY DID OIL PRICES SPIKE TO NEARLY 120 DOLLARS
Oil prices surged to their highest levels since the summer of 2022 on Monday morning, with Brent crude briefly touching 119.50 dollars per barrel. US benchmark crude also touched 119.48 dollars per barrel during the session.
The primary driver of this surge was intense fear surrounding the Strait of Hormuz, a strategically critical waterway located off the coast of Iran. Approximately one fifth of the entire world’s daily oil supply passes through this narrow strait. Iran had threatened to disrupt or block ship traffic through the strait in response to military action, which sent shockwaves through global energy markets.
According to oil and gas strategists at Macquarie Research, if the Strait of Hormuz remained closed for even a few weeks, oil prices could surge to 150 dollars per barrel or higher. That level of energy prices would represent a serious threat to the global economy.
## **WHY DID OIL PRICES THEN FALL BACK BELOW 90 DOLLARS**?
Oil prices reversed sharply during the final hour of Wall Street trading after President Donald Trump made a series of significant statements to CBS News. Trump said he believed the war with Iran was, in his words, very complete, pretty much. He also stated that Iran had nothing left in a military sense, suggesting the conflict was winding down faster than markets had feared.
Trump additionally raised eyebrows by saying he was thinking about taking over the Strait of Hormuz, a statement that further eased concerns about a prolonged disruption to global oil supply.
Earlier in the day, there had also been talk among the Group of Seven, the world’s seven largest economies, about coordinating action to push back against oil price spikes, which helped begin the decline in crude prices before Trump’s comments accelerated it.
Brent crude settled at 98.96 dollars per barrel in afternoon trading and continued falling below 90 dollars after markets closed. US crude settled at 94.77 dollars before also sinking toward 85 dollars per barrel.
## WHAT IS THE STRAIT OF HORMUZ AND WHY DOES IT MATTER
The Strait of Hormuz is one of the most strategically important energy chokepoints in the entire world. It is a narrow waterway situated between Iran and the Arabian Peninsula, connecting the Persian Gulf to the Gulf of Oman and the wider Arabian Sea.
On a normal day, roughly one fifth of the world’s total oil supply passes through this strait. This includes oil from Saudi Arabia, the United Arab Emirates, Kuwait, Iraq, and Iran itself. Any disruption to traffic through the Strait of Hormuz would immediately reduce global oil supply and push prices sharply higher, affecting economies around the world.
Iran’s earlier threats to disrupt or ignite ships in the strait had directly fueled Monday morning’s oil price spike to near 120 dollars per barrel.
## WHAT DOES HIGH OIL MEAN FOR THE ECONOMY AND INFLATION
Sustained high oil prices pose a serious risk to the global economy on multiple levels. For ordinary households, high oil prices translate directly into higher prices at the gas pump and higher home heating costs. For businesses, elevated energy costs raise expenses for transportation, manufacturing, and logistics, which are typically passed on to consumers in the form of higher prices for goods and services.
The most feared economic outcome from persistently high oil prices is stagflation, a condition where economic growth stagnates while inflation remains elevated. This is considered one of the most difficult economic environments for policymakers to manage, because the tools used to fight inflation, such as raising interest rates, tend to slow economic growth further.
These concerns were already present before Monday’s events. A jobs report released on Friday showed that US employers cut more jobs last month than they created, a discouraging sign for the health of the labour market.
## WHAT ARE GLOBAL STOCK MARKETS DOING
International stock markets, which tend to be more vulnerable to oil price spikes because many countries in Europe and Asia are heavily dependent on imported oil and natural gas, suffered significant declines on Monday before Trump’s comments were made public.
South Korea’s Kospi index fell 6 percent. Japan’s Nikkei 225 tumbled 5.2 percent. France’s CAC 40 declined 1 percent. These sharp drops reflected investor fears about the economic damage that prolonged high oil prices could cause to import-dependent economies.
## **WHAT HAPPENED IN THE BOND MARKET**?
The yield on the US 10-year Treasury bond fell to 4.10 percent by the end of the day, down from 4.15 percent at the close of trading on Friday. Treasury yields had briefly risen above 4.20 percent during the morning session as inflation fears pushed borrowing costs higher. However, as oil prices retreated and growth concerns reasserted themselves, yields pulled back. The bond market’s behaviour on Monday reflected the competing forces of inflation fear, which pushes yields up, versus economic slowdown concern, which pulls yields down.
## WHAT DID TRUMP SAY ON SUNDAY?
On Sunday night, Trump posted on his social media network defending the situation, acknowledging that oil prices were temporarily high but framing it as a worthwhile cost. He argued that short-term oil price increases were a small price to pay for the safety and peace of the United States and the world once the Iran nuclear threat was eliminated.
## EXPERT OUTLOOK ON OIL AND STOCK MARKETS
Despite the extreme volatility in recent sessions, some professional investors are urging calm and pointing to potential opportunity. Sameer Samana, Head of Global Equities and Real Assets at Wells Fargo Investment Institute, stated that the firm continues to believe the current acute oil shortage will be reversed in the coming months as new supply comes online, and that oil prices should drop significantly from current levels.
The US stock market also has a historical track record of recovering relatively quickly from military conflicts, provided that oil prices do not remain elevated for an extended period. Even after all the recent turbulence, the S&P 500 remains within 3 percent of its all-time record set in January 2026, suggesting the broader market has not yet entered serious bear market territory.
## FAQS
### 1.What caused the US stock market to drop on March 10 2026?
The market fell initially due to oil prices spiking to nearly 120 dollars per barrel as the conflict between the United States and Iran intensified and fears grew about disruption to the Strait of Hormuz.
## 2.Why did stocks recover and close higher?
President Trump told CBS News late in the trading session that he believed the war with Iran was essentially over and that Iran had nothing left militarily, calming investor fears about a prolonged conflict.
### 3.Will oil prices go back up?
Analysts at Macquarie Research warn prices could spike to 150 dollars or more if the Strait of Hormuz remains blocked. However, Wells Fargo Investment Institute expects oil to drop significantly in the coming months as new supply enters the market.
### 4.What is stagflation and why are people worried about it?
Stagflation is an economic condition where growth slows while inflation stays high. It is difficult to fix because interest rate increases that fight inflation also slow growth further. High oil prices are considered one of the classic triggers of stagflation.
### 5.Is the S&P 500 in a bear market?
No. Despite recent volatility, the S&P 500 remains within 3 percent of its January 2026 all-time record high.
**Stay ahead of global markets, gold prices, central bank policy, and breaking finance news only on [Daily Finance](https://df.media/)**
**Categories:** Finance, Global News
**Tags:** Iran War, oil price, US Stocks
---
### [How Algreen Capital Built an Investment Model That Puts People and Planet First](https://df.media/algreen-capital-profit-meets-purpose-investing/)
**Published:** March 9, 2026
**Author:** Laura Anderson
**Excerpt:** Algreen Capital invests across AI, blockchain, ESG and property with one mission: building a brighter future for people and the planet.
**Content:**
[Algreen Capital ](https://algreencapital.com/)is a family office with a vision that extends far beyond standard financial returns. At the heart of everything this firm does sits one powerful belief: that building a brighter future for people and the planet is not a distraction from good investing. It is the very definition of it.
Through a carefully constructed portfolio spanning property, listed and unlisted companies, bonds, blockchain, artificial intelligence, and media, and as the founding parent company and lead investor behind iBig, the Impact Business Investment Group, Algreen Capital is building something few investment firms have ever seriously attempted. A model where financial performance and genuine global impact are not competing priorities but the same priority.
Discover the Algreen Capital vision: <https://algreencapital.com/>
---
## **What Is Algreen Capital?**
Algreen Capital is a forward thinking family office and investment firm with a deliberately broad and future focused portfolio strategy.
Unlike institutional investors bound by rigid mandates and narrow sector focuses, Algreen Capital moves across multiple asset classes and industries with one consistent thread running through every decision. Every investment must contribute to building a better world alongside generating strong financial returns.
This dual mandate is not a compromise. It is a strategic advantage. Businesses and assets that align with long term global trends around sustainability, technology, and responsible governance are increasingly delivering the most durable returns. Algreen Capital understood this early and built its entire investment strategy around it.
---
## **A Diverse Portfolio Built for the Future**
Algreen Capital maintains a wide ranging investment strategy that positions the firm across both traditional markets and the most dynamic emerging sectors of the global economy.
### **Property**
Real estate remains one of the most reliable stores of value in any diversified portfolio. Algreen Capital approaches property with both long term capital appreciation and broader societal contribution in mind.
## **Listed and Unlisted Companies**
The firm invests across publicly traded businesses and private companies, giving it access to opportunities at every stage of the commercial lifecycle. This flexibility means Algreen Capital can move early on high potential ventures while staying patient with established businesses building long term value.
### **Bonds**
Fixed income investments provide portfolio stability and contribute to the firm’s overall risk management strategy. Algreen Capital approaches bond selection with the same values driven lens it applies across the rest of its portfolio.
### **Blockchain Technology**
Blockchain represents one of the most significant structural shifts in how global commerce, finance, and ownership are organised. Algreen Capital’s involvement here reflects a conviction that decentralised technology will play a central role in building more transparent and equitable systems across multiple industries.
### **Artificial Intelligence**
AI is not simply a technology trend. It is a fundamental transformation in how businesses operate and how value is created. Algreen Capital’s investment in artificial intelligence reflects a long term view that AI driven businesses will define the next era of global commerce.
### **Media**
Media investment gives Algreen Capital exposure to the businesses shaping how information, culture, and narrative are distributed globally. In an era where storytelling drives brand value and public trust, media remains a strategically significant asset class.
---
## **The iBig Connection: Where Impact Becomes the Strategy**
The most distinctive element of the Algreen Capital model is its role as the founding parent company and lead investor in iBig, the Impact Business Investment Group.
iBig is a dedicated investment group built specifically to support and accelerate the growth of businesses that create measurable positive change in society and the environment. It operates with a strong and explicit focus on the ESG agenda and the United Nations Sustainable Development Goals.
This makes iBig and by extension Algreen Capital genuinely different from the vast majority of investment conglomerates operating today. Most company groups are built purely around financial logic. iBig is built around a mission. The financial returns follow from that mission rather than existing in spite of it.
As the founding parent and lead investor, Algreen Capital provides iBig with the capital base, strategic direction, and long term vision that allows the group to back and build impact driven businesses across multiple industries at a global scale.
---
## **ESG and SDG at the Core of Every Decision**
For Algreen Capital, ESG is not a filter applied after an investment decision has already been made. It is a fundamental input into the investment thesis from the very beginning. Every business evaluated, every sector entered, and every partnership formed is assessed against one question: does it create genuine positive change for society and the environment alongside delivering strong commercial returns?
The United Nations Sustainable Development Goals provide an additional layer of structure to this approach. By aligning investments with specific SDGs, Algreen Capital and iBig ensure that the impact being created is not abstract or unverifiable. It is measurable, reportable, and connected to a globally recognised standard.
This level of commitment to ESG and SDG alignment is rare in the investment world. It is what separates Algreen Capital from firms that treat sustainability as a marketing position rather than a genuine business principle.
---
## **Why Algreen Capital Matters Right Now**
The investment landscape is changing faster than most people realise.
Regulatory pressure around ESG disclosure is increasing in every major financial market. Capital flowing into sustainable and impact aligned investments is growing year on year. The next generation of entrepreneurs are choosing partners based on shared values as much as financial terms.
Algreen Capital is positioned at the exact centre of all three of these shifts. A family office with the flexibility to move across asset classes, the conviction to build around purpose, and the infrastructure through iBig to execute on that vision at a global scale.
---
There are investment firms that talk about building a better world.
Algreen Capital is actually doing it.
Through a diverse and future focused portfolio, a genuine commitment to ESG and SDG principles, and its foundational role behind iBig, Algreen Capital has built an investment model that proves profit and purpose belong together.
For founders, partners, and investors who believe the same thing, Algreen Capital is worth knowing.
**Explore the full vision here: <https://www.ibig.vc/>**
[**Follow Daily Finance**](https://df.media/) for more insights, analysis, and stories from the world of impact investing delivered straight to your feed every day.
**Categories:** Capital Markets, Finance, Investing
---
### [Wall Street in Crisis- Iran War Crashes Stocks Worldwide US Asia Europe and India Hammered](https://df.media/iran-war-crashes-markets-dow-550-pts-oil-72-surge-today/)
**Published:** March 2, 2026
**Author:** Laura Anderson
**Excerpt:** Stock Market Crash Today Iran war kills Khamenei Wall Street Futures Dive 1.1 to 1.5 percent oil hits 72 gold 5400 ATH.
**Content:**
War headlines filled phones worldwide this morning. US -Israel struck Iran killing Supreme Leader Ayatollah Ali Khamenei. Iran hit back hard. Oil prices shot through the roof while stocks crashed from New York to Tokyo. March 2 2026 stands out as a day markets will remember. President Trump announced US operations continue for weeks. No resolution appears close.
Years of tracking finance shocks provide perspective across US Asia Europe and India markets. Simple words real numbers and practical tips follow below.
## The Trigger Weekend War Escalation
Saturday airstrikes targeted 131 Iranian locations eliminating Khamenei. Iran responded against US and Israel bases downed jets in Kuwait and ignited Hezbollah clashes in Lebanon with 31 deaths. Gulf oil refineries caught fire. Strait of Hormuz carrying 20 percent of world oil stalled completely. Trump stated “Several more weeks” of action.
## US Wall Street Futures Signal Bloodbath
US markets face heavy pressure. Pre market futures indicate sharp declines.
| Index | Drop | Points Lost | Level |
|---|---|---|---|
| Dow | 1.1% | 550 | 49240 |
| S&P 500 | 1.1% | 75 | 6823 |
| Nasdaq 100 | 1.5% | 300 | 23255 |
Friday saw Dow down 1.1 percent Nasdaq 0.9 percent S&P 0.4 percent after strong inflation numbers. VIX reached 23.50 up 18 percent. Airlines including Delta at 6.5 percent lower and cruises like Royal Caribbean at 8 percent dropped due to fuel cost worries. Oil companies Exxon up 5 percent and defense firm Lockheed up 5.5 percent gained ground.
## Asia Markets Red Across the Board
Asian sessions ended lower pulling US markets down further.
Japan Nikkei 225 fell 1.46 percent to 57989 with exporters pressured by rising safe haven yen.
Hong Kong Hang Seng dropped 2.01 percent to 26096.
South Korea Kospi declined 1 percent.
Australia ASX 200 lost 0.5 percent.
China Shanghai gained 0.3 percent as the lone exception.
Oil dependent economies like Japan felt the biggest impact.
## Europe Futures Grim Outlook
European markets prepare for turbulence.
| Index Futures | Drop |
|---|---|
| Euro Stoxx 50 | 1.4% |
| DAX Germany | Flat |
| CAC 40 France | 0.47% |
Energy companies rose while autos and airlines fell. ECB monitors rising oil driven inflation.
## India Markets Biggest Loser Today
India recorded steep losses. Sensex tumbled 1300 points or 3 percent to 80119 marking a six month low. Nifty fell below 24800. Investors shed 6.84 trillion rupees equivalent to 82 billion dollars. Banks and IT sectors led declines while metals showed resilience. India VIX rose 17 percent. Foreign investors exited positions erasing recent trade agreement benefits.
**India Snapshot**
| Index | Close | % Change |
|---|---|---|
| Sensex | 80119 | 3% |
| Nifty 50 | 24804 | 1.49% |
## Oil Gold and Bitcoin Safe Haven Rush
Oil prices surged. WTI climbed 8 percent above 72 dollars per barrel. Brent reached 82.37 dollars up 13.76 percent amid Hormuz supply fears.
Gold advanced 3 percent to 5400 dollars per ounce hitting an all time high. Silver increased 2 percent to 95.25 dollars.
Bitcoin traded at 66300 dollars down 2.5 percent after peaking at 68K and dipping to 63K following the strikes.
**Commodity Table Mar 1 2**
| Asset | Yesterday | Peak Today | Change |
|---|---|---|---|
| WTI Oil | 72.48 | 72+ | 8% |
| Gold | 5278 | 5400 | 3% |
| BTC | 68K | 66.3K | 2.5% |
Treasury yield stood at 3.98 percent. Dollar index rose 0.7 percent.
## Quick Global Market Roundup Table
| Region | Key Index | Change | Notes |
|---|---|---|---|
| US Futures | Dow S&P Nasdaq | 1.1 1.5% | Airlines down oil up |
| Asia | Nikkei Hang Seng | 1.46 2% | Yen safe haven |
| Europe Futures | Euro Stoxx | 1.4% | Inflation watch |
| India | Sensex Nifty | 3% 1.5% | 6.84T lost |
## Other Hot Finance Bits
India saw Airtel Google partnership GAIL leadership change and Siemens profit growth of 57 percent. US markets noted Nvidia weakness after earnings. Global trends showed long term IT fund returns turning negative.
## Conclusion A Wake Up Call for All Markets
March 2 brought rapid shifts as war overrode economic data worldwide. Wall Street futures declined sharply while India lost trillions. Oil and gold emerged as short term winners. Stocks recoiled from uncertainty. Conflicts typically resolve over time with potential Hormuz reopening or Iran negotiations sparking recovery. Oil supply updates and Trump statements merit close attention. High volatility creates hidden opportunities amid the turmoil.
## Investor Tips Simple Steps for You
Protect capital with gold ETFs like GLD oil funds XLE and defense plays ITA.
Reduce exposure to airlines such as DAL and travel related assets.
Monitor key levels S&P at 6900 for support or 6730 breakdown. Sensex tests 80K.
Approach crypto cautiously Bitcoin waits while gold outperforms currently.
Adopt long term perspective buying during fear as markets recovered post 2003 Iraq conflict.
Past events like 2022 Ukraine market dips proved temporary. Calm diversification serves best. Comments welcome below next steps planned?
**Stay ahead of global markets, gold prices, central bank policy, and breaking finance news only on [Daily Finance](https://df.media/)**
**Categories:** Bitcoin (BTC), Capital Markets, Concordium (CCD), Cryptocurrency, Ethereum (ETH), Finance, Global News, Investing
---
### [Crypto–Tech Rally Falters as Oil and Gold Track US–Iran Nuclear Talks](https://df.media/crypto-tech-link-oil-gold-move-on-us-iran-talks/)
**Published:** February 26, 2026
**Author:** Laura Anderson
**Excerpt:** Bitcoin slips as Jefferies flags a lasting crypto–tech link. Brent crude and gold hold risk premiums ahead of key US–Iran nuclear talks on February 26, 2026.
**Content:**
**February 26, 2026** \| Global Markets
⚡ **US–Iran talks begin today.** Markets are on edge
---
Global markets are treading carefully on Thursday as traders navigate the collision of geopolitics and monetary policy across a wide range of assets. Bitcoin has pulled back sharply after briefly touching a one-week high, reinforcing what analysts describe as a deepening lock-step between cryptocurrencies and high-growth technology stocks. Meanwhile, crude oil is holding a clear geopolitical risk premium heading into a critical third round of nuclear negotiations between Washington and Tehran, and gold remains well above the $5,100-per-ounce mark as investors continue to pay up for protection against escalation.
---
## Crypto and Tech: A Tightening Relationship
Bitcoin slipped 1.5% to $67,904 in early trade on Thursday after briefly touching $69,847 the prior session — its highest point in a week. The pullback was notable not just for its magnitude, but for what it signals about how digital assets are increasingly trading in tandem with risk-sensitive equities.
Mohit Kumar, economist at Jefferies, flagged the trend directly in a recent note. He pointed to the synchronized movement between cryptocurrencies and technology stocks, adding that investors should expect the relationship to hold. “We believe that the linkage between crypto and tech stocks will persist over the coming months,” Kumar wrote.
The implication for broader markets is significant. When sentiment shifts — whether triggered by policy news, geopolitical headlines, or macro data surprises — both crypto and high-growth tech names tend to move sharply in the same direction. Investors exposed to Nasdaq-style growth stocks may find that Bitcoin’s daily gyrations are an increasingly reliable leading indicator of risk appetite.
---
## Oil: A $10 Premium Riding on Iran Talks
Crude prices edged higher in early European trade, with Brent crude up 0.3% to $70.94 per barrel and West Texas Intermediate rising a similar amount to $65.35 per barrel. The modest gains reflect a market content to hold its current position rather than make aggressive bets ahead of a consequential afternoon.
Later Thursday, US and Iranian negotiators are set to meet for a third round of nuclear discussions — talks that energy markets are watching closely for any signal on the future of Iranian oil supply. Analysts at ING estimate that as much as $10 per barrel of the current price reflects tension-related risk premium, a buffer the market has steadily built in as diplomacy remained uncertain.
The path forward diverges sharply depending on the outcome. A productive session that moves negotiations toward resolution could see crude gradually shed that premium, providing relief for energy-importing economies — including much of Asia and Europe — where elevated fuel costs are feeding through to inflation and corporate margins. A breakdown, on the other hand, would sustain upside pressure on prices, though ING noted that traders may wait to see the scale of any potential US response against Iran before fully repricing the risk.
Adding a supply-side complication to the mix, the latest weekly report from the US Energy Information Administration showed domestic crude inventories jumping by 16 million barrels — the largest single-week build since February 2023. The data point suggests either a softening in near-term demand or a shift in trade flows, and it provides a counterweight to the geopolitical bid currently supporting prices.
---
## Gold: Above $5,100 and Acting as a Portfolio Shield
Gold remains a standout performer over the past week, having climbed more than 3.5% even as intraday volatility keeps traders cautious. New York futures pulled back 0.7% in early trade to $5,191.60 per ounce, a modest retreat after a strong run-up driven by two converging forces: uncertainty over US trade policy and the persistent risk of escalation involving Iran.
Analysts at ING argued that gold’s structural tailwinds remain intact regardless of short-term fluctuations. Any deterioration in the diplomatic track with Tehran, they said, would likely push bullion higher and reinforce its role as a hedge against macro and geopolitical shocks. The rate outlook is also adding nuance — with some market participants now pricing in a scenario where the Federal Reserve holds rates steady for longer than expected, the opportunity cost of holding non-yielding gold stays relatively contained, keeping demand firm.
The broader takeaway from gold’s performance is the signal it sends about overall investor posture. When equities and safe-haven metals both hold elevated levels simultaneously, it suggests a market that is cautiously constructive — willing to hold risk assets, but also actively buying insurance against a policy accident or geopolitical flare-up that could disrupt both growth and stability.
---
## The Bigger Picture
Taken together, Thursday’s market moves tell a coherent story. Crypto and tech are behaving as a unified risk complex, oil is priced for tension that may or may not be resolved, and gold is being used as a hedge by investors who are not yet ready to abandon equities but want protection if conditions deteriorate.
The US–Iran nuclear talks later in the day are the most immediate catalyst to watch. A constructive outcome could lift risk sentiment, ease commodity-driven inflation pressures, and potentially give central banks — including the Federal Reserve — slightly more room to maneuver on rates. A breakdown would likely have the opposite effect, tightening financial conditions at a moment when global growth is already navigating headwinds from trade policy uncertainty and elevated borrowing costs.
**Sources**: Dow Jones Newswires, ING Research, Jefferies, US Energy Information Administration. This article is for informational purposes only and does not constitute investment advice.
**Categories:** Banking
---
### [Nvidia Earnings 2026: The AI Supercycle Faces Its Biggest Test Yet](https://df.media/nvidia-earnings-2026-ai-supercycle-faces-biggest-test/)
**Published:** February 25, 2026
**Author:** Vishnu Priya
**Content:**
SAN JOSE — When Jensen Huang walks into Nvidia’s earnings call tonight, he will carry the weight of the entire artificial intelligence trade on his shoulders.
That is not an exaggeration. Nvidia’s fourth quarter fiscal 2026 results, due after the closing bell today, have become something far beyond a routine corporate disclosure. They are a referendum on whether the most powerful investment theme of the past three years still has legs. They are a test of whether hundreds of billions of dollars in AI infrastructure spending by the world’s largest technology companies is producing the kind of returns that justify doing it all over again in 2026, only bigger.
For investors, analysts and anyone who has watched Nvidia transform from a gaming chip company into the most valuable corporation on the planet, tonight is the moment of truth.
---
## The Numbers Wall Street Is Watching
Analysts going into tonight are projecting revenue of approximately $65.6 billion to $66.1 billion for the quarter. A year ago, Nvidia reported $39.3 billion in revenue for the same period. If the estimates hold, that means Nvidia will have grown its top line by roughly 67 percent in twelve months, a figure that would be the envy of virtually every other company in the S&P 500.
Earnings per share are forecast at $1.52 to $1.53, up from $0.89 last year. The data center division, which has become the undisputed engine of Nvidia’s growth, is expected to generate around $60.2 billion of that total on its own.
But here is what experienced Nvidia watchers know well. Meeting the number is not enough anymore. At a market capitalization of $4.69 trillion, the largest in the world ahead of Apple at $4 trillion and Microsoft at $2.89 trillion, the stock has already priced in a great deal of good news. What moves Nvidia from here is the forward guidance. Analysts are watching for first quarter fiscal 2027 revenue guidance of around $72.5 billion. Anything short of that and the after-hours reaction is likely to be swift and unforgiving.
---
## Why the Hyperscalers Are Everything Right Now
The story underneath Nvidia’s data center numbers is really a story about four companies: Amazon, Google, Microsoft and Meta. Together, these four technology giants have committed to spending an estimated $650 billion on AI-related capital expenditures in 2026 alone. A very large share of that money flows directly to Nvidia in the form of GPU purchases, server racks and the high-performance computing infrastructure that makes modern AI applications possible.
Amazon and Alphabet have already told investors publicly that AI infrastructure spending will be a defining priority this year. Microsoft continues expanding its Azure AI platform at a pace that requires enormous amounts of Nvidia hardware. Meta, meanwhile, just deepened its relationship with Nvidia through a significant multiyear agreement that covers both Blackwell and Rubin AI processors, and also includes the first large-scale standalone deployment of Nvidia’s Grace CPU servers.
When your four biggest customers are each spending more on your products than most countries spend on their entire defense budgets, it creates a revenue base that is nearly impossible to replicate in any other industry. That is the position Nvidia finds itself in as it heads into tonight’s report.
---
## Blackwell Ultra Could Be the Surprise Nobody Is Fully Pricing In
Investors and analysts tend to focus on what Nvidia has already shipped. But KeyBanc Capital Markets analyst John Vinh made an interesting argument in his pre-earnings note this week, suggesting that the market may be underestimating the impact of Blackwell Ultra, the next generation of Nvidia’s already formidable Blackwell chip architecture.
Blackwell Ultra carries a 20 to 30 percent higher average selling price compared to standard Blackwell chips. That matters because even modest shifts in the mix of chips Nvidia ships, toward higher-priced Blackwell Ultra units and away from standard Blackwell, can have a meaningful and disproportionate effect on both total revenue and gross margins. Vinh also noted that Nvidia remains on track to ship nearly 30,000 AI server racks this year, a figure that underlines just how industrialized the AI buildout has become.
These are not prototype deployments or pilot programs anymore. This is full-scale infrastructure construction, the digital equivalent of building highways and power grids, happening simultaneously across dozens of countries and hundreds of facilities.
---
## Gaming Is Having a Quiet Revival
Lost in all the AI conversation is the fact that Nvidia’s gaming business is performing better than it has in years. Analysts expect gaming revenue of approximately $4 billion for the quarter, representing 58 percent growth compared to the same period last year. For a division that was overshadowed and somewhat neglected during the peak AI frenzy, that is a remarkable comeback.
There is also a potentially significant development on the horizon for Nvidia’s presence in personal computing. Reports have emerged suggesting the company is preparing to launch its own laptop CPU, which would place it in direct competition with Intel, AMD and Qualcomm in the PC market. The financial scale of laptop processors is nowhere near data center revenue, but a successful move into high-performance laptops would meaningfully extend Nvidia’s reach into the hundreds of millions of users who buy premium computers for gaming, creative work and increasingly, running AI models locally on their own devices.
---
## The China Wildcard
No Nvidia earnings call in recent memory has passed without a detailed and careful discussion of China, and tonight will be no different. The situation remains genuinely complicated and the market will be listening closely for any clarity Huang can provide.
On the positive side, the US government has signaled that Nvidia can resume certain chip sales to China. Reuters reported this week that Chinese authorities specifically approved purchases of Nvidia’s H200 processors by Alibaba Group and Tencent, despite earlier official guidance from Beijing encouraging Chinese technology companies to favor domestically developed chip alternatives.
On the negative side, demand signals from China remain mixed and difficult to read. Domestic Chinese semiconductor companies are developing their own AI chips with increasing urgency, backed by significant government support. The broader trade environment adds another layer of uncertainty, with China’s cargo gap with the United States now estimated at $112 billion as tariff evasion activity reaches record levels.
How Huang characterizes Chinese demand tonight, whether he frames it as a growing opportunity or a manageable uncertainty, will likely move the stock in a meaningful way regardless of what the headline revenue number shows.
---
## What Happened Last Time Markets Got Nervous
The recent volatility in AI-related stocks is worth understanding as context for tonight’s report. Just weeks ago, a research note from analyst firm Citrini flagged concerns about near-term AI disruption risks and triggered a sharp selloff that sent Indian IT stocks to their lowest level in 30 months and rattled technology shares more broadly. The Citrini founder himself expressed surprise at how strongly markets reacted to his firm’s analysis.
That episode revealed something important about where investor psychology stands heading into Nvidia’s report. Confidence in the AI trade remains high but it is no longer unconditional. The market has become more sensitive to any suggestion that AI spending might slow, that returns on AI investment might take longer than expected to materialize, or that competition might begin eroding the pricing power that has allowed Nvidia to report the kinds of margins that most technology companies can only dream about.
Nvidia has beaten expectations and delivered positive surprises consistently enough that investors have learned to trust its results. But the starting point for this quarter, a $4.69 trillion market cap and a price-to-earnings ratio of 47.45, leaves almost no room for a stumble.
---
## GTC 2026 and Vera Rubin: The Story After the Story
Tonight’s earnings report is, in a sense, the opening act for what may be an even more consequential moment for Nvidia in the weeks ahead.
Shortly after the results, attention will turn to Nvidia’s GTC 2026 developer conference in San Jose, California. GTC is Nvidia’s annual showcase for its technology roadmap and it is where Jensen Huang has historically made some of the company’s most significant and market-moving announcements.
This year’s conference carries particular weight because it follows the January debut of Vera Rubin, Nvidia’s latest AI superchip unveiled at CES in Las Vegas. Vera Rubin represents the next architectural step beyond Blackwell and GTC is expected to be the moment when Huang fully unveils the product story, including performance benchmarks, availability timelines and the broader AI infrastructure vision the chip enables.
For investors playing the long game, GTC 2026 may ultimately prove more important than the quarterly earnings number that markets will react to tonight.
---
## What Is Actually Being Decided Tonight
Strip away all the analyst estimates, the segment forecasts and the technical chart analysis and what Nvidia’s earnings really come down to tonight is one central question.
Is the AI supercycle real and durable, or is it a capital spending boom that is beginning to outrun the actual economic returns of AI technology?
The hyperscalers spending $650 billion on AI infrastructure this year are making a bet. They are betting that the AI applications being built on this infrastructure will generate enough revenue, enough productivity gains and enough competitive advantage to justify every dollar of that investment. Nvidia’s results tonight will tell us whether that bet is being placed with growing conviction or whether the first signs of hesitation are starting to appear in the order books.
Jensen Huang has made skeptics look foolish before. He has stood at the front of rooms full of doubters and delivered numbers that made every bearish argument look naive in retrospect.
Tonight he gets another chance to do exactly that. And the entire technology investment world will be watching when he does.
---
## Frequently Asked Questions
**When does Nvidia report Q4 2026 earnings?**
Nvidia reports its fourth quarter fiscal 2026 earnings after the market close today, Wednesday February 25, 2026. The analyst call follows the release shortly after.
**What revenue is Nvidia expected to report?**
Analysts forecast revenue of approximately $65.6 billion to $66.1 billion, representing around 67 percent year over year growth from $39.3 billion in the same quarter last year.
**What is the Blackwell Ultra chip?**
Blackwell Ultra is the next generation of Nvidia’s Blackwell AI chip architecture. It carries a 20 to 30 percent higher average selling price than standard Blackwell chips and is expected to be a significant contributor to data center revenue growth.
**What is Nvidia’s current market capitalization?**
Nvidia’s market cap stands at approximately $4.69 trillion as of February 2026, making it the largest company in the world by market value, ahead of Apple at $4 trillion and Microsoft at $2.89 trillion.
**What is GTC 2026?**
GTC 2026 is Nvidia’s annual developer conference in San Jose, California taking place shortly after today’s earnings. Jensen Huang is expected to unveil full details about the Vera Rubin superchip and outline Nvidia’s next phase of AI product development.
**Can Nvidia sell chips to China?**
The US government has signaled that Nvidia can resume certain chip sales to China. Chinese authorities approved H200 processor purchases by Alibaba and Tencent specifically, though broader demand signals from China remain mixed.
**What is the AI supercycle?**
The AI supercycle refers to the current unprecedented wave of capital spending on AI infrastructure by major technology companies. Amazon, Google, Microsoft and Meta collectively plan to spend an estimated $650 billion on AI capital expenditures in 2026, much of it flowing toward Nvidia hardware.
**What should investors watch for beyond the headline number?**
The first quarter fiscal 2027 guidance figure is the single most important data point beyond Q4 results. Analysts expect guidance of around $72.5 billion. Huang’s commentary on China demand and any GTC 2026 preview will also move markets significantly.
---
## The Bottom Line
Nvidia has earned every bit of the extraordinary position it occupies in global markets today. It identified the AI wave early, built the right products with relentless precision and delivered results that consistently made skeptics regret their doubts.
Tonight is the latest and perhaps highest-stakes chapter in that story. The numbers will matter. The guidance will matter more. And what Jensen Huang says about where Nvidia is going next may matter most of all.
The AI supercycle put Nvidia at the top of the world. Tonight we find out whether it intends to stay there.
**Categories:** Business, Finance
---
### [US Market Shock: Trump Sets 15% Global Tariff After Supreme Court Ruling](https://df.media/us-market-shock-trump-sets-15-global-tariff-after-supreme-court-ruling/)
**Published:** February 23, 2026
**Author:** Vishnu Priya
**Content:**
**WASHINGTON D.C.** — In a day of dizzying legal turns and high-stakes brinkmanship, the American financial landscape was turned upside down this Monday. What started as a historic victory for free-trade advocates in the halls of the Supreme Court ended with a defiant double down from the Oval Office, leaving investors with a severe case of policy whiplash.
### A Short-Lived Victory for Importers
The morning began with a bombshell from the Supreme Court. In a 6-3 landmark decision, the Justices struck down President Trump’s sweeping reciprocal tariffs. The Court’s opinion was pointed: it ruled the administration had illegally stretched executive emergency powers (the IEEPA) to bypass Congress, failing to prove that a legitimate balance-of-payments crisis actually existed.
For roughly ninety minutes, the mood on Wall Street was electric. Futures for major retailers like Walmart and Target turned green, and international markets particularly in India and Southeast Asia saw a massive relief rally. The era of the global trade war, it seemed, had hit a judicial brick wall.
### The 15% Counter-Punch
That optimism evaporated by mid-morning. Proving that he has no intention of backing down, President Trump stood before cameras at the White House and effectively hit the reset button—harder.
Invoking Section 122 of the Trade Act of 1974, the President announced a brand-new **15% global levy**. Not only did he bypass the court’s specific legal objections, but he actually increased the tax from the previous 10% rate.
The President declared that the courts can play their games, but he is playing for the American worker. He suggested that if 10% was a problem for the judges, they could see how they like 15%.
### Chaos on the Trading Floor
The reaction from the markets was a swift, collective groan. S&P 500 futures, which had been up on the court news, swung violently into the red, dropping **0.7%**. The tech-heavy Nasdaq took an even harder hit, falling **1.0%** as traders realized that the supply chain nightmare for hardware and electronics isn’t over it’s getting more expensive.
The immediate fallout is a logistical and legal mess:
- **The Refund Trap:** U.S. Customs is now sitting on an estimated **$175 billion** in illegal tariffs collected over the past year. Companies are already filing a mountain of paperwork to get that cash back, even as they brace for the new 15% hike starting tomorrow.
- **The Flight to Safety:** With the U.S. government now in a direct constitutional cat-and-mouse game, investors fled to gold, pushing the metal back toward its record territory of **$5,100 per ounce**.
- **The Tech Shield:** All eyes are now pinned on **Nvidia**, which reports earnings this Wednesday. Investors are desperately hoping the AI boom is strong enough to outrun the escalating trade war.
### Predictions: What Happens Next?
- **The Nvidia Hedge:** Expect massive volatility in the 48 hours leading up to Wednesday’s Nvidia earnings. If the AI giant misses even slightly, the double whammy of trade uncertainty and a tech slowdown could trigger a 3–5% broad market correction.
- **A New Legal Cycle:** Constitutional scholars predict the new 15% tariff will face immediate injunction filings in lower courts by the end of the week. However, since the President is using Section 122 (Trade Act), the legal path for challengers will be much longer and steeper than the previous IEEPA battle.
- **Consumer Price Hikes:** Retailers have exhausted their inventory buffers. Expect a visible jump in consumer electronics and apparel prices by the Q3 back-to-school season as companies pass the 15% levy directly to shoppers.
### FAQS
1.**What exactly did the Supreme Court rule?** The Court decided that the President cannot use “Emergency Economic Powers” to tax the entire world just because of a trade deficit. They ruled that only Congress has the power to set taxes (tariffs).
2.**Does this mean I get a refund on goods I already bought?** Likely no. While big corporations will sue the government for the $175 billion in collected tariffs, those savings rarely trickle back down to the individual consumer.
3.**Why is Bitcoin falling if it’s “Digital Gold”?** In times of extreme policy uncertainty, Bitcoin often trades like a high-risk tech stock. Today’s 5% drop suggests traders are liquidating “risky” assets to cover losses elsewhere.
4.**How does the 15% tariff affect my 401(k)?** In the short term, it creates “drag” on profits for multinational companies. However, domestic-focused small caps might see a relative boost if they don’t rely on imports.
**Follow [DAILY FINANCE](https://df.media/) for Real-Time Updates**
Stay connected with the heartbeat of the markets. For breaking news alerts, expert commentary, and exclusive financial data, follow our official channels:
**Categories:** Banking
---
### [India's AI Funding -$200 billion in AI-driven investments over the next two years](https://df.media/200-billion-india-ai-funding-who-invested-how-much/)
**Published:** February 20, 2026
**Author:** Vishnu Priya
**Content:**
**India AI funding** is no longer driven by exploratory interest or early-stage pilots. At the[ India AI Impact Summit 2026](https://beststartup.in/india-ai-impact-summit-2026-complete-guide/) in New Delhi, government officials confirmed that India expects to attract more than **$200 billion in AI-driven investments over the next two years** ,a figure that reflects committed capital, not aspirational targets.
Technology Minister Ashwini Vaishnaw stated clearly that investment is visible across every layer of India’s AI stack, from deep-tech startups securing venture capital to large enterprises building AI platforms to research commitments targeting next-generation foundational models.
[For Daliy Finance readers](https://df.media/), the key number is not just $200 billion. It is the structure behind that number cross-sector, multi-layer, and backed by balance sheets of global consequence.
---
## The $200 Billion Projection — And Why It’s Conservative
To understand why the $200 billion figure likely undersells the total opportunity, consider what is already on the table. The five largest disclosed commitments from Reliance, Adani, Microsoft, Amazon, and Google alone exceed $270 billion. When startup funding, sovereign wealth inflows, and mid-tier technology investments are added, the total addressable capital flow into India’s AI ecosystem could be substantially higher.
The government’s $200 billion projection captures committed, announced capital. It does not capture secondary investment effects: the supply-chain spending triggered by data center construction, the enterprise software markets created by AI infrastructure, or the startup funding cycles that follow hyperscaler expansion. For every dollar of direct infrastructure investment, analysts typically estimate two to three dollars of downstream economic activity.
---
## Verified Funding Snapshot: Who Invested and How Much
The table below consolidates publicly disclosed, reaffirmed, and widely reported investment commitments from major players as confirmed through company disclosures and major financial publications, including Bloomberg.
| Investor / Company | Disclosed Investment | Timeframe | Primary AI Focus |
|---|---|---|---|
| Reliance Industries | ~$110 billion (₹10 trillion) | 7 years | Sovereign AI, hyperscale data centres, AI platforms |
| Adani Group | ~$100 billion | By 2035 | Renewable-powered AI data centre infrastructure |
| Microsoft | ~$17.5 billion | Multi-year | Cloud, AI compute, enterprise AI, skilling |
| Amazon (AWS) | ~$35 billion | By 2030 | Cloud workloads, AI infrastructure, logistics tech |
| Google | ~$10 billion | Ongoing | AI research, India-specific models, cloud expansion |
These figures represent committed or formally reaffirmed investments, not speculative forward projections or intent announcements.
---
## India’s Five-Layer AI Stack: Where Capital Is Being Deployed
The Indian government’s AI framework is structured around five distinct deployment layers, and Investment Minister Vaishnaw confirmed that capital is flowing across all five simultaneously. This multi-layer deployment is what separates the current cycle from previous Indian technology investment waves.
The five layers are AI-powered applications for enterprise and consumer markets, advanced and foundational AI models, high-performance compute capacity, data centers and network infrastructure, and the energy systems that power AI workloads at scale. The simultaneous build-out of all five layers creates compounding value effects that single-layer investment cannot replicate.
---
## What the Money Will Build—Four Execution Layers
Across summit panels, a consistent theme emerged: capital discipline. This is not diffuse spending. It is being channelled into four execution-focused areas.
AI-grade physical infrastructure is the primary destination. Hyperscale data centers, GPU-dense compute clusters, sovereign cloud platforms, and semiconductor partnerships are absorbing the largest individual capital commitments. India’s policy emphasis on data localization makes domestic AI infrastructure a strategic national necessity, not an optional investment.
Enterprise AI adoption across banking, healthcare, manufacturing, logistics, and government services represents the second execution layer and the most commercially significant one. This is where recurring revenue, long-term contracts, and productivity-linked returns emerge. The market is deep, and the penetration rate is still low.
India-specific AI system development, multilingual models, public-sector platforms, and locally trained solutions form the third layer. This reduces India’s dependency on imported AI systems and generates domestic intellectual property with export potential.
Talent and skilling ecosystems form the fourth layer. Without trained engineers, data scientists, and AI-literate professionals at scale, infrastructure spending stalls. India’s talent pipeline is one of the primary reasons global capital is comfortable deploying long-duration funds here.
---
## Sector-by-Sector Capital Allocation
Summit discussions and post-summit disclosures indicate that AI investment is concentrating in five high-priority verticals.
Financial services and fintech will absorb the largest enterprise AI spend, driven by credit automation, fraud detection, and AI-linked banking infrastructure. Healthcare is attracting both private capital and government AI spending, particularly for diagnostic AI and hospital operations.
Manufacturing benefits from AI-driven supply chain optimization and export-linked demand as India positions itself as an alternative production hub. Clean energy and AI infrastructure are deeply linked: major AI data center projects are being co-located with renewable energy generation, creating integrated investment opportunities. Agri-tech and public services round out the top five, representing lower-margin but high-scale AI deployment that expands India’s overall AI GDP contribution.
---
## Why This Week Changed the Investor Calculus on India
Three signals converged at the India AI Impact Summit 2026 that shifted how global capital views India’s AI opportunity.
First, the presence of over twelve heads of state alongside global AI leaders, including executives from OpenAI, Alphabet, and Anthropic, confirmed that AI in India is a geopolitical story, not just a market story. Capital follows strategic alignment.
Second, the government’s five-layer framework gave investors a structural anchor. AI investment without a policy framework creates regulatory risk. With one, it creates a pipeline.
Third, the scale of domestic capital commitment from Reliance and Adani signals that India’s wealthiest balance sheets are betting on AI as India’s next foundational infrastructure cycle comparable to telecom in the 2000s or highways in the 1990s.
For DF Media readers: this week did not create India’s AI momentum. It verified it at the highest level of global authority.
---
## FAQs: India AI Funding Explained
### **1. How much AI investment did India attract at the 2026 AI Summit?**
The government confirmed more than $200 billion in expected AI-driven investments over two years, with disclosed commitments from five major investors exceeding $270 billion.
### **2. Which company is investing the most in India’s AI ecosystem?**
Reliance Industries leads with approximately $110 billion (₹10 trillion) committed over seven years toward sovereign AI infrastructure, data centres, and platforms.
### **3. What is the five-layer AI framework the Indian government announced?**
It spans AI applications, AI models, compute capacity, data centres and network infrastructure, and energy systems enabling AI deployment at national scale.
### **4. Is Google investing in India’s AI future?**
Yes. Google has committed approximately $10 billion toward AI research, cloud infrastructure, and the development of India-specific language models
### **5. What is Adani Group’s AI investment plan?**
Adani Group has outlined up to $100 billion in investments by 2035, focused on renewable-energy-powered AI data centres and large-scale compute infrastructure.
### **6. How much has Microsoft committed to India’s AI ecosystem?**
Microsoft has pledged approximately $17.5 billion toward cloud infrastructure, enterprise AI tools, and AI workforce development in India.
### **7. What will Amazon invest in India’s AI space?**
Amazon plans to invest over $35 billion by 2030 through AWS, targeting AI workloads, cloud infrastructure, and logistics technology.
### **8. Which sectors will receive the most AI funding in India?**
Financial services, healthcare, manufacturing, clean energy infrastructure, and digital governance are the top five sectors identified for concentrated AI capital deployment.
### **9. Did NVIDIA invest in India at the AI Summit?**
NVIDIA CEO Jensen Huang was unable to attend due to unavoidable circumstances. Government officials confirmed that NVIDIA continues active collaborations with Indian firms on AI infrastructure and software investments, though specific figures were not disclosed.
### **10. Why is global capital now treating India as a long-term AI investment destination?**
India offers scale, talent depth, policy clarity, lower infrastructure costs, and a multi-decade adoption runway a combination that institutional investors view as a conviction-grade, long-duration capital deployment opportunity
**Categories:** Global News
**Tags:** ai funding, ai impact summit
---
### [Anthropic Effect in Finance 2026: Why Markets Behave the Way They Do](https://df.media/anthropic-effect-in-finance-2026-market-survival-bias/)
**Published:** February 6, 2026
**Author:** Vishnu Priya
**Content:**
**The Observable Market Paradox**
In February 2026, financial markets present a peculiar phenomenon that challenges conventional investment wisdom. Equity indices advance. Mega-cap leaders thrive. Headlines signal resilience. Yet beneath this surface strength, corporate failures, delistings, and startup collapses accelerate at rates 18-34 percent above prior year levels.
This divergence is not a contradiction. It is a structural feature of modern markets. What we observe is a visibility distortion where surviving companies dominate index performance while failed firms quietly exit datasets. This phenomenon explains why markets appear strong even as economic attrition intensifies.
The Anthropic Effect in Finance represents one of the most underappreciated risks facing modern investors. Unlike volatility, inflation, or geopolitical uncertainty, it operates invisibly. It does not announce itself. Instead, it reshapes your understanding of how markets work by allowing you to observe only what survived.
## What Is the Anthropic Effect in Finance?
The Anthropic Effect is a cognitive distortion created by observing only outcomes that survived to be observed. Failed companies disappear from market data. Collapsed funds vanish from records. Bankrupt institutions cease to exist in databases. You see only what survived.
During the late 1990s technology boom, thousands of internet startups received venture capital. Investors celebrated the winners—Amazon, eBay, Google. These survivors defined the narrative. The other 9,800 companies that failed? They disappeared. Consequently, the narrative became: “Internet companies are revolutionary.” The reality was: “1 out of 10,000 generated extraordinary returns. The other 9,999 lost money.”
This is the Anthropic Effect. It creates a distorted view of market reality by allowing you to observe only survivors.
January-February 2026: Markets Rising, Companies Disappearing
January 2026 Performance Data
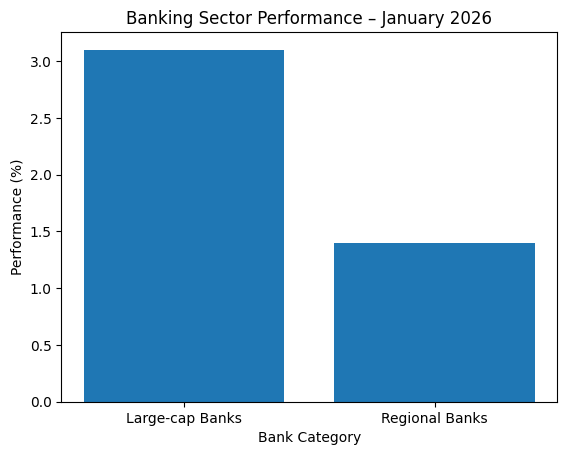The S&P 500 gained 4.2 percent from January 2-31, 2026. However, this headline masks substantial internal divergence:
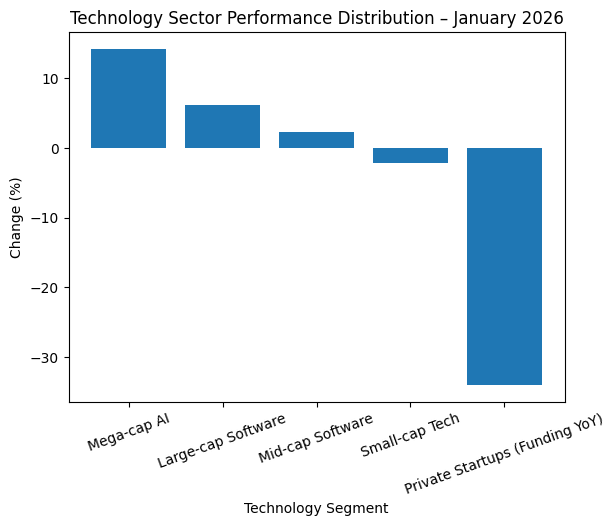Mega-cap technology stocks gained 8.7 percent. Mid-cap stocks gained only 1.2 percent. Small-cap stocks declined 0.8 percent.
The Magnificent Seven (Apple, Microsoft, Nvidia, Tesla, Amazon, Meta, Google) comprise approximately 38 percent of S&P 500 market capitalization. Their 8.7 percent gain largely drove the index’s 4.2 percent advance.
Within technology specifically:
- Mega-cap AI companies: +14.2%
- Large-cap software: +6.1%
- Mid-cap software: +2.3%
- Small-cap tech: -2.1%
- Venture funding: -34% year-over-year
## **Banking Performance and Consolidation**
Large-cap banks gained 3.1 percent during January 2026. Regional banks gained only 1.4 percent. More significantly, three regional banks were acquired at prices 15-22 percent below book value during the month.
DF Media Insight: Banking stability in 2026 is less about recovery and more about consolidation efficiency. Large-cap survivors appear resilient because weaker regional institutions are absorbed before failure becomes visible. Once acquired, they cease to exist as independent data points.
**Energy Sector: Survivor Strength**
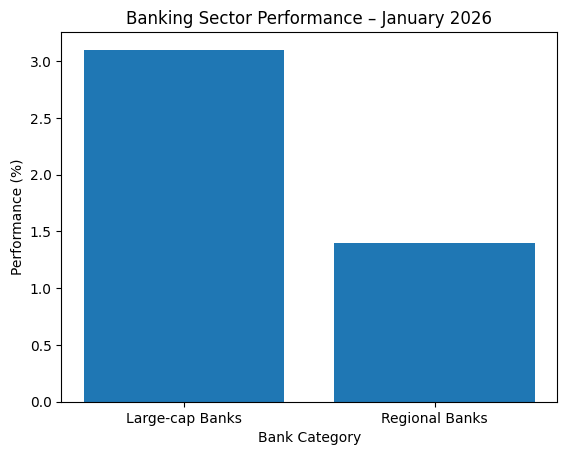The Energy Select Sector Index gained 2.8 percent in January. Large-cap energy companies gained 4.1 percent. Oil averaged $78 per barrel, ranging between $74-$82.
However, 23 energy companies and 12 renewable energy companies ceased operations between January 1 and February 6, 2026.
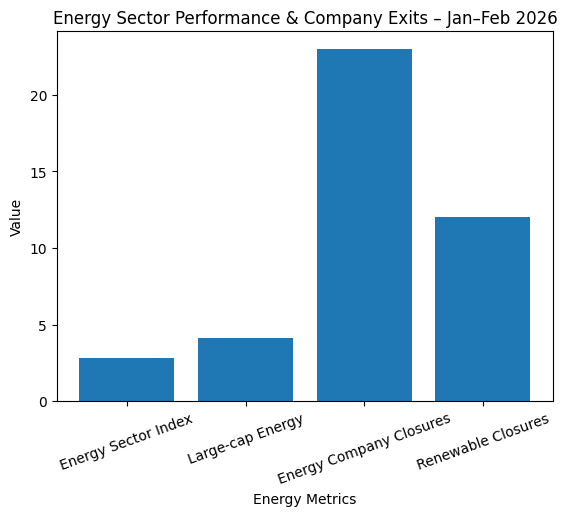DF Media Insight: Energy stability in 2026 is scale-dependent, not sector-wide. Resilience is concentrated among integrated majors while smaller producers exit quietly.
## **February 2026 Continuation: Strength With Acceleration**
Between February 1-6, 2026, the established pattern intensified:
Magnificent Seven: +2.1%
Nasdaq-100: +1.9%
S&P 500: +1.1%
Simultaneously, company exits accelerated:
- Delistings YTD: 47 (+23% versus historical average)
- Bankruptcy filings YTD: 312 (+18% versus prior year)
- Startup failures: +34% year-over-year
- Technology company closures: 134 companies
**Credit Markets Signal Caution**
While equity markets advanced, credit signals diverged:
Federal Funds Rate: 4.25-4.50% (unchanged)
10-Year Treasury: Declined from 4.42% to 4.18%
Corporate bond spreads: Widened from 105 to 112 basis points
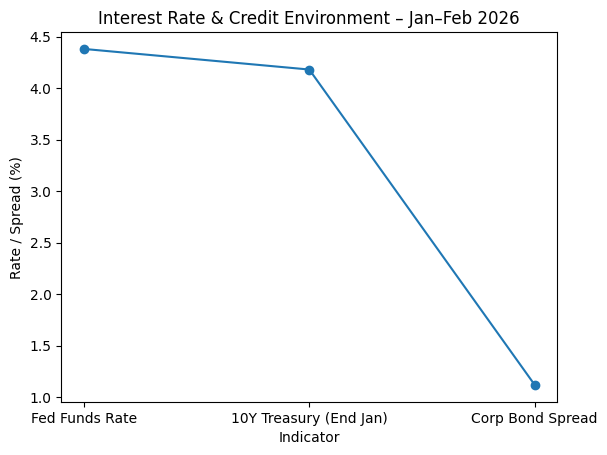**DF Media Insight:** Equity markets are pricing relief. Credit markets are pricing caution. Lower yields support equity valuations, but widening spreads indicate rising borrower risk. Only companies with strong balance sheets remain visible in public markets. Weaker borrowers have been eliminated through bankruptcy or distressed acquisition.
**Why the Anthropic Effect Matters in 2026**
**First: You Make Decisions on Incomplete Data**
When you analyze historical stock performance, you analyze only stocks that currently exist. You cannot study the 134 technology companies that ceased operations in January-February 2026 because they no longer exist. Every investment decision is based on filtered datasets that eliminate all failures.
Consequently, historical returns appear higher than they actually were. Success rates appear higher. Market efficiency appears higher. The 47 delistings, 312 bankruptcy filings, and accelerating company closures represent real wealth destruction absent from mainstream narratives.
**Second: Obvious Narratives Are Based on Survivorship**
“Passive investing outperforms active management.” This appears true when examining historical data. However, passive funds own 95 percent capital in stocks that survived. They own zero percent in the 47 delisted companies.
“Technology is resilient.” Tech mega-caps gained 8.7 percent in January 2026. However, 134 technology companies ceased operations simultaneously. You only see the ones that bounced back.
“Energy is stable.” Energy mega-caps gained 4.1 percent. Meanwhile, 35 energy and renewable companies failed. The narrative masks the pattern.
**Third: Markets Advance While Ecosystems Shrink**
The core paradox: Markets gained 4.2 percent while delistings accelerated 23 percent above average and bankruptcies increased 18 percent year-over-year. These trends coexist because failing companies vanish from indices before impacting returns.
**DF Media Insight:** Markets are not stronger in 2026. They are narrower. What we observe is rapid concentration of capital into mega-cap survivors while mid-cap and small-cap ecosystems contract.
**Fourth: Artificial Intelligence Amplifies the Bias**
AI systems train on historical market data containing only survivors. They learn patterns from 134 technology companies that survived January-February 2026. They learn zero patterns from the technology companies that ceased operations because no historical data exists.
In 2026, AI concentrates capital into 50 mega-cap stocks while 5,000 mid-cap stocks receive declining investment. This is not because mega-caps are inherently superior. It is because AI systems cannot see mid-caps that failed and therefore ceased being observed.
**Fifth: The Real Risk Is What You Cannot See**
Risk management focuses on volatility, correlation, and drawdowns. These are measurable quantities. The greatest risk companies failing and disappearing is invisible because it has already been eliminated.
In 37 days of 2026, 47 companies delisted and 312 filed bankruptcy. These represent real capital losses absent from volatility calculations. This is the true risk facing investors in 2026.
**Practical Solutions**
Track Disappearances: Monitor delistings, bankruptcies, and companies acquired below book value. A market advancing 4.2 percent while delistings surge 23 percent indicates sector concentration, not strength.
Build Scenario Portfolios: Rather than predicting market movement, construct positions that survive multiple futures. Ask: What if this sector doubles? Declines 40 percent? Stays flat for three years? If all scenarios are manageable, the position is appropriate.
Embrace Portfolio Humility: You cannot predict which companies survive 2026. Consequently, diversify across 20-30 quality companies rather than concentrate in five stocks you believe will dominate. Acknowledge the limits of human knowledge.
Read What Media Ignores: Financial media covers rallies and successes. Study the 312 bankruptcies, 47 delistings, and 134 technology company closures that media does not emphasize. This reveals the actual market structure.
Question Obvious Narratives: Whenever a narrative appears obvious”markets are strong,” “technology is resilient,” “mega-caps are superior”—examine whether it is based on complete information or only survivor information. The first narrative obscures 47 delistings and 312 bankruptcies. The second obscures 134 technology company failures. The third ignores that only 50 mega-caps captured gains while 5,000 mid-caps declined.
**Why Market Survival Beats Market Prediction**
The Anthropic Effect in Finance will not change. Markets will always show only survivors. Failed companies will always disappear from databases. Unsuccessful strategies will always vanish.
However, your response can change.
You can continue making decisions based on incomplete survivor data, assuming obvious market narratives reflect complete reality. The data from January-February 2026 contradicts this. While markets gained 4.2 percent, companies failed at accelerated rates. While technology gained 8.7 percent, 134 technology companies ceased operations. While energy appeared stable, 35 energy and renewable companies failed.
Alternatively, you can acknowledge that every market narrative is based on filtered, survivor data. You can build portfolios designed to survive multiple scenarios. You can embrace humility regarding prediction capability.
DF Media Closing Outlook: The defining risk of 2026 is not volatility. It is false confidence driven by selective visibility. In 2026, markets are not stronger. They are narrower.
In markets where survivors dominate visibility and failures disappear from data, understanding what you cannot see is more valuable than understanding what you can.
**Categories:** Banking
---
### [Bitcoin Enters Critical Macro Week Near $68600 Amid Key US Economic Data](https://df.media/bitcoin-macro-week-2026-key-us-economic-data-impact/)
**Published:** February 16, 2026
**Author:** Vishnu Priya
**Content:**
**February 16, 2026 – Bitcoin is navigating a pivotal macro week as it trades near $68,600, following a sharp retracement from 2025 highs above $126,000. Investors are closely monitoring US economic indicators that could determine the next major BTC move.**
After a volatile start to the year, including pressure from tariff tensions, sticky inflation, and the Federal Reserve’s pause on rate cuts, markets remain cautious. With US markets closed Monday for Presidents’ Day, lower liquidity could amplify Bitcoin volatility once key economic data is released midweek.
---
### Key US Economic Reports Impacting Bitcoin
Traders are focused on four major releases this week:
1. **January FOMC Minutes** – Wednesday
2. **Initial Jobless Claims** – Thursday
3. **Q4 2025 GDP Final Revision** – Friday
4. **December PCE Inflation** – Friday
CME FedWatch data shows only a 9.8% probability of a March rate cut, reflecting skepticism about near-term easing. Even modest data surprises could push Bitcoin toward $70,000 resistance or back to $60,000 support.
---
### FOMC Minutes: The Fed’s Policy Insight
Wednesday’s FOMC minutes will provide deeper insight into Federal Reserve policymaking. The Fed held rates steady at 3.50–3.75% in its last meeting, citing resilient growth and persistent services inflation.
- **Hawkish signals:** Could reinforce “higher for longer” expectations, triggering 3–5% Bitcoin pullbacks as Treasury yields rise.
- **Dovish or balanced signals:** May revive rate-cut speculation, driving BTC toward $70,000 in thin holiday-trading conditions.
---
### Initial Jobless Claims: Measuring Labor Market Strength
Thursday’s report offers a real-time view of labor market health:
- **Below 210,000:** Signals strong employment, reducing easing expectations, pressuring BTC 1–3% lower.
- **Above 230,000:** Points to potential softening, boosting Bitcoin 2–4% as markets price in faster Fed action.
BTC’s $68,000–$69,000 consolidation means this report may bridge insights from the FOMC minutes to Friday’s inflation release.
---
### Q4 2025 GDP Revision: Growth and Market Impact
Friday’s GDP revision is expected at +2.5% annualized growth, down from the initial +4.4% estimate:
- **Below 2.3%:** Reinforces slowdown narratives, potentially lifting Bitcoin 3–6%.
- **Above 2.7%:** Strong growth could delay easing, weighing on crypto markets.
Consumer spending, comprising about 70% of GDP, will be a closely watched metric.
---
### December PCE Inflation: The Fed’s Core Gauge
The PCE inflation report is the week’s most critical catalyst:
- **0.2% MoM (cooler-than-expected):** Signals disinflation, increases rate-cut probability, and could spark a 4–8% Bitcoin rally above $70,000.
- **Above 0.3% MoM:** Reinforces sticky inflation concerns, pressuring BTC down 3–5%.
---
### Why This Week Matters for Bitcoin
Bitcoin remains highly sensitive to US macroeconomic trends. Traders should watch the FOMC minutes, jobless claims, GDP revisions, and PCE data for indications of interest rate moves, inflation trends, and overall market risk appetite. Even subtle surprises could trigger meaningful price swings.
**Categories:** Banking
---
### [Alphabet’s 100-Year Bond Fuels Debate Over AI Debt Surge](https://df.media/alphabets-100-year-bond-sparks-ai-debt-bubble-concerns/)
**Published:** February 12, 2026
**Author:** Vishnu Priya
**Excerpt:** Alphabet’s rare 100-year sterling bond raises fresh concerns about an AI-driven debt surge as hyperscalers ramp up borrowing to fund massive data center expansion.
**Content:**
Alphabet has stepped into rare territory with the issuance of a 100-year sterling bond, igniting a broader debate about whether the AI infrastructure boom is pushing global credit markets toward late-cycle excess.
The Google parent raised £1 billion through the century bond as part of a sweeping $20 billion multi-currency borrowing package spanning U.S. dollars, euros, sterling and Swiss francs. The bond reportedly attracted nearly ten times investor demand and priced at approximately 120 basis points above 10-year UK gilts, locking in yields just over 6 percent.
While the deal reflects strong investor confidence in Alphabet’s long-term durability, strategists warn it may also signal growing froth in credit markets driven by the accelerating AI arms race.
## A Rare Move in Corporate Debt Markets
Century bonds remain uncommon among corporations. They are typically associated with sovereign issuers or highly stable institutions seeking ultra-long-term funding. Alphabet now joins a select group of sterling century bond issuers, including the University of Oxford, the Wellcome Trust, EDF Energy and Mexico’s government.
For pension funds and insurers, the appeal is clear. Long-duration assets help match long-term liabilities. Alphabet’s strong credit profile and global scale made the offering particularly attractive to UK institutional buyers.
However, issuing 100-year debt in a fast-evolving technology sector raises important questions. The AI landscape is shifting rapidly. Competitive dynamics are intensifying. Technological leadership can change in years rather than decades.
## AI Expansion Driving Historic Borrowing
The bond issuance comes as Alphabet accelerates capital expenditure to unprecedented levels. The company expects capex to reach roughly $185 billion this year, largely directed toward AI servers, custom chips and hyperscale data centers supporting Google Cloud and DeepMind initiatives.
Alphabet is not alone. Microsoft, Amazon, Oracle and Meta are also significantly expanding infrastructure spending. Industry forecasts suggest tech sector borrowing could reach trillions of dollars over the next five years as hyperscalers race to secure AI dominance.
This represents a structural shift. Historically, many of these firms relied heavily on internal cash flow. The scale of AI investment is now pushing even cash-rich companies deeper into global debt markets.
## Credit Markets Enter “Untested Waters”
Market analysts caution that 100-year corporate bonds remain largely untested in volatile macroeconomic environments. Locking in yields slightly above 6 percent may appear attractive today, but investors are effectively betting on Alphabet’s resilience across a century of technological disruption, regulatory shifts and geopolitical uncertainty.
Credit spreads remain relatively tight, while major tech stocks trade near record highs. In such conditions, ultra-long bond issuance can sometimes serve as a signal of peak optimism.
At the same time, Alphabet’s move demonstrates strategic funding diversification. By issuing in sterling and Swiss francs alongside dollar tranches, the company reduces pressure on the U.S. bond market and broadens its global investor base.
## The Bigger Question: Can AI Deliver Sustainable Returns?
The core issue is not simply the bond. It is whether the massive wave of AI-driven capital expenditure will generate sustainable returns.
Data center demand is expanding rapidly, yet long-term monetization models for advanced AI applications are still evolving. If AI deployment scales profitably, today’s borrowing may prove visionary. If growth expectations cool or competition intensifies, rising debt levels across the sector could amplify financial risk.
Alphabet’s century bond may ultimately be remembered as either a masterstroke of financial timing or a symbol of exuberance at the height of the AI investment cycle.
For now, it stands as one of the clearest financial markers of how transformative and capital-intensive the AI revolution has become.
---
# FAQs
### Why did Alphabet issue a 100-year bond?
Alphabet issued the century bond to secure long-term funding at current interest rates while diversifying its investor base. The move allows the company to finance massive AI and data center investments without overloading short-term debt markets.
### How rare are 100-year corporate bonds?
They are extremely rare. Most century bonds are issued by governments rather than corporations. In the UK sterling market, only a handful of institutions have issued such long-dated debt before Alphabet.
### What will Alphabet use the funds for?
The proceeds are expected to fund AI infrastructure, including data centers, advanced servers and cloud computing expansion. The company has projected capital expenditure of around $185 billion this year.
### Why are analysts concerned about an AI debt bubble?
Strategists argue that hyperscalers are borrowing at historic levels to fund AI expansion. If AI monetization does not meet expectations, rising debt levels combined with tight credit spreads could increase financial risk across the sector.
### How does this impact investors?
Bond investors are locking in long-term yields, while equity investors must consider whether AI-driven spending will generate sufficient returns. The issuance highlights both confidence in Alphabet’s future and broader uncertainty about the sustainability of the AI investment cycle.
### Are other tech giants also increasing debt?
Yes. Microsoft, Amazon, Oracle and Meta are all scaling up infrastructure investments. Analysts estimate tech sector borrowing could reach trillions of dollars over the next five years as the AI race intensifies.
**Categories:** Business, Finance, Global News
**Tags:** 100-Year Bond, ai, AI Debt Surge, alphabet, google
---
### [AI Disruption Hits Wealth Management: Broker Stocks Plunge After Altruist Hazel AI Tax Tool Launch](https://df.media/ai-disruption-altruist-hazel-ai/)
**Published:** February 11, 2026
**Author:** Vishnu Priya
**Content:**
New York, February 11, 2026—Shares of major U.S. wealth management and brokerage firms tumbled sharply on Tuesday amid mounting fears of AI disruption in the financial advisory sector. The selloff was triggered by fintech startup [Altruist’s launch](https://altruist.com/) of an advanced AI-powered tax planning feature in its Hazel platform, raising concerns that automated tools could erode traditional revenue streams and replace parts of human-led advice.
The announcement sent shockwaves through Wall Street, with investors dumping stocks perceived as vulnerable to AI automation in wealth management, tax strategies, and personalized financial planning.
- LPL Financial (LPLA): Closed down 8.3%, after plunging as much as 11% intraday — one of its worst sessions in recent years.
- Charles Schwab (SCHW): Fell 7.4%, marking a steep drop as fears spread across the brokerage industry.
- Raymond James Financial (RJF): Dropped 8.75–8.8%, posting its worst day since March 2020.
- Morgan Stanley (MS): Declined around 2–2.4%, with other names like Ameriprise Financial and Stifel Financial losing 3–6%.
The rout extended the recent pattern of AI-driven selloffs, following sharp declines in software stocks last week triggered by tools from Anthropic and others. Analysts describe it as part of a broader “sell-first” mentality where any AI innovation sparks immediate sector-wide pressure.
What Sparked the AI Disruption Panic?Altruist, a Los Angeles-based self-clearing brokerage platform founded in 2018 and serving thousands of independent advisors, unveiled the new capability in Hazel — its transformative AI platform.
The feature analyzes client documents such as Form 1040s, pay stubs, account statements, meeting notes, emails, and data from custodial/CRM systems to generate fully personalized tax strategies in minutes.Key highlights from Altruist’s release:
- Eliminates manual data entry and applies deep tax logic for instant insights.
- Includes interactive scenario modeling (e.g., impact of bonuses, home sales, or retirement transitions).
- Available to advisory firms regardless of custody provider; standalone Hazel access priced at $60 per seat per month.
Altruist positions the tool as an enhancer for advisors, allowing them to handle more complex cases efficiently and deliver better outcomes. CEO Jason Wenk emphasized it “flips the dynamic” by making high-quality advice more scalable.
Industry Pushback and Long-Term Outlook Not everyone sees doom for human advisors. Jed Finn, head of wealth management at Morgan Stanley, compared the current panic to past “robo-advisor hysteria,” stressing that the advisor-client relationship remains irreplaceable.
He argued AI will augment rather than supplant professionals, similar to how robo-advisors now manage hundreds of billions but capture only a fraction of the market.
Bloomberg Intelligence analyst Neil Sipes noted the declines stem from “broader concerns about AI disrupting the financial advice and wealth-management model.”
Reuters and CNBC highlighted how AI-first startups are automating tasks once exclusive to expensive human advisers, pressuring legacy firms’ pricing power and margins.Broader Implications for AI in FinanceThis episode underscores the accelerating pace of AI adoption in financial services.
With Big Tech investing hundreds of billions in AI infrastructure, commercial tools like Hazel’s tax planner are emerging rapidly — challenging incumbents in advisory, tax planning, and beyond.
Market watchers are now focused on:
- Upcoming earnings reports from major brokerages for AI commentary.
- Regulatory developments around AI use in financial advice.
- Whether the sell-off proves overdone or signals deeper structural shifts.
While broader indices like the Dow hit fresh records amid resilience in other areas, Tuesday’s action in wealth management stocks highlights how quickly AI threat narratives can drive volatility in vulnerable sectors.
As AI continues to infiltrate high-touch financial services, the launch of tools like Hazel may mark a turning point in the debate over technology’s role in reshaping the wealth management industry. Investors should monitor closely as the “AI disruption” trade evolves across finance in 2026.
[Follow daily finance news ](https://df.media/)covering global markets, crypto, business, and institutional investing.
Stay informed with timely updates, expert analysis, and stories that move capital markets worldwide.
**Categories:** Finance, Global News
**Tags:** Altruist Hazel AI, Altruist Hazel AI Tax Tool
---
### [EUR/USD Steady at $1.19 Ahead of US Jobs and CPI Data](https://df.media/eur-usd-steady-at-1-19-ahead-of-us-jobs-cpi-data/)
**Published:** February 10, 2026
**Author:** Vishnu Priya
**Excerpt:** EUR/USD steady at $1.19 ahead of US jobs and CPI reports. Dollar weakness supports the euro and pound as traders await key FX catalysts.
**Content:**
**Feb 10, 2026 — FX Market Update**
The **EUR/USD is steady at $1.19 ahead of US** economic reports, as the dollar softens against major currencies. Meanwhile, the pound also maintains early-week gains. Traders are cautiously positioning themselves ahead of key U.S. data that could trigger volatility in foreign exchange markets.
---
#### **Euro Stability Driven by Dollar Weakness**
The euro held in the **$1.19–$1.1910** range after Monday’s 0.9% jump. Analysts note that the **EUR/USD steady at $1.19 ahead of US** jobs and CPI reports reflects a dollar retreat rather than strong euro momentum.
At the same time, **GBP/USD** remains near $1.3670 despite ongoing political uncertainty in the UK, showing that traders are prioritizing macroeconomic data over political developments.
---
#### **Focus on Delayed U.S. Jobs Report**
All eyes are on Wednesday’s **delayed U.S. Bureau of Labor Statistics jobs report**, postponed due to the partial government shutdown. Last week’s ADP data revealed only **22,000 private jobs** added in January, well below expectations.
The official jobs report is projected at **55,000 new positions**, a modest number that could still move FX markets if it surprises. Analysts warn that the **EUR/USD steady at $1.19 ahead of US** data could quickly shift depending on the outcome.
---
#### **CPI Report Could Drive Dollar Direction**
Friday’s **U.S. Consumer Price Index (CPI)** release is another major market driver. Inflation data helps traders anticipate the Federal Reserve’s next steps:
- **Weaker inflation or low job growth** could keep the dollar under pressure, supporting the **EUR/USD steady at $1.19 ahead of US** macro releases.
- **Stronger figures** could strengthen the dollar and push EUR/USD downward.
---
#### **Market Outlook**
For now, both bulls and bears are exercising caution. The **EUR/USD steady at $1.19 ahead of US** economic reports reflects a market waiting on data-driven catalysts rather than taking directional bets. Traders are advised to monitor both the jobs report and CPI closely, as these releases are likely to dictate short-term currency movements.
**Categories:** Banking
---
### [Asia Stocks Rally as Nikkei 225 Hits Record High on Japan Election and Chip Rebound](https://df.media/asia-stocks-rally-nikkei-225-record-high-japan/)
**Published:** February 9, 2026
**Author:** Vishnu Priya
**Content:**
**By Daily Finance \| February 9, 2026**
**Asia Stocks Rally Amid Global Tech and AI Chip Recovery**
Asian stock markets surged sharply on Monday as Japan’s Nikkei 225 rocketed more than 4.1 percent to an all-time high following Prime Minister Sanae Takaichi’s decisive election victory. Investors interpreted the result as a green light for aggressive fiscal stimulus, infrastructure spending, and reforms in high-growth sectors, including artificial intelligence, semiconductors, and energy security.
The market momentum was further supported by a rebound in U.S. chip stocks. Nvidia jumped nearly eight percent, AMD rose over eight percent, and Broadcom advanced seven percent, easing concerns over the massive capital expenditure planned by U.S. tech giants this year, estimated at more than six hundred fifty billion dollars. Bargain hunting in previously beaten-down momentum plays, including silver, also boosted investor sentiment.
## Japan Election Fuels Pro-Growth Optimism
Takaichi’s stable majority has cleared the path for tax cuts and debt-driven fiscal stimulus, positioning Japan as a reform and momentum story after years of contrarian investor sentiment. Marc Jocum, senior investment strategist at Global X ETFs Australia, said that investors now see political stability, improved capital returns, domestic deployment, and reasonable valuations aligning to support Japanese equities.
The MSCI Asia-Pacific ex-Japan index gained two percent, South Korea’s KOSPI climbed nearly four percent, and China’s CSI 300 rose ahead of inflation data expected to show easing food prices and continued deflation in producer prices. Traders highlighted that the breadth of the rally reflected a broad-based shift back into equities after weeks of volatility linked to AI valuations, bond yields, and geopolitical concerns.
## U.S. Tech Rebound Lifts Global Sentiment
The recovery of major U.S. technology and AI-linked stocks set the stage for the Asia-led rally. Friday’s session saw S&P 500 and Nasdaq recover over two percent, following several days of sharp losses. Analysts emphasized that investor rotations are occurring, moving from AI spenders to companies positioned as beneficiaries of AI investment, including hardware manufacturers and select industrials. Some observers noted a broader shift from a U.S.-centric rally to geographically diversified positioning as investors sought value in Japan and other emerging Asia markets.
Expectations for a Federal Reserve rate cut by June remain a focal point. Futures markets now suggest that an initial move is increasingly likely. Upcoming U.S. data on payrolls, retail sales, and consumer price inflation will be critical in confirming the case for stimulus. Economists forecast moderate payroll growth of seventy thousand jobs, a slight cooling of inflation, and steady retail sales, which could support gradual rate cuts without triggering economic distress.
## Japanese Bonds and Currency Movements
Japanese bond markets reacted to the anticipation of larger fiscal packages. Two-year government bond yields reached their highest levels since the mid-1990s, reflecting expectations of heavier issuance and gradual normalization of domestic monetary policy.
In currency markets, the yen remained under pressure following the prolonged sell-off in response to anticipated debt-funded stimulus. The U.S. dollar slipped slightly against the yen to 156.74, while traders noted that intervention could occur if the yen approaches the 160 level. The euro held steady at 1.1821, and sterling lingered at 1.3596 amid ongoing political uncertainty in the United Kingdom.
## Commodities Show Mixed Moves
Commodities reacted unevenly to the rally. Silver rose over four percent to eighty-one dollars and forty-three cents following recent margin call-induced volatility. Gold advanced by 1.1 percent to five thousand seventeen dollars per ounce. By contrast, oil prices edged lower as talks between Washington and Tehran failed to reduce geopolitical tensions, with Brent crude at sixty-seven dollars and thirty-six cents and U.S. WTI at sixty-two dollars and ninety-four cents per barrel.
## European Markets Poised to Extend Gains
European futures suggested a continuation of the positive momentum. EUROSTOXX 50 and Germany’s DAX futures rose 0.3 percent each, while the FTSE futures advanced 0.4 percent. Analysts noted that the rally’s sustainability would depend on upcoming economic data and central bank signals. Lingering AI investment concerns, yen intervention risks, and geopolitical tensions could cap upside potential despite optimism around fiscal and monetary clarity.
## What Investors Should Watch
Strategists emphasize that markets will closely monitor whether incoming data and central bank communication validate expectations of a soft landing. If growth remains moderate and inflation continues to ease, cyclical and value sectors, as well as selected AI and semiconductor leaders, may benefit. However, a spike in bond yields, renewed geopolitical tensions, or disappointing AI returns could reintroduce volatility into global markets.
| Key Market Moves | Change | Level |
|---|---|---|
| [Nikkei 225](https://www.livemint.com/market/stock-market-news/global-markets-today-japans-nikkei-surges-5-to-hit-record-high-on-pm-takaichis-victory-11770602756860.html) | +4.1% | Record High |
| KOSPI | +3.8% | – |
| CSI 300 | +1.3% | – |
| Silver | +4.4% | 81.43 |
| Gold | +1.1% | 5,017 |
| USD/JPY | -0.3% | 156.74 |
## FAQs
**Q: Why did Asia stocks rally on February 9, 2026?**
A: Markets surged after Prime Minister Takaichi’s election win and a rebound in U.S. chip stocks, coupled with expectations for a Fed rate cut by June.
**Q: What is the significance of the Nikkei 225 record high?**
A: It reflects investor confidence in Japan’s fiscal stimulus plans, AI and semiconductor sector reforms, and broader pro-growth momentum.
**Q: How will U.S. Fed policy affect global markets?**
A: A rate cut would lower borrowing costs, boost equities, and encourage risk-taking, underpinning Asia and U.S. markets.
**Q: How did commodities react?**
A: Silver rose 4.4 percent, gold increased 1.1 percent, while oil prices dipped amid ongoing U.S.-Iran talks.
**Q: What should investors focus on next?**
A: Key metrics include U.S. payrolls, inflation, retail sales, yen intervention risks, and AI investment returns.
Stay ahead of global market movements with DF Media. Subscribe for **real-time updates** on Asia stocks, Nikkei trends, Fed policy, AI and chip stocks, commodities, and currency markets. Make informed investment decisions with timely insights and expert analysis.
**👉 Subscribe Now to [Daily Finance](https://df.media/) for Daily Market Alerts**
**Categories:** Banking
---
### [Stock Market Today: Dow, S&P 500, Nasdaq Waver Ahead of Google Earnings](https://df.media/dow-sp-nasdaq-slip-on-ai-google-earnings-stocks-today/)
**Published:** February 4, 2026
**Author:** Vishnu Priya
**Excerpt:** US stock futures wobble as tech earnings & AI disruption pressure markets. Dow, S&P 500, & Nasdaq futures track volatility ahead of Alphabet results.
**Content:**
**February 4, 2026**
**Dow, S&P 500, and Nasdaq futures wobble ahead of Alphabet earnings as AI-driven disruption rattles tech and software stocks**
US stock futures traded cautiously on Wednesday as Wall Street sought stability following a tech-led selloff, with investors bracing for Alphabet’s earnings report. Futures tied to the Dow Jones Industrial Average rose modestly by 0.2%, while S&P 500 contracts gained 0.1%, and Nasdaq 100 futures fell 0.3% as technology stocks remained under pressure.
The volatility comes amid renewed concerns over AI-driven disruption. A selloff in software shares on Tuesday, sparked by a new automation tool from Anthropic PBC, highlighted the fragility of tech valuations and spilled into broader markets, including financial services and asset managers. European stocks exposed to AI risk fell another 1.2%, while cyclical and economically sensitive sectors, such as chemicals and autos, saw gains.
“I don’t think the market has fully resolved whether this move was based on fear or fundamentals. What’s clear is a confidence break at the category level,” said Stephanie Niven, portfolio manager at Ninety One. “Before convictions can be rebuilt at the company level, we are seeing indiscriminate selling.”
### Tech Earnings Pressure Nasdaq
Tech giants face scrutiny as investors question whether AI investments are translating into meaningful returns. Nvidia and Advanced Micro Devices were hit hard, with AMD’s shares tumbling 9% after a cautious sales forecast. Microsoft and Meta had mixed responses last week, reflecting divergent views on AI spending efficiency.
Alphabet’s earnings report is now a focal point. Investors want evidence that Google’s AI-driven projects will boost search and cloud monetization without ballooning costs. Analysts warn that even strong earnings will not reassure markets unless they demonstrate clear AI profitability.
### Dow and S&P Show Relative Stability
While the Nasdaq remains fragile, the Dow and S&P 500 have found relative stability. Rotation into value-oriented and defensive sectors has supported broader indices. Pharma stocks showed mixed results: Eli Lilly surged on strong demand for its weight-loss drug, while Novo Nordisk shocked investors with a steep sales decline forecast.
Other corporate developments added to the market story. Texas Instruments agreed to acquire Silicon Laboratories for $7.5 billion, while Uber offered a weak profit outlook alongside investments in autonomous vehicles. UBS posted better-than-expected quarterly profits and announced a $3 billion buyback program.
### Gold Surpasses $5,000 as Safe-Haven Demand Surges
Precious metals rebounded sharply as investors sought safety.[ Gold futures](https://www.bloomberg.com/news/articles/2026-02-03/stock-market-today-dow-s-p-live-updates?srnd=phx-markets) rose above $5,000 an ounce, fueled by equity market volatility and geopolitical uncertainty. West Texas Intermediate crude climbed 0.3% to $63.39 per barrel, and the Bloomberg Dollar Spot Index edged up 0.1%.
### Crypto and Bonds
Bitcoin hovered near $76,000, while Ether fell 2.5% amid broader tech sector turbulence. Treasury yields remained steady, with the 10-year US Treasury at 4.27%, reflecting caution among bond investors as employment and economic data await the ADP payroll report.
### Strategic Takeaways
Market analysts emphasize that AI disruption is creating both risk and opportunity. Legal-tech firms experienced sharp losses after Anthropic launched a new automation tool, but broader AI supply chains saw gains. Investors are increasingly selective, focusing on companies that can demonstrate measurable returns from innovation.
“The biggest risk for tonight’s Alphabet earnings is the decoupling between Google’s long-term AI leadership and short-term monetization trends,” said Jacques-Aurélien Marcireau, co-head of equities at Edmond de Rothschild Asset Management. “Markets will judge whether AI investment translates into tangible results.”
### What’s Next
Investors will closely monitor Alphabet’s earnings and guidance. The broader tech sector remains sensitive to AI developments and automation trends, while rotation into cyclical and value sectors may continue. With earnings season underway, market participants are seeking clarity, discipline, and execution rather than long-term narratives alone.
Stay ahead of global markets, [gold prices](https://timesofindia.indiatimes.com/business/india-business/gold-silver-prices-continue-to-crash-mcx-silver-mcx-gold-drop-what-investors-should-know/articleshow/127857222.cms), central bank policy, and breaking finance news,[Daily Finance](https://df.media/).
**Categories:** Banking
---
### [India–U.S. Trade Deal 2026: 18% Tariff Cut, Goods, Business Impact, and What It Means for Global Trade](https://df.media/india-us-trade-deal-2026-7-big-wins-18-tariff-cut/)
**Published:** February 3, 2026
**Author:** Vishnu Priya
**Excerpt:** India US trade deal 2026 cuts tariffs to 18%. See how it impacts goods, businesses, exports, and global trade in this major reset.
**Content:**
India US Trade Deal 2026: 7 Big Wins, 18% Tariff Cut & What’s Next # India US Trade Deal 2026: 7 Big Wins, 18% Tariff Cut & What’s Next
How the landmark tariff reduction reshapes goods, business, and global trade dynamics
📅 February 3, 2026
⏱️ 6 min read
US
The India US trade deal 2026 marks a major reset in bilateral relations, cutting U.S. tariffs on Indian goods to 18% and reshaping global trade, business, and export dynamics. This breakthrough agreement announced by President Donald Trump and Prime Minister Narendra Modi delivers immediate relief to exporters while raising critical questions about energy security, strategic autonomy, and the future of India-U.S. economic relations.
50%Previous Tariff Rate
18%New Tariff Rate
64%Reduction
$500B+Investment Pledge
1## What Is the India US Trade Deal 2026?
The India US trade deal 2026 refers to the bilateral agreement between India and the United States that reduces U.S. tariffs on Indian goods from an effective 50% to 18%. This landmark deal follows months of tense negotiations triggered by punitive U.S. tariffs imposed over India’s purchases of Russian oil.
President Trump announced the agreement via social media after a phone call with Prime Minister Modi, stating that India had committed to ending Russian oil imports, reducing trade barriers to zero, and purchasing over $500 billion worth of U.S. goods including energy, technology, and agricultural products.
However, no formal Free Trade Agreement text has been released, making this announcement a policy-driven confidence signal rather than a fully ratified treaty. The absence of official documentation raises questions about implementation timelines and long-term stability of the tariff reduction.
2## How the 18% US Tariff Cut Impacts Indian Goods
The 18% tariff applies broadly to Made in India goods exported to the United States. This includes a diverse range of products that form the backbone of India’s export economy.
### Key Goods Categories Affected
Apparel & Textiles Gems & Jewellery Engineering Goods Electronics Pharmaceuticals Auto Parts Industrial Machinery IT Services
These sectors were among the hardest hit when cumulative tariffs reached 50% in August 2025. The rollback immediately restores price competitiveness for Indian exporters operating in the U.S. market, allowing them to compete more effectively against Asian rivals.
**Understanding goods in trade context:** Goods refer to physical, tangible products that cross international borders. Unlike services (which are intangible activities like consulting or software development), goods include everything from clothing to computer chips. Tariffs are taxes imposed on these physical products when they enter a country, making them more expensive for buyers and less competitive for sellers.
3## India US Trade Deal 2026: Impact on Business and Exports
The tariff reduction creates immediate and substantial benefits for Indian businesses engaged in international trade, while also generating positive ripple effects across the broader economy.
### Direct Business Benefits
**Exporters gain breathing room:** Indian businesses exporting to the U.S. now face lower landed costs, improved profit margins, and renewed contract visibility. This is particularly critical for small and mid-sized exporters who were struggling to absorb the previous 50% tariff shock without passing costs to customers.
**Manufacturing confidence improves:** The deal reinforces India’s position as a viable manufacturing alternative within global supply chains, strengthening business cases under the “China plus one” strategy that multinational corporations have been pursuing to reduce dependency on Chinese manufacturing.
**IT and services see indirect gains:** Although tariffs primarily affect goods, service-led firms such as IT companies benefit from improved bilateral sentiment, stronger enterprise spending in the U.S., and reduced geopolitical policy risk that had been dampening business confidence.
### Market Response Validates Confidence
Financial markets rarely wait for paperwork—they price future direction. U.S.-listed Indian companies surged immediately after the announcement, with Infosys closing 4.3% higher, Wipro jumping 6.8%, HDFC Bank gaining 4.4%, and the iShares MSCI India exchange-traded fund rising 3%.
This investor response reflects confidence that trade friction risk has declined materially, earnings visibility has improved for India-exposed firms, and capital flows may stabilize after months of uncertainty and record foreign investor outflows in 2025.
**Understanding business in trade:** Business refers to companies, investment decisions, contracts, and operations that respond to trade policy changes. Businesses make strategic decisions about where to manufacture, which markets to enter, and how to price products—all based on factors like tariffs. A tariff reduction can transform a money-losing export market into a profitable one overnight.
4## Trade vs Business vs Goods: Key Distinctions
To fully grasp the significance of the India US trade deal, it’s essential to understand how these three interconnected concepts differ:
| Concept | Definition | Example in This Deal |
|---|---|---|
| **Goods** | Physical products crossing borders | Textiles, electronics, machinery exported from India to U.S. |
| **Business** | Companies and operations responding to policy | Infosys stock rises, exporters adjust pricing strategies |
| **Trade** | Umbrella framework including goods, services, capital, regulations | Overall India-U.S. economic relationship worth $131B annually |
This deal directly impacts **goods** through tariff changes, indirectly reshapes **business** decisions around investment and expansion, and strategically repositions the entire **trade** relationship between the world’s largest democracy and largest economy.
5## Russian Oil and Energy Trade: The Silent Realignment
One of the most geopolitically sensitive aspects of the India US trade deal 2026 involves energy procurement and India’s relationship with Russia.
President Trump stated that India agreed to stop buying Russian oil and increase purchases from the United States and potentially Venezuela. Indian officials have not formally confirmed this commitment, maintaining their long-standing position that oil imports are purely commercial decisions driven by market factors and energy security needs.
### Actions Speak Louder Than Words
However, trade data reveals a quiet but deliberate transition already underway. Russian crude imports to India have fallen sharply, with a 29% month-on-month reduction recorded in recent months—the lowest volumes since international price cap policies were implemented on Russian oil.
### Key Energy Transition Data
📉 **38% reduction** in Russian oil orders by Indian refiners compared to previous year
🛢️ **Zero Russian oil** received by Reliance Industries in January 2026
📊 **29% month-on-month drop** in overall Russian crude imports
This suggests India is achieving alignment with U.S. geopolitical priorities through action rather than formal declaration, allowing New Delhi to balance energy security concerns with diplomatic flexibility and avoid appearing to capitulate to external pressure on sovereign decisions.
6## Regional Trade Competitiveness: Where India Stands
The new 18% tariff rate significantly improves India’s competitive position in the U.S. market relative to regional rivals, though gaps remain.
### Tariff Comparison Across Asian Exporters
| Country | U.S. Tariff Rate | GSP Benefits |
|---|---|---|
| India | 18% | No (withdrawn 2019) |
| Vietnam | 20% | Yes (~5% additional advantage) |
| Bangladesh | 20% | Yes (~5% additional advantage) |
| Pakistan | 19% | Yes (~5% additional advantage) |
| China | 34% (delayed to Nov 2026) | No |
While the 18% rate brings India closer to parity with neighbors, the absence of Generalized System of Preferences (GSP) benefits still gives competitors approximately a 5% effective advantage. Indian exporters had hoped for a reciprocal tariff rate around 15% to fully level the playing field.
Nevertheless, this represents a dramatic improvement from the 50% disadvantage India faced just months ago, and positions Indian manufacturers competitively for the first time since August 2025.
7## Why the India US Trade Agreement Matters for Global Trade
The India US trade deal 2026 sends powerful signals that extend far beyond bilateral economics, reshaping the architecture of global trade in a fragmenting world order.
### Strategic Implications
**Trade becomes strategic, not just economic:** This deal demonstrates that in 2026, tariff policy serves multiple purposes beyond revenue collection. Tariffs are now diplomatic tools, geopolitical leverage points, and strategic alignment mechanisms.
**Supply chain realignment accelerates:** For the United States, this agreement reinforces supply chain diversification away from China by strengthening trade with a trusted democratic partner. For India, it secures long-term strategic relevance in future global supply chains.
**Emerging markets that integrate geopolitics with trade gain leverage:** Countries that can demonstrate geopolitical alignment while maintaining economic competitiveness position themselves favorably in an era where commerce and diplomacy are increasingly inseparable.
### The Broader Trade Context
**Trade** encompasses the entire framework of economic exchange between nations—not just goods crossing borders, but also services, intellectual property, investment flows, regulatory standards, and diplomatic relationships. The India US trade deal operates at this comprehensive level, affecting everything from individual product prices to geopolitical alliances.
For Asia, this deal reshapes competitive dynamics and forces other nations to reassess their own trade strategies. For global investors, it reinforces India’s growing importance in diversified portfolios. For policymakers worldwide, it highlights that trade stability now requires as much diplomatic skill as economic negotiation.
8## Critical Timeline: From Crisis to Breakthrough
1
August 2025
United States imposes 25% reciprocal tariff plus additional 25% penalty on countries purchasing Russian oil, creating an effective 50% tariff burden on Indian goods—the highest imposed on any country alongside Brazil.
2
September-October 2025
Indian exports suffer significant declines. Major refiners begin quietly reducing Russian oil orders, with October showing 38% decrease compared to previous year. Bilateral negotiations intensify behind the scenes.
3
December 2025
Russian crude imports to India record 29% month-on-month reduction to lowest levels since price cap implementation. Strategic shift becomes evident in data despite absence of public policy announcements.
4
January 2026
Reliance Industries, one of India’s largest refiners, publicly announces zero Russian oil receipts for January and confirms no Russian oil received in final three weeks of December. Energy transition accelerates.
5
February 3, 2026
Trump and Modi announce breakthrough agreement during phone call. U.S. tariffs reduced to 18%, removing penalty layer. Markets surge on reduced friction expectations. Full FTA negotiations expected to conclude during 2026.
9## Unanswered Questions and Future Outlook
Despite the positive momentum, several critical questions remain unresolved that will determine the long-term success and stability of this agreement.
### Legal Framework Uncertainty
No Federal Register notice or presidential proclamation has been issued formalizing the tariff changes. The effective implementation date remains unclear, and without official documentation, the durability and reversibility of these tariff reductions cannot be fully assessed.
### Free Trade Agreement Status
It remains ambiguous whether this represents a standalone political settlement or forms part of the broader India-U.S. Free Trade Agreement that has been under negotiation since early 2025. Unlike the recently concluded EU-India FTA, no negotiated text has been made public.
### Investment Commitment Verification
Trump’s claim that India committed to purchasing over $500 billion worth of U.S. goods has not been validated by Indian officials. Given current bilateral trade stands at approximately $131 billion annually, this figure would require multi-year, multi-sector execution—but no timeline or sector breakdown has been provided.
### Non-Tariff Barriers
Trump stated India would reduce tariffs and non-tariff barriers “to zero,” but Indian officials have neither confirmed nor detailed which specific barriers would be eliminated. Critical questions remain about agricultural market access, particularly for soybeans and dairy products where India maintains protective restrictions.
### Strategic Autonomy Concerns
The withdrawal of U.S. sanctions waivers on Iran’s Chabahar port project and India’s apparent reduction in Iranian trade exposure raises questions about strategic autonomy. The Union Budget 2026 showed zero allocation for Chabahar, suggesting India is preparing to step back from the 23-year infrastructure project—at least temporarily—to avoid additional U.S. tariff threats.
10## Final Strategic Takeaway
The India US trade deal 2026 represents a high-impact confidence signal for exporters, businesses, and financial markets. The 18% tariff cut delivers immediate economic relief and demonstrates that diplomacy between the world’s largest democracy and largest economy can produce concrete results even amid complex geopolitical tensions.
However, this agreement is more accurately understood as a tactical confidence-building measure rather than a comprehensive trade architecture. It opens momentum but does not close the chapter on India-U.S. trade relations.
The real test lies in execution: Will tariffs drop further toward the 15% level Indian exporters hoped for? Will non-tariff barriers genuinely fall to zero as claimed? Will energy commitments fundamentally reshape India’s strategic posture and relationships with Russia and Iran? Can the broader Free Trade Agreement be finalized with terms that satisfy both domestic constituencies and international competitiveness requirements?
**For businesses:** This creates a more favorable environment for U.S. market expansion but requires monitoring of implementation details and FTA negotiations.
**For investors:** The deal reduces policy uncertainty and improves India’s attractiveness within emerging market portfolios, though execution risk remains.
**For policymakers:** Success requires balancing immediate economic gains with long-term strategic autonomy, ensuring India’s energy security isn’t compromised and sovereign decision-making capacity is preserved.
### Understanding Evolves, Trade Continues
This is a strong opening move in recalibrating India-U.S. trade relations for a multipolar world. The journey from 50% tariffs to 18% represents meaningful progress, but the path to comprehensive trade partnership requires sustained diplomatic effort, mutual economic benefit, and strategic trust.
### Stay Updated on Global Trade & Finance
Get the latest insights on international trade deals, market movements, and economic policy analysis.
[ Follow Daily Finance → ](https://df.media/)
An error has occurred, which probably means the feed is down. Try again later.
**Categories:** Business, Finance, Global News
**Tags:** Business Impact, Goods, India–U.S. Trade Deal 2026: 18% Tariff Cut
---
### [Gold and Silver Price Crash: MCX Gold and Silver Drop 41 Percent as IMF Cuts Global Inflation Forecast to 3.8 Percent](https://df.media/gold-and-silver-price-crash-imf-inflation-falls-to-3-8/)
**Published:** February 2, 2026
**Author:** Laura Anderson
**Excerpt:** Gold and silver prices crash as MCX gold drops 41% after IMF cuts global inflation forecast to 3.8%. Market shock, margin calls, 2026 outlook.
**Content:**
Published Monday, February 2, 2026, 2:13 PM IST
**Gold Price Crash and Silver Price Collapse Trigger Margin Calls as IMF Chief Declares Inflation Crisis Over**
The precious metals market has experienced an absolute bloodbath on February 2, 2026, with MCX silver plummeting Rs 1.66 lakh per kilogram, representing a devastating 41.5 percent decline over just three consecutive trading sessions. At the exact same moment, International Monetary Fund Managing Director Kristalina Georgieva delivered bombshell news that global inflation will collapse to 3.8 percent in 2026 and continue falling to 3.4 percent in 2027. This extraordinary convergence of catastrophic precious metals losses paired with historic inflation decline has shattered the entire investment thesis for gold and silver that institutional investors have relied upon for decades.
The scale of this market event cannot be overstated. Spot gold has crashed from an all time high of $5,594.82 per ounce down to $4,703.27 per ounce, erasing $891.55 in value per ounce in just days. Spot silver tells an even more brutal story, having plummeted from $121.64 per ounce to just $85.98 per ounce, representing a staggering 29 percent evaporation of value. For Indian investors holding MCX gold and MCX silver positions, the pain has been equally severe as the rupee denominated prices have mirror these global declines with precise accuracy.
Understanding what triggered this perfect storm requires digging into three simultaneous catalysts that converged to create absolute devastation across the precious metals complex. First, the CME Group announced increased margin requirements for Comex gold and silver futures starting February 2, 2026, forcing leveraged traders to either deposit massive additional capital or liquidate positions immediately. Second, the IMF chief’s announcement that global inflation is finally falling removes the primary investment rationale that has driven gold and silver demand for years. Third, a strengthening U.S. dollar has made precious metals more expensive for international buyers, reducing demand across every major market globally.
Let me break down exactly what happened and what it means for your investment portfolio moving forward.
**Understanding the Gold and Silver Price Collapse**
When I first analyzed the data rolling in from futures markets this morning, I immediately recognized we were witnessing a historic margin call cascade. The preceding month had seen aggressive profit taking chase a massive rally that pushed both gold and silver to all time peaks. Traders everywhere had become euphoric, convinced that the gold and silver bull market would continue indefinitely. They loaded up on leveraged positions, borrowing heavily to maximize their exposure to these surging precious metals.
That bullish sentiment completely evaporated when reality hit markets this week.
The collapse has been relentless and unforgiving. Silver has been hit particularly hard, declining by Rs 1.66 lakh per kilogram over three consecutive trading days. To put this in perspective, this represents the kind of violent drawdown that typically only occurs when leveraged longs get absolutely demolished. Short covering cannot drive gold and silver prices down this aggressively. Only forced liquidations from margin calls can create this kind of panic selling.
Spot gold has experienced equally severe damage, slipping 3.3 percent to $4,703.27 per ounce as of early morning trading. But the real story is what happened earlier in the session when gold crashed more than 5 percent to its weakest level in over two weeks. That’s the kind of intraday violence that screams margin call liquidations happening across multiple time zones simultaneously.
The brutal reality for precious metals investors is that this represents the third consecutive day of losses. One bad day could be dismissed as noise. Two days might indicate a technical correction. But three days of relentless selling without any meaningful bounce? That signals something much more serious is happening in the markets.
**Why Gold and Silver Prices Are Crashing Right Now**
As someone who has covered financial markets professionally for many years, I have learned that precious metals crashes never happen in isolation. There are always multiple causative factors working together to create perfect storm conditions. This February 2026 situation represents a textbook example of multiple structural forces aligning to create maximum damage to precious metals investors.
The first and most immediate catalyst came from the CME Group. These folks don’t raise margin requirements casually. When CME increased margin requirements for Comex gold and silver futures, they sent a powerful signal that volatility had reached levels they deemed unsustainable. Higher margins directly translate to higher costs for maintaining leveraged positions.
Think about how this works practically. A trader who previously controlled a massive gold futures position by depositing $50,000 in margin suddenly discovered they now need to deposit $75,000 instead to maintain that same position size. The trader faces a choice that is frankly unpleasant either way. They can scrape together the additional $25,000 and keep the position, or they can liquidate the position to free up capital. Most choose liquidation, which floods markets with sell orders.
Those sell orders hit markets at precisely the moment when confidence in precious metals was already cratering due to the IMF’s earth shattering announcement about inflation. Managing Director Kristalina Georgieva stood up in front of the financial world and declared that global inflation will fall to 3.8 percent this year and further decline to 3.4 percent in 2027. This announcement formally declares the inflation crisis is over.
Now, understand why this matters so profoundly for gold and silver. For the past five years, the primary investment case for holding precious metals centered on inflation protection. Central banks worldwide had aggressively raised interest rates to combat soaring inflation. That monetary tightening had driven gold and silver to record highs as investors rushed to protect themselves from currency debasement and purchasing power erosion.
But when the IMF chief announced that inflation is finally collapsing, the primary rationale for holding gold and silver simply evaporated overnight. If inflation is falling, why hold a non yielding commodity like gold when interest bearing bonds now offer attractive returns? This represents a fundamental shift in the investment calculus for institutional money managers.
The IMF chief specifically emphasized that softer global demand combined with lower energy prices are driving the inflation collapse. She also noted that despite profound shifts in geopolitics and trade policy, global growth has held up remarkably well. This suggests the world economy is not in recession, which further undermines the safe haven case for precious metals.
Adding fuel to the fire, the U.S. dollar has strengthened dramatically during this same period. A stronger dollar makes gold and silver more expensive for international buyers. When the dollar strengthens, precious metals typically weaken because the cost of purchasing gold and silver in other currencies rises substantially. This exchange rate effect acts like an additional magnifying force accelerating gold and silver price declines.
For Indian investors specifically, this creates a double negative. Not only are global gold prices falling, but the rupee is also weakening against the dollar, adding additional downward pressure on rupee denominated MCX gold and MCX silver prices.
**The Margin Call Cascade Explained**
I want to spend a moment explaining margin calls in detail because this is the mechanism that transforms a normal correction into a bloodbath like we are witnessing today. Many retail investors don’t fully understand how margin calls work in futures markets, and understanding this is critical to grasping what is happening to precious metals prices right now.
In the futures market, you do not need to deposit 100 percent of the contract value to control a position. Instead, you deposit a margin, which typically represents 10 to 20 percent of the contract notional value. This leverage allows traders to control massive positions with relatively modest capital. A trader might deposit $10,000 and control $100,000 worth of gold futures exposure.
As long as the position moves in the trader’s favor or stays relatively flat, everything is fine. The margin amount sits in the account as collateral. But when prices move against the position, daily mark to market losses reduce the margin amount. The exchange establishes a minimum margin level that must be maintained. When your account falls below that minimum, you receive a margin call.
The CME’s increase in margin requirements means that the buffer zone between current margin levels and the minimum requirement suddenly shrinks. What was previously a comfortable cushion becomes a dangerous tightrope. Any further price decline against the position triggers immediate margin calls.
When a margin call hits, the consequences are swift and brutal. The trader must immediately deposit additional funds to restore the margin level above the minimum requirement. If the trader cannot deposit funds quickly enough, the exchange begins automatically liquidating the position to free up capital. These automatic liquidations happen instantly and without consideration for market conditions.
Here is where the cascade effect kicks in. When one trader’s position gets liquidated, their forced selling drives prices lower. Lower prices trigger margin calls for other traders holding similar positions. Those traders then become forced sellers themselves. Their selling drives prices even lower, triggering additional margin calls in a vicious negative feedback loop.
This is precisely what we are witnessing in precious metals markets right now. The CME’s margin increase triggered initial forced liquidations. Those liquidations drove prices lower. Lower prices triggered additional margin calls for other traders. Those additional forced sales drove prices even lower, triggering yet more margin calls. The cascade continues relentlessly until forced selling is complete and prices find capitulation levels.
**Current Trading Levels and Where Support Exists**
For active traders and investors evaluating where gold and silver prices might stabilize, understanding current technical levels is absolutely critical. I have compiled the most recent trading data and technical support and resistance zones based on input from professional commodity traders.
For spot gold, the current price sits at $4,703.27 per troy ounce as of the latest morning trading. But the real story is that gold touched its all time peak of $5,594.82 per ounce just days ago. That means investors have experienced an $891.55 per ounce loss in an incredibly short time frame.
In terms of support levels, traders are watching several key zones closely. The immediate support sits between $4,680 and $4,620 per troy ounce. If gold breaks below this zone, the next significant support comes in at $4,440 per troy ounce on a weekly closing basis. Below that, there is meaningful support further down, but we want to avoid even discussing that scenario given how depressing it would be for gold holders.
On the resistance side, gold faces meaningful overhead resistance between $4,800 and $4,910 per troy ounce. This represents a natural level where sellers are likely to emerge if gold attempts any kind of rally. The secondary resistance comes in around $5,000 per troy ounce. The previous all time high of $5,594.82 now seems impossibly distant given the severity of the current decline.
For spot silver, the situation is considerably more dire. Silver crashed from $121.64 per ounce down to just $85.98 per ounce, representing a loss of $35.66 per ounce. While silver did bounce slightly and now sits up 1.6 percent on the day, do not mistake this for any kind of meaningful reversal. Silver remains catastrophically far below its recent peak.
Silver’s support levels are positioned at $67 to $74 per troy ounce for immediate support. Traders believe silver could find a floor near $65 per troy ounce, though this remains untested. The secondary resistance level sits around $100 per troy ounce. The previous lifetime peak of $121.64 now seems like a fantasy peak given how brutally silver has been sold.
For Indian investors watching MCX gold, the support zone sits between Rs 1,44,400 and Rs 1,37,700 per kilogram. Resistance is positioned between Rs 1,48,800 and Rs 1,54,000. MCX silver shows support between Rs 2,55,500 and Rs 2,44,000, with resistance coming in between Rs 2,78,000 and Rs 2,92,000.
What this technical analysis tells us is that both gold and silver have experienced violent technical breakdowns. Key support levels that held for many months have been decisively broken. This suggests that the selling pressure remains severe and capitulation may not yet be complete.
**What the IMF Inflation Forecast Really Means**
Let me explain precisely why the IMF chief’s announcement matters so enormously for precious metals investors. This is the critical linchpin that has shifted the entire investment narrative for gold and silver.
Managing Director Kristalina Georgieva made several key points in her speech delivered at the Annual Arab Fiscal Forum in Dubai on February 2, 2026. First and most importantly, she announced that global inflation will fall to 3.8 percent in 2026. This represents an enormous drop from the significantly higher inflation rates that have persisted for the past several years.
But the announcement contained even better news for those concerned about inflation. Georgieva stated that inflation will decline further to 3.4 percent in 2027. This suggests that the global inflation crisis is not just moderating, but actually rolling over. The central banks won. Their aggressive interest rate hiking campaign succeeded in bringing inflation down without completely derailing economic growth.
Georgieva attributed this inflation collapse to two primary factors. First, global demand has softened meaningfully. The aggressive interest rate hikes by central banks worldwide have cooled economic activity. Consumer spending has moderated. Business investment has become more cautious. This softer demand environment has reduced pricing power, bringing down inflation.
Second, energy prices have fallen significantly. Earlier in the cycle, elevated energy prices were a major driver of inflation. Today’s lower oil and gas prices represent a powerful deflationary force. As energy costs decline, the inflation impact moderates substantially.
Most importantly, Georgieva emphasized that despite these profound shifts in geopolitics, trade policy, technology, and demographics, global growth has held up remarkably well. This is extraordinarily positive news. It means the world economy can enjoy the benefits of falling inflation without suffering a severe recession. Growth remains resilient even as inflation falls.
However, Georgieva also sounded important warnings. She noted that trade fragmentation is increasing, with unilateral trade agreements becoming more common. She called for more trade integration because the world of trade fragmentation makes maintaining economic growth more difficult. She noted that trade has not collapsed the way many feared at the beginning of the year, but growth in trade remains slower than global growth itself.
The implications for precious metals are absolutely clear. If inflation is falling and growth remains decent, there is no reason to hold gold as an inflation hedge. The primary investment case for gold simply collapses. This explains why gold and silver prices have cratered despite the lack of any major negative news about the global economy or financial markets.
**Expert Market Analysis and Outlook**
I have been following commodity markets long enough to recognize when we are in true capitulation territory. The recent price action in gold and silver suggests we may be approaching that phase, but it is not yet clear if the bottom is truly in.
Jateen Trivedi, who serves as VP Research Analyst for Commodity and Currency at LKP Securities, offered some important perspective on the situation. Trivedi stated that gold is expected to remain volatile but relatively more stable compared to silver, which may continue to witness exaggerated swings. He recommended that in the current phase, caution is advisable. Rather than rushing to buy the dip, Trivedi suggested that a watch and learn approach is better until volatility subsides and price structures stabilize.
This is remarkably sound advice. The temptation to catch the falling knife in precious metals is enormous right now. Some investors believe gold and silver have fallen so far that they must bounce. But the reality is that during true margin call cascades, the concept of “too cheap to go lower” is meaningless. Forced selling can push prices far below what fundamental analysts consider fair value.
Manoj Kumar Jain from Prithvi Finmart offered specific technical levels and observations. Jain noted that gold and silver are currently experiencing extreme price swings driven by leveraged unwinding. He believes silver may find a floor near $65 per troy ounce, while gold could hold above the $4,440 mark on a weekly closing basis. These levels represent critical technical support where some stabilization might occur.
Jain specifically warned that volatility in both metals is likely to persist in the near term, influenced by movements in the dollar index and ongoing geopolitical developments. He provided specific technical support and resistance levels for traders, recommending that investors hold off on fresh trades until bullion prices show clearer signs of stability.
Both experts essentially agree on the same overarching theme. The current environment is characterized by extreme volatility driven by forced liquidations and margin calls. Attempting to trade this market requires nerves of steel and deep understanding of technical levels. Most investors would be far better served waiting for the volatility to subside before making any investment decisions.
Impact on Indian Investors and MCX Markets
As someone who covers Indian financial markets extensively, I need to address the specific impact this situation has on Indian investors holding MCX gold and MCX silver positions. The situation for Indian investors is particularly complex because of currency movements layered on top of global precious metals price declines.
The relationship between MCX prices and global spot prices is direct and immediate. The Multi Commodity Exchange of India uses global spot prices as the fundamental price discovery mechanism. When global gold and silver prices move, MCX prices move in lockstep within minutes. This relationship is maintained by arbitrage traders who quickly exploit any divergence between MCX and global prices.
When global gold prices fall, MCX gold prices fall. When global silver prices fall, MCX silver prices fall. There is no lag and no escape. The margin call cascade happening in global futures markets translates immediately into similar forced selling on the MCX.
But Indian investors face an additional headwind that global investors do not face. When the U.S. dollar strengthens, it creates two separate forces pushing MCX precious metals prices downward. First, the global price itself falls as previously discussed. Second, the rupee weakness means that the rupee denominated price rises even more aggressively than the global price decline alone would suggest.
Let me explain this more clearly. Imagine spot gold falls 5 percent from $5,000 to $4,750 per ounce. That is a direct $250 per ounce loss. But if during this same period the rupee weakens from 83 to the dollar down to 85 to the dollar, the rupee denominated price declines even more severely. The combination of both forces hitting simultaneously creates exceptional pain for Indian investors.
This is precisely what has occurred during this gold and silver crash. Global prices have collapsed due to margin call cascades and IMF inflation data. Simultaneously, the rupee has weakened as the U.S. dollar has strengthened globally. Indian investors holding MCX gold and MCX silver have therefore suffered losses that are more severe than global investors holding similar positions.
The key support levels on MCX are particularly critical for Indian investors. If MCX gold drops below Rs 1,37,700, there is no meaningful support until much lower levels. If MCX silver breaks below Rs 2,44,000, the next support comes in much lower. These levels represent points where Indian investors might see forced selling culminate and stabilization begin.
How to Think About Gold and Silver Investments Moving Forward
As a professional finance content creator who works extensively with institutional investors, I want to offer some perspective on how to think about precious metals investments during this extremely volatile period. This situation creates both genuine risks and authentic opportunities depending on your investment timeline and risk tolerance.
For long term investors with a multi year investment horizon, the gold and silver crash actually creates a compelling opportunity to accumulate positions at much lower prices. If you believe that gold serves an important portfolio diversification function and geopolitical hedge value, then prices that are 30 to 40 percent below recent peaks offer much better value than recent price levels.
However, I would strongly recommend against trying to catch the falling knife by deploying all of your capital at once. Instead, consider a systematic approach where you gradually add to positions as prices decline. This dollar cost averaging approach reduces the risk that you commit all your capital right at the moment before the market crashes even further.
The key is distinguishing between technical weakness and fundamental deterioration. The current gold and silver crash is primarily driven by forced liquidations from margin calls and negative sentiment shift due to falling inflation expectations. These are technical and sentiment factors, not fundamental deterioration in gold and silver as physical commodities or portfolio diversifiers.
For active traders and speculators, I would recommend staying on the sidelines until technical signals show some stabilization. The current environment is simply too volatile and unpredictable for most traders to navigate profitably. Wait for price bounces to form higher lows. Wait for volatility to decline significantly. Wait for some period of price stability where technical trading becomes possible again.
The most critical principle to follow right now is avoiding catastrophic losses. Do not leverage up and bet the ranch on a bounce in precious metals. Do not concentrate all your assets into gold or silver. Do not dismiss the possibility of even lower prices before stabilization occurs.
**Frequently Asked Questions About This Gold and Silver Situation**
I have received numerous questions from investors about this gold and silver crash, so let me address the most common ones directly.
**First question:** Is this the absolute bottom for gold and silver prices?
The honest answer is that no one can predict the precise bottom with certainty. However, technical analysis suggests that significant support exists around $4,440 for gold and $65 for silver. If these levels break, we could certainly see additional weakness. But predicting the exact bottom is fool’s errand even for professional traders.
**Second question:** Why did CME actually decide to raise margin requirements right now?
The CME raises margin requirements when volatility reaches levels they deem unsustainable and when the potential losses on leveraged positions exceed the margin deposit amounts. By raising margins, they protect the financial system from cascading losses if one major trader defaults.
**Third question:** Will the gold and silver price crash actually continue or have we seen the worst?
This depends entirely on whether forced liquidations are complete and whether technical support holds. Current signals suggest volatility will remain elevated for weeks. Additional weakness cannot be ruled out if key support levels break decisively.
**Fourth question:** Should I buy this dip in gold and silver right now?
This depends entirely on your investment timeline and risk tolerance. Long term investors with patience can consider systematic purchases at lower prices. Short term traders should wait for stabilization before entering new positions. Most retail investors should simply wait patiently and avoid the temptation to catch falling knives.
**Fifth question:** How will the IMF inflation forecast impact gold prices going forward?
Lower expected inflation removes the primary investment thesis that has driven gold demand in recent years. This creates structural headwinds for precious metals prices regardless of where prices stabilize technically.
**Sixth question**: Is gold still truly a safe haven asset in 2026?
Gold still provides meaningful portfolio insurance and geopolitical hedge value. However, the safe haven premium has been called into question by the recent crash. Gold still offers portfolio protection but at more reasonable valuations than the recent peaks.
**Seventh question**: What is the specific impact on Indian investors holding MCX positions? I
ndian investors face double pressure from both global price declines and rupee weakness. Lower prices could attract incremental jewelry and investment demand in India as valuations become more attractive.
**The Bottom Line on Gold and Silver Right Now**
February 2, 2026, will be remembered as a watershed moment in precious metals markets. The combination of increased margin requirements from CME and the IMF inflation announcement has absolutely dismantled the bull case that had driven precious metals to record highs. What seemed like an unstoppable bull market just days ago has transformed into a bloodbath that has left investors shell shocked and bruised.
The third consecutive day of declines suggests that forced liquidations from margin calls are still ongoing. This means capitulation may not yet be complete. The critical support levels at $4,440 for gold and $65 for silver represent key technical barriers. If these levels break decisively, additional weakness cannot be ruled out.
That said, the gold and silver crash also creates opportunities for investors who maintain a long term perspective. Precious metals that were trading at record highs now offer considerably better value for portfolio diversification and geopolitical hedging. Patient investors willing to wait for volatility to subside may find that accumulating positions at these lower prices delivers superior long term returns compared to purchasing near recent peaks.
The key principle to follow is understanding the difference between temporary technical weakness driven by forced liquidations and fundamental deterioration in the investment case for precious metals. The current situation represents technical weakness and sentiment shift rather than fundamental collapse in gold and silver as assets.
As the volatility continues to ripple through global financial markets and the IMF inflation announcement confirms the official end of the inflation crisis era, precious metals investors enter a genuinely new phase in the cycle. Understanding these dynamics and maintaining discipline will determine whether investors emerge from this chaos with their wealth intact or face devastating permanent losses.
The path forward requires patience, discipline, and clear eyed assessment of technical support levels and fundamental investment value. Investors who maintain these qualities will navigate 2026 precious metals markets successfully
Stay ahead of global markets, [gold prices](https://timesofindia.indiatimes.com/business/india-business/gold-silver-prices-continue-to-crash-mcx-silver-mcx-gold-drop-what-investors-should-know/articleshow/127857222.cms), central bank policy, and breaking finance news,[Daily Finance](https://df.media/).
**Categories:** Capital Markets, Cryptocurrency, Finance, Global News, Investing
**Tags:** Gold Price, IMF, INFLATION, SILVER PRICE
---
### [Global Finance Daily Briefing: Jan 30, 2026 Full Report](https://df.media/global-finance-daily-briefing-jan-30-2026/)
**Published:** January 30, 2026
**Author:** Vishnu Priya
**Content:**
## Global Market Briefing
Stay updated with the latest shifts in global finance. Analysis of the Fed transition and emerging market growth. Insights brought to you by [DAILY FINANCE](https://df.media/).
India GDP 📈
7.2%
FY27 Projection
USD / INR 📉
91.90
Record Low Hit
Gold Spot 🔻
-1.28%
Market Correction
BoJ Rate 🏛️
0.75%
Held Steady
### Volatility Index
Percentage shifts in major indicators.
### Sector Analysis
News volume distribution for Jan 30.
### [Daily Finance Insights](https://df.media/)
Deep-dive into today’s 25 key reports.
All Macro Equities Energy
### Master the Market Cycle
Join the elite circle of investors receiving direct intelligence. Secure your edge with [DAILY FINANCE](https://df.media/).
[ FOLLOW DAILY FINANCE ](https://df.media/)
🌍
**Categories:** Banking
---
### [US Fed Holds Interest Rates Steady in 2026, Reinforces Data-Driven Policy Stance](https://df.media/us-fed-meeting-2026-rates-held-at-3-75/)
**Published:** January 29, 2026
**Author:** Vishnu Priya
**Excerpt:** The US Federal Reserve keeps rates unchanged in 2026 as inflation remains elevated. Jerome Powell signals a cautious, data-driven policy path.
**Content:**
**Washington \| January 29, 2026**
The US Federal Reserve on Wednesday kept its benchmark interest rates unchanged at **3.5%–3.75%**, as expected, signaling a deliberate pause in monetary easing while inflation remains above the central bank’s long-term target.
The decision followed a two-day meeting of the **Federal Open Market Committee (FOMC)** and came after three rate cuts in 2025. Federal Reserve Chair **Jerome Powell** said the current policy stance is appropriate to balance economic growth and inflation risks as the US economy enters 2026.
“In support of our goals, the Committee decided to maintain the target range for the federal funds rate,” the FOMC said in its statement, reiterating its commitment to maximum employment and price stability.
### Inflation Still Elevated, Growth Resilient
Powell noted that inflation continues to run above the Fed’s 2% target, largely due to higher goods prices linked to tariffs. However, he emphasized that services inflation is gradually easing and longer-term inflation expectations remain well anchored.
Economic activity, according to the Fed, is expanding at a solid pace. Consumer spending has remained resilient, and business investment continues to support growth, although the housing sector remains under pressure due to higher borrowing costs.
The labour market is showing signs of stabilization, with unemployment edging lower in recent months. At the same time, payroll growth has slowed, reflecting softer labour demand and structural shifts, including the early impact of artificial intelligence on hiring patterns.
### Fed Vote and Policy Outlook
The FOMC voted **10–2** in favour of keeping rates unchanged. Governors **Christopher Waller** and **Stephen Miran** dissented, supporting a 25-basis-point cut at this meeting.
Powell stressed that **rate hikes are not the base case**, but the Fed is not yet ready to commit to a rapid easing cycle. According to the central bank’s projections, **only one 25-basis-point rate cut is expected in 2026**, subject to incoming data on inflation and employment.
“Policy will remain firmly data-driven,” Powell said, adding that future adjustments will depend on how risks to inflation and the labour market evolve.
### Market Reaction and Asset Shifts
Financial markets reacted calmly to the announcement. US equity indices ended marginally higher, while Treasury yields firmed as expectations for near-term rate cuts diminished. The US dollar remained broadly steady following the decision.
Commodities, however, saw a stronger response. **Gold prices jumped sharply**, extending a record-breaking rally, as investors increased allocations to hard assets amid concerns around fiscal sustainability, geopolitical uncertainty, and long-term policy credibility.
### What This Means Going Forward
The January meeting underscores a broader shift in US monetary policy. Rather than acting as a growth accelerator, the Federal Reserve is positioning itself as a risk stabilizer, prioritizing credibility, flexibility, and inflation control over speed.
As 2026 unfolds, markets will remain highly sensitive to inflation prints, labour market data, and trade-related developments, with the Fed signaling that patience—not urgency—will define its next move.
**Categories:** Banking, Capital Markets, Finance, Global News, Investing
---
### [India-EU Free Trade Agreement 2026 Signed: A Landmark Shift in Global Trade](https://df.media/india-eu-free-trade-agreement-2026-signed-df-media/)
**Published:** January 27, 2026
**Author:** Laura Anderson
**Excerpt:** India and the EU sign the India-EU Free Trade Agreement 2026, creating a $136B trade zone in investment & manufacturing.
**Content:**
**New Delhi:**
India and the European Union have formally signed the **India-EU Free Trade Agreement 2026**, marking one of the most significant global trade developments in recent years. Announced at the **India-EU Summit 2026** in New Delhi, Prime Minister Narendra Modi described the agreement as the “**mother of all trade deals**,” citing its scale, ambition, and long-term economic impact.
The agreement brings together two major economic powers representing nearly **25 percent of global GDP** and close to **one-third of world trade**, creating a unified trade corridor connecting almost **two billion people**. At a time when global trade faces fragmentation and geopolitical strain, the India-EU Free Trade Agreement 2026 signals a decisive move toward economic cooperation and stability.
## What the India-EU Free Trade Agreement 2026 Covers
Under the India-EU Free Trade Agreement 2026, India has committed to reducing or eliminating tariffs on **over 90 percent of EU-origin goods**, with phased implementation timelines across sectors. In select categories, tariff liberalisation is expected to reach **96.6 percent**, making it one of India’s most comprehensive trade agreements to date.
Key European exports expected to benefit include automobiles, industrial machinery, chemicals, pharmaceuticals, and clean energy equipment. Import duties on European cars, previously exceeding 100 percent in some cases, will be reduced significantly over time.
For Indian exporters, the India-EU FTA opens expanded access to European markets for textiles, engineering goods, pharmaceuticals, IT services, and professional services, strengthening India’s role in global value chains.
## India-EU Summit 2026: Trade, Technology, and Strategy
The India-EU Summit 2026 extended beyond trade discussions. Leaders from both sides agreed to deepen cooperation in **technology, defence, digital infrastructure, supply-chain resilience, and clean energy**.
European Commission President Ursula von der Leyen emphasised that the India-EU Free Trade Agreement 2026 creates a predictable, transparent, and rules-based trade environment. European Council President António Costa highlighted the agreement’s role in strengthening long-term economic and strategic ties between India and Europe.
According to official data from the European Commission, the EU is already **India’s largest trading partner**, with bilateral trade in goods reaching **€120 billion in 2024**, alongside substantial foreign direct investment inflows.
Authoritative source:
[https://policy.trade.ec.europa.eu/eu-trade-relationships-country-and-region/countries-and-regions/india\_en](https://policy.trade.ec.europa.eu/eu-trade-relationships-country-and-region/countries-and-regions/india_en)
## Why the India-EU Trade Deal Matters Globally
The India-EU trade deal has drawn significant international attention, particularly as major economies reassess supply chains amid rising protectionism. Analysts view the agreement as a strategic response to global uncertainty, enabling diversification of trade partnerships and reducing dependence on limited markets.
Trade between India and the EU has grown nearly **90 percent over the past decade**, and the India-EU Free Trade Agreement 2026 is expected to accelerate this trajectory. More than **6,000 European companies** currently operate in India, and the deal is likely to attract fresh investments in manufacturing, renewable energy, advanced technology, and services.
## Investment, Services, and Manufacturing Impact
Beyond goods, the India-EU Free Trade Agreement 2026 places strong emphasis on services liberalisation and investment facilitation. Sectors such as financial services, telecom, logistics, IT, and professional services are expected to benefit from clearer regulatory frameworks and improved market access.
For India, the agreement aligns with national priorities including **Make in India**, **Digital India**, and industrial expansion. For the EU, it secures deeper access to one of the world’s fastest-growing major economies.
## What Happens Next After the FTA Signing
While the India-EU Free Trade Agreement 2026 has been signed, implementation will follow a phased roadmap. Tariff reductions, regulatory harmonisation, and sector-specific commitments will roll out gradually following ratification procedures on both sides.
Parallel negotiations on investment protection and geographical indications are expected to progress alongside the core agreement.
As global trade patterns continue to evolve, the India-EU Free Trade Agreement 2026 stands as a defining milestone, reshaping economic ties between Asia and Europe for decades to come.
---
## FAQs (AEO Optimised)
**What is the India-EU Free Trade Agreement 2026?**
It is a comprehensive trade pact between India and the European Union aimed at reducing tariffs, improving market access, and boosting investment.
**Why is PM Modi calling it the mother of all trade deals?**
Because of its scale, covering a quarter of global GDP and transforming trade across goods, services, and strategic sectors.
**When will the agreement take effect?**
Implementation will begin in phases following ratification and regulatory alignment.
**Which sectors benefit the most?**
Manufacturing, automobiles, pharmaceuticals, clean energy, technology, and services.
---
**[Follow DF Media](https://df.media/) for more global trade, startup, investment, and economic ecosystem insights.**
**Categories:** Global News
---
### [US Threatens Tariff Hikes on Eight European Countries Over Greenland Dispute](https://df.media/us-threatens-tariff-hikes-on-europe-over-greenland/)
**Published:** January 21, 2026
**Author:** Vishnu Priya
**Excerpt:** The US plans new tariffs on eight European countries over Greenland, escalating NATO tensions and reshaping global trade and geopolitics.
**Content:**
The United States has sharply escalated tensions with Europe after President Donald Trump announced new tariffs on imports from eight European countries, citing an unresolved dispute over Greenland. The move represents one of the most aggressive trade actions taken against NATO allies in recent years and highlights a broader shift in how economic tools are being used to pursue geopolitical objectives.
From **February 1, 2026**, the US will impose an **additional 10% tariff** on goods imported from **Denmark, Norway, Sweden, France, Germany, the United Kingdom, the Netherlands, and Finland**. President Trump warned that the tariff rate will rise to **25% by June 1** if US conditions related to Greenland are not met.
---
## Tariffs Layered on Existing Duties
The newly announced measures will **add to existing US trade barriers**. The United Kingdom already faces a 10% tariff, while the other seven European countries are subject to a 15% duty. If the new penalties take full effect, combined tariffs could reach **nearly 40% on some European exports**, significantly disrupting transatlantic trade.
All eight countries targeted are **long-standing NATO allies**, making the move especially controversial and raising concerns about the future of US–Europe economic cooperation.
---
## Why Greenland Is at the Center of the Dispute
Greenland, an autonomous territory within the Kingdom of Denmark, has emerged as a critical strategic asset. Its location in the Arctic makes it increasingly important for **missile defence systems, military logistics, Arctic shipping routes, and access to rare earth minerals**.
President Trump has repeatedly argued that US control over Greenland is necessary for national and global security. Both **Denmark and Greenland have rejected any proposal to sell or transfer sovereignty**, reaffirming their commitment to territorial integrity.
In response to growing pressure, Denmark has expanded its **military presence in Greenland**, while the other seven European nations have deployed limited personnel to the region as a show of alliance unity and deterrence.
---
## Europe Warns of a Dangerous Downward Spiral
In a **joint statement released on Sunday**, the eight European governments warned that the tariff threat risks damaging decades of transatlantic cooperation.
“Tariff threats undermine transatlantic relations and risk a dangerous downward spiral,” the statement said, while confirming readiness to engage in dialogue based on **sovereignty and international law**.
Despite the diplomatic tone, European leaders are actively preparing countermeasures.
---
## EU Prepares Retaliation Against the United States
According to multiple reports, European policymakers are considering **retaliatory tariffs on up to €93 billion worth of US imports**. Discussions are also underway to delay progress on the **EU–US trade agreement**, which still requires approval from national parliaments.
A key option under review is the EU’s **anti-coercion instrument**, designed to counter economic pressure from foreign governments. If triggered, it could:
- Restrict US participation in EU public tenders
- Limit American access to European investment and banking markets
- Target US dominance in surplus service sectors such as digital services
Such actions would represent a shift from symbolic retaliation to **structural economic resistance**.
---
## What This Means for Global Business and Markets
For multinational companies and investors, the consequences are immediate. Trade policy has evolved into a **geopolitical enforcement tool**, not just an economic mechanism.
Businesses operating across US–EU supply chains now face:
- Increased tariff volatility
- Heightened regulatory and political risk
- Potential disruption in manufacturing, technology, and digital services
Executives are being forced to reassess assumptions about alliance stability, trade predictability, and long-term market access.
---
## A Turning Point in Transatlantic Relations
While Greenland may seem geographically distant, the dispute reflects a larger global trend: **economic power is increasingly being used to contest strategic territory and influence**. The outcome could redefine how sovereignty, trade, and security intersect in the coming decade.
Whether diplomacy prevails or escalation continues, one conclusion is unavoidable. The era of frictionless transatlantic trade has ended. What replaces it will depend on how far the United States and Europe are willing to push economic pressure in pursuit of strategic advantage.
---
## FAQs
**Why is the US imposing tariffs on European countries?**
The US says the tariffs are linked to a dispute over Greenland, which Washington views as strategically critical for security and defence.
**Which countries are affected by the new US tariffs?**
Denmark, Norway, Sweden, France, Germany, the UK, the Netherlands, and Finland.
**When will the US tariffs take effect?**
A 10% tariff begins on February 1, 2026, with a potential increase to 25% on June 1.
**How is Europe responding to the US tariff threat?**
European leaders are considering retaliatory tariffs, delaying the EU–US trade deal, and activating the EU anti-coercion instrument.
**Categories:** Global News
---
### [Trump Inauguration 2026: Wall Street Volatility and Global Finance Impact](https://df.media/trump-inauguration-2026-wall-street-volatility-market/)
**Published:** January 20, 2026
**Author:** Laura Anderson
**Excerpt:** Trump’s January 20, 2026, inauguration triggers Wall Street volatility. Explore stock reactions, trade policies, and global finance insights today.
**Content:**
**Inauguration Day Trading: What Investors Are Watching Closely**
President Donald Trump’s January 20, 2026, inauguration is set to shake global markets. Investors and analysts are closely monitoring potential policy announcements, including **tariffs, executive orders, and Fed interest rate guidance**. Historical patterns suggest a mix of market rallies and short-term volatility, making this event a must-watch for traders, institutions, and international investors alike.
**Historical Context: How Past Inaugurations Shaped Wall Street**
Looking back, Trump’s first-term inauguration and prior re-election events had clear market impacts. The **S&P 500 rose 15–21%** in the first months following these inaugurations, largely fueled by **tax incentives, deregulation, and energy sector support**. Yet, markets were far from predictable: tweets and surprise policy announcements triggered sudden intra-day swings, particularly in **tech, defense, and industrial sectors**.
Inauguration day itself often sees **regular trading halted**, with futures contracts reflecting early investor sentiment. On past inaugurations, U.S. futures rose modestly amid confidence in policy tailwinds, offering an early snapshot of sector-specific trends. This historical insight is critical for traders positioning ahead of January 20, 2026.
**Inauguration Day Market Reactions**
On the day itself, several financial instruments are likely to experience heightened movement:
- **U.S. Futures:** Early indications suggest a **0.4–0.6% climb**, with financials and energy sectors leading on expectations of pro-business policies.
- **Gold:** Investors flock to safe-haven assets; gold has already surged to **$4,697/oz**, providing a buffer against **trade and geopolitical uncertainty**.
- **Bitcoin and Crypto:** Digital assets are sensitive to policy uncertainty. Bitcoin slipped below **$92,000**, reflecting tariff fears and potential regulatory scrutiny on cryptocurrency reserves.
The[ **Federal Reserve’s actions**](http://Federal%20Reserve%20policy%20outlook%20and%20rate%20decisions%20👉%20https://www.federalreserve.gov/monetarypolicy.htm) remain a key variable. Market watchers anticipate that the late-January Fed meeting may adjust rate-cut expectations based on inflation pressures from policy changes and trade negotiations.
**Volatility Triggers: What Could Move Markets**
Several factors are expected to drive volatility in the coming weeks:
- **Trade Policies:** Potential **200% tariffs on EU goods and NATO allies**, partly due to disputes over Greenland and other geopolitical issues, could pressure global indices.
- **Executive Orders:** Over **25 executive orders** are expected on topics like **immigration, crypto reserves, and energy emergencies**, impacting currencies like the peso, yuan, and euro.
- **Earnings & Jobs Data:** Q4 corporate reports and U.S. labor data will test market resilience, highlighting potential sector winners and losers.
Market participants are advised to monitor both U.S. domestic developments and global ripple effects. Emerging market equities and currency valuations could fluctuate sharply in response to U.S. policy signals.
**Global Implications of the Trump Inauguration 2026**
The inauguration isn’t just a U.S. domestic story. It has profound implications for international investors:
- **Emerging Markets:** Capital flows may shift away from riskier assets in response to trade disputes and tariffs.
- **Commodities:** Gold, silver, and other precious metals are likely to see increased demand as safe-haven assets.
- **Cryptocurrencies:** Crypto adoption may slow if policy signals tighter regulation or reserve requirements.
For multinational corporations, global trade agreements could be revisited, potentially affecting supply chains, logistics costs, and commodity pricing. Currency volatility is expected in regions heavily tied to U.S. trade policies.
**Sector-Specific Insights**
Certain sectors are likely to feel the immediate impact:
- **Financials:** Banks and investment firms could benefit short-term from deregulation and corporate tax optimism.
- **Energy:** Fossil fuels and energy infrastructure may see gains if policies favor domestic production.
- **Tech:** Tech giants and defense contractors remain sensitive to tariff risks, regulatory scrutiny, and executive messaging.
Investors should position portfolios with these sectoral risks in mind, balancing exposure with hedging strategies like gold, commodities, or diversified global ETFs.
**Volatility Management Strategies**
Given the expected turbulence, traders and investors are advised to:
1. Use **futures contracts and options** to hedge risk in key indices like S&P 500 and NASDAQ.
2. Allocate a portion of portfolios to **safe-haven assets** like gold and U.S. treasuries.
3. Monitor **crypto exposure**, especially assets sensitive to U.S. regulatory policy.
4. Track **short-term FX movements** for currency-sensitive investments.
Proactive risk management will be essential to protect capital while taking advantage of potential market rallies.
**Analyst Outlook & Predictions**
Analysts anticipate a “**new volatile era**” for U.S. equities, shaped by a mix of policy-driven rallies and uncertainty. While banks and energy firms may outperform initially, trade-exposed sectors could lag until policy clarity emerges.
Earnings growth projections remain strong, with **EPS growth estimated at 10%**, but midterm political shifts could produce corrections or sudden swings. Investors are advised to maintain **flexible strategies** and closely follow both economic indicators and executive directives.
**Conclusion: Trump Inauguration Wall Street 2026**
Donald Trump’s January 20, 2026, inauguration represents a **market-moving catalyst** with wide-reaching implications. Traders, investors, and global institutions should expect elevated **volatility, sector rotation, and currency movements**.
The key takeaway: understanding historical patterns, monitoring policy announcements, and staying nimble with portfolio strategies is essential.
For continuous **breaking updates on global finance**, trade policies, and market reactions, follow **[Daily Finance](https://df.media/)** and stay ahead of the curve.
**Categories:** Bitcoin (BTC), Finance, Global News
---
### [Fed Rate Cut March 2026 Predictions: The Definitive Guide to the Year’s Biggest Financial Pivot](https://df.media/fed-rate-cut-march-2026-predictions/)
**Published:** January 19, 2026
**Author:** Vishnu Priya
**Excerpt:** With inflation hitting 2.1%, the Fed Rate Cut March 2026 predictions are surging. Discover how the upcoming FOMC pivot will impact mortgage rates, the stock market, and your personal savings today.
**Content:**
The global financial ecosystem is currently standing at a high-stakes crossroads. As we navigate the opening weeks of 2026, one phrase is dominating the search bars of investors, homeowners, and economists alike: **Fed Rate Cut March 2026 Predictions**. After a grueling cycle of “higher-for-longer” interest rates aimed at taming the post-pandemic inflation surge, the Federal Reserve is finally signaling a shift. This “pivot,” as Wall Street calls it, is not just a minor adjustment—it is a fundamental restructuring of the global cost of capital.
For those tracking the **Federal Reserve monetary policy 2026 forecast**, the March 17–18 FOMC meeting is being viewed as the most significant economic event of the year. In this comprehensive guide, we explore why this prediction has become the “north star” for financial planning and how you can position your portfolio to thrive.
## The Data Behind the March 2026 Predictions
The surge in **Fed Rate Cut March 2026 Predictions** isn’t based on guesswork; it is driven by a series of cooling inflation prints throughout late 2025. The Core Personal Consumption Expenditures (PCE) price index, the Fed’s preferred inflation gauge, has finally dipped toward the 2.1% mark. This convergence with the Fed’s 2% target has given Chairman Jerome Powell the “greater confidence” required to move away from restrictive territory.
Currently, the CME FedWatch Tool indicates a 72% probability of a 25-basis point (bps) cut. Some aggressive analysts even suggest a 50-bps cut if the February jobs report shows any sign of cracks in the labor market. This **FOMC meeting March 2026 outlook** has already begun to lower yields on the 10-year Treasury, setting the stage for a broader market shift.
## Impact of Fed Pivot on Mortgage Rates 2026
Perhaps no group is more sensitive to these predictions than the housing market. The **impact of Fed pivot on mortgage rates 2026** is expected to be immediate. For the past two years, the housing market has been in a “lock-in” effect—homeowners with 3% mortgages have been unwilling to move, and buyers have been priced out by 7.5% rates.
As the March rate cut predictions solidify, mortgage lenders are already pricing in a softer Fed. We are seeing 30-year fixed rates begin to slide toward the low 6% or even high 5% range. This shift is expected to unleash a wave of pent-up demand. However, experts warn that as rates drop, housing prices may rise due to increased competition, making the timing of a purchase critical for first-time buyers.
## Top 10 Stocks to Watch for the March Pivot
When rates fall, certain sectors act like a coiled spring. Based on current market analysis, these are the top 10 stocks and sectors poised to benefit:
1. **NVIDIA (NVDA) & Microsoft (MSFT):** Growth giants whose valuations expand as discount rates fall.
2. **Prologis (PLD):** A leader in industrial REITs that benefits from lower borrowing costs.
3. **NextEra Energy (NEE):** Utilities are classic “bond proxies” that become attractive when yields drop.
4. **Small-Cap Focus (IWM – Russell 2000 ETF):** Small companies with floating-rate debt see an immediate boost to the bottom line.
5. **D.R. Horton (DHI):** Homebuilders thrive as mortgage rates become more affordable for buyers.
6. **Tesla (TSLA):** Lower rates make auto loans cheaper, driving consumer demand.
7. **Amazon (AMZN):** Increased consumer discretionary spending typically follows a Fed easing cycle.
8. **American Tower (AMT):** Infrastructure REITs with heavy capital expenditure needs see reduced interest expenses.
9. **PayPal (PYPL):** Fintech and payment volumes usually swell as economic activity picks up.
10. **Coinbase (COIN):** As a gateway to crypto, this stock thrives on the “risk-on” sentiment generated by Fed liquidity.
## The Crypto Market Connection
Beyond traditional finance, the **Fed Rate Cut March 2026 Predictions** are a major catalyst for digital assets. Bitcoin and Ethereum are often viewed as “liquidity barometers.” When the Fed cuts rates, it increases the global supply of “cheap” dollars. Historically, this excess liquidity flows into high-risk, high-reward assets. With Bitcoin already hovering near the $95,000 mark, a confirmed March pivot could be the fuel that finally pushes the premier cryptocurrency into a six-figure valuation.
---
## The 2026 Investor Checklist: Preparing for March 18th
To navigate the volatility of the **FOMC meeting March 2026 outlook**, use this professional checklist:
- \[ \] **Review Fixed-Income Duration:** Consider moving from short-term “cash” into longer-term bonds to lock in current yields before they drop further.
- \[ \] **Assess Debt Exposure:** If you have variable-rate business or personal loans, calculate the savings from a 25–50 bps cut.
- \[ \] **Rebalance into Growth:** Check your exposure to the Nasdaq and small-cap stocks, which traditionally lead the “Initial Easing Phase.”
- \[ \] **Monitor PCE & Jobs Data:** Watch the February 13th CPI and March 6th Jobs report; these are the “final hurdles” for the Fed.
- \[ \] **Set “Buy Limits” for Crypto:** High volatility is expected. Set entry points for BTC and ETH to capture the “liquidity pump.”
---
## Conclusion: Preparing for the Global Pivot
As we approach the March FOMC meeting, volatility is to be expected. While the **Fed Rate Cut March 2026 Predictions** are overwhelmingly positive, the Fed remains “data-dependent.” Any surprise spike in inflation in February could delay the pivot, leading to a short-term market correction.
However, the long-term trajectory is clear. The era of aggressive tightening is over, and the era of normalization has begun. Whether you are rebalancing a 401(k), looking to refinance a home, or trading the latest crypto breakout, the March 2026 pivot is your roadmap for the rest of the year.
**Categories:** Global News
---
### [Why Crypto Is Going Up Today? Bitcoin, Ethereum, XRP and Dogecoin Post Strongest Gains in 2 Months](https://df.media/why-crypto-is-going-up-today-bitcoineth-xrp-doge-surge/)
**Published:** January 14, 2026
**Author:** Vishnu Priya
**Excerpt:** Crypto prices surged today as Bitcoin hit $96,500, Ethereum crossed $3,300, XRP gained 5%, and Dogecoin jumped 8%. Here’s why.
**Content:**
## **Why Crypto Is Going Up Today**
Cryptocurrency markets are rallying sharply today, with **Bitcoin, Ethereum, XRP, and Dogecoin posting their strongest gains in nearly two months**. The surge is being driven by a powerful mix of cooling U.S. inflation data, large-scale short liquidations, renewed institutional inflows into spot Bitcoin ETFs, and improving regulatory sentiment in the United States.
On Tuesday, **Bitcoin surged 4.6% to $96,500**, its biggest single-day gain since late November. Ethereum rallied to $3,362, XRP climbed over 5%, and Dogecoin soared nearly 8%, signaling broad-based strength across the crypto market.
However, despite the optimism, prices are showing **modest corrections on Wednesday**, suggesting the rally may still be part of a wider consolidation phase rather than the start of a new bull trend.
---
## **Crypto Prices Today (January 14, 2026)**
- **Bitcoin price today:** $95,120 (-0.28%)
- **Ethereum price today:** $3,296 (-0.81%)
- **XRP price today:** $2.13 (-1.77%)
- **Dogecoin price today:** $0.1467 (-0.99%)
---
## **Key Reasons Why Crypto Is Rising**
### **1. Cooling U.S. Inflation Boosts Risk Appetite**
Core U.S. CPI eased to **2.6% from 2.7%**, strengthening expectations that the Federal Reserve is nearing the end of its tightening cycle. Lower inflation typically benefits risk assets, including cryptocurrencies.
### **2. $591 Million in Short Liquidations**
More than **$591 million worth of crypto short positions were liquidated** in 24 hours. This forced bearish traders to buy back positions, accelerating price gains across major tokens.
### **3. Surge in Spot Bitcoin ETF Inflows**
Spot Bitcoin ETF inflows jumped nearly **7x to $753.7 million**, highlighting renewed institutional demand and long-term confidence in Bitcoin.
### **4. Regulatory Optimism From the CLARITY Act**
The proposed **CLARITY Act**, aimed at improving crypto regulatory frameworks in the U.S., added a strong sentiment tailwind, particularly for large-cap cryptocurrencies.
---
## **Bitcoin Price Analysis: Resistance Still Intact**
Bitcoin’s rally to **$96,500** tested the upper boundary of a two-month consolidation range but failed to confirm a breakout.
### **Bitcoin Technical Levels**
- Resistance zone: **$94,000–$96,000**
- Support zone: **$82,000–$85,000**
- 200-day MA: **$106,120**
- Medium-term downside target: **$74,000**
- Extended downside target: **$68,000**
As long as Bitcoin remains below the **200-day moving average**, the broader trend remains technically bearish despite short-term rallies.
---
## **Ethereum Price Analysis: 200 EMA Remains Key Barrier**
Ethereum rallied strongly but is now stalling near **$3,300**, just below the critical **200-day EMA at $3,637**.
### **Ethereum Technical Levels**
- Current price: **$3,296**
- Major resistance: **$3,637 (200 EMA)**
- Support zone: **$2,600–$2,730**
- Trend status: Bearish below 200 EMA
Previous rejections from this level triggered sharp corrections, suggesting Ethereum may again retest lower consolidation levels.
---
## **XRP Price Prediction: Bearish Structure Persists**
XRP remains one of the weaker large-cap cryptocurrencies from a technical perspective. After rejecting the **200-day MA at $2.57** earlier this month, XRP is already in a corrective phase.
### **XRP Key Levels**
- Current price: **$2.13**
- Resistance: **$2.57**
- Support target: **$1.77**
Unless XRP reclaims its 200-day average, downside pressure is expected to continue.
---
## **Dogecoin Price Analysis: 15-Cent Wall Holds**
Dogecoin posted the strongest rally among major cryptocurrencies but is once again struggling to break above **$0.15**, a key psychological and technical resistance.
### **Dogecoin Technical Levels**
- Current price: **$0.1467**
- Resistance: **$0.15**
- 200-day MA: **$0.193**
- Downside target: **$0.12**
DOGE remains highly sentiment-driven and vulnerable to sharp reversals during consolidation phases.
---
## **Is This the Start of a New Crypto Bull Run?**
Despite improving macroeconomic conditions, **all major cryptocurrencies remain below their 200-day moving averages**, indicating that the broader market structure is still bearish.
This creates a **disconnect between fundamentals and technicals**, where strong rallies are often followed by pullbacks rather than sustained breakouts.
---
## **Conclusion: Why Crypto Is Going Up Today**
Crypto is going up today due to **cooling inflation, massive short liquidations, strong Bitcoin ETF inflows, and improving regulatory sentiment**. However, from a technical standpoint, Bitcoin, Ethereum, XRP, and Dogecoin remain locked in multi-month consolidation ranges.
Until prices reclaim key long-term moving averages, rallies are likely to remain **tactical rather than transformational**.
---
## **FAQs: Crypto Market Today**
### **Why is crypto going up today?**
Crypto prices rose due to easing U.S. inflation, $591M in short liquidations, strong ETF inflows, and optimism around U.S. crypto regulation.
### **What is Bitcoin price today?**
Bitcoin is trading at **$95,120** on January 14, 2026, after peaking at $96,500 on Tuesday.
### **What is Ethereum price today?**
Ethereum is trading at **$3,296**, slightly below the key 200-day EMA resistance at $3,637.
**[Follow Daily Finance](https://df.media/) for more updates on global markets, crypto trends, and macroeconomic insights shaping the future of money.**
**Categories:** Bitcoin (BTC), Concordium (CCD), Cryptocurrency, Ethereum (ETH), Global News
**Tags:** Bitcoin
---
### [Venezuela Becomes Flashpoint in Escalating US–China Oil Conflict](https://df.media/us-china-oil-war-venezuela-breaking-news/)
**Published:** January 8, 2026
**Author:** Laura Anderson
**Excerpt:** The US moves to control Venezuelan oil exports, disrupting China’s supply and reshaping global energy markets amid rising tensions.
**Content:**
### When Oil Stops Being a Commodity
Venezuela is no longer just a troubled petrostate. It has become a pressure point where energy, finance, and geopolitics collide. What once looked like a slow erosion of Venezuela’s oil sector has abruptly turned into a high-stakes confrontation between Washington and Beijing. At the center of this shift is one hard truth: whoever controls Venezuelan crude controls leverage over global energy flows.
This is not a sanctions story. It is a control story. And control is what makes Venezuela the most dangerous frontline in the US–China oil war.
---
### 1. The Shock Doctrine Moment
The turning point was not gradual diplomacy. It was decisive intervention.
With the removal of Nicolás Maduro and the restructuring of Venezuela’s oil governance under US supervision, Washington effectively rewrote the rules overnight. The message was unambiguous: Latin American strategic resources fall under US security logic, not shared global stewardship.
Inside policy circles, this has been framed as a modernized Monroe Doctrine. Less ideology. More execution. The objective is simple: eliminate non-hemispheric rivals from the Western Hemisphere’s most critical assets.
For China, this was not just unexpected. It was destabilizing.
---
### 2. Oil Flows Have Been Rewired
Before this shift, China was the silent anchor of Venezuelan oil exports. Through direct shipments, debt-repayment barrels, and rerouted cargoes, Chinese refiners absorbed the majority of Venezuela’s exportable crude.
That model is now broken.
Under the new framework, Venezuelan oil is being redirected through US-approved channels, with North America emerging as the primary beneficiary. Volumes once earmarked for Asia are being repriced, rerouted, or withheld entirely.
This is not market rebalancing. It is forced reallocation.
**Strategic insight:** Oil routes define power more than oil reserves. And the routes now run through Washington.
---
### 3. China Loses Its Cheapest Strategic Barrel
For Beijing, Venezuelan crude was never about volume alone. It was about optionality.
Heavy Venezuelan crude came discounted, politically insulated, and tailored for Chinese refinery configurations. It allowed China to diversify away from Middle Eastern chokepoints while maintaining pricing leverage.
That advantage is gone.
With US oversight of Venezuelan exports described as open-ended, Chinese oil majors are now exposed to higher costs, higher risks, and fewer diplomatic workarounds. Alternative suppliers exist, but none offer the same combination of scale, discount, and strategic distance.
Energy security is not collapsing for China. But its margins are shrinking. And in energy geopolitics, margins are power.
---
### 4. Oil as a Weapon, Not a Resource
The United States is not simply selling Venezuelan oil. It is controlling how oil enters the global system.
Sales are being negotiated, proceeds are being managed, and compliance is being enforced through legal and financial architecture aligned with US interests. Every barrel now carries geopolitical intent.
This is a broader signal to the Global South: infrastructure loans and long-term supply agreements do not outweigh jurisdiction, enforcement power, and naval reach.
China’s model relies on patience and capital. The US model relies on speed and control. Venezuela exposed which one prevails when both collide directly.
---
### 5. Why Venezuela Is Different From Iran or Russia
China has navigated sanctions before. Iran and Russia still offer maneuvering room through gray markets and bilateral arrangements.
Venezuela does not.
This is the first major oil producer where export control, payment systems, and political transition are all aligned under direct US influence. That makes every shipment a geopolitical event rather than a commercial one.
For other resource-rich states watching closely, the lesson is uncomfortable but clear: strategic ambiguity disappears fast when great-power competition enters your energy sector.
---
### What This Means Going Forward
**For global energy markets**
Expect volatility driven less by supply shortages and more by policy risk. Refining dynamics will favor regions aligned with US logistics and compliance frameworks.
**For China**
Beijing will accelerate diversification toward Russia, Iran, and domestic capacity, while reassessing how much geopolitical risk it is willing to absorb in Belt and Road energy investments.
**For Venezuela**
The country may see capital return, but under conditions that trade autonomy for stability. Its oil future will be shaped externally for the foreseeable future.
---
Venezuela is no longer a passive player in global energy. It is the test case for how oil wars are fought in the 2020s.
Not with embargoes.
Not with price wars.
But with control.
And in that contest, Venezuela has become the most dangerous battlefield in the US–China oil war.[source](https://www.bloomberg.com/news/newsletters/2026-01-08/china-s-oil-giants-turn-to-beijing-as-venezuela-shock-raises-stakes?utm_source=chatgpt.com)
**Follow for [daily finance.](https://df.media/)**
Markets, geopolitics, energy, and global money moves—decoded daily.
**Categories:** Global News
**Tags:** China oil imports, commodities market, crude oil exports, energy sector analysis, energy security, geopolitical risk, global energy markets, global finance news, global oil supply, international trade tensions, macroeconomic risk, oil geopolitics, oil market volatility, oil price impact, strategic resources, US China oil war, US energy policy, Venezuela oil crisis, Venezuelan oil exports
---
### [Morgan Stanley Bitcoin ETF News, Price Impact & Outlook 2026](https://df.media/morgan-stanley-bitcoin-etf-news-price-impact-outlook/)
**Published:** January 7, 2026
**Author:** Vishnu Priya
**Excerpt:** Morgan Stanley files for Bitcoin and Solana ETFs. Bitcoin price outlook, investor impact, and what this means for crypto in 2026.
**Content:**
The world of finance is watching closely as Morgan Stanley officially files for Bitcoin and Solana exchange-traded funds (ETFs). This is not just another crypto headline. This is a major Wall Street moment that signals how seriously traditional finance is now taking digital assets.
For everyday investors, traders, and even people new to crypto, this move raises one big question:
 **what does this mean for Bitcoin prices and the future of crypto investing in 2026?**
Let’s break it down in clear, simple terms.
---
### What Exactly Did Morgan Stanley Do?
Morgan Stanley, one of the largest investment banks in the world, has filed paperwork to launch **Bitcoin and Solana ETFs**. An ETF is a financial product that lets people invest in an asset without directly owning it.
In this case, investors would be able to gain exposure to **Bitcoin and Solana** through traditional stock markets instead of crypto exchanges.
This matters because many institutions, pension funds, and conservative investors are **not allowed to buy crypto directly**. ETFs remove that barrier.
In simple words:
**Crypto just became easier and safer for big money to enter.**
---
### Why This Is a Big Deal for Bitcoin
Bitcoin has always moved based on one thing more than anything else: **demand**.
When large institutions show interest, demand usually increases. Morgan Stanley’s ETF filing sends a strong signal to the market that **Bitcoin is no longer seen as a risky experiment, but as a legitimate financial asset**.
Historically, similar ETF announcements have led to:
- Higher trading volumes
- Increased media coverage
- More retail investor interest
- Stronger long-term price support
This is why **Bitcoin price today** is one of the most searched finance terms globally.
---
### Bitcoin Price Today: What Investors Are Watching
Right now, investors are closely tracking **Bitcoin price movements** around key resistance levels. Search trends show that people are asking:
- Is Bitcoin going up today?
- Will Bitcoin hit new highs in 2026?
- Is now a good time to invest in Bitcoin?
The ETF news adds fuel to these questions.
While short-term prices may still fluctuate, the long-term narrative is becoming clearer:
**Bitcoin is moving deeper into the global financial system.**
For many investors, this is no longer about quick gains. It’s about **long-term positioning**.
---
### Why Solana Is Included and Why That Matters
Solana’s inclusion is equally important.
Solana is known for fast transactions and low costs, and it has become a favorite among developers and Web3 projects. By filing for a **Solana ETF**, Morgan Stanley is signaling that it sees value beyond just Bitcoin.
This tells the market that:
- Crypto is not a one-coin story
- Blockchain ecosystems matter
- Layer-1 networks like Solana are gaining institutional trust
This could open the door for more altcoin-based ETFs in the future.
---
### What This Means for Everyday Investors
You don’t need to be a trader or crypto expert to understand the impact.
Here’s what this means in real life:
- Crypto becomes easier to invest in through stock accounts
- More financial advisors may recommend crypto exposure
- Volatility may reduce over time as institutions enter
- Long-term confidence in digital assets increases
For people who were unsure about crypto, **ETFs provide a familiar and regulated path**.
---
### How This Could Shape Crypto Investment Trends in 2026
The timing is important. 2026 is already shaping up to be a defining year for finance.
With:
- U.S. stock markets near record highs
- Growing interest in alternative assets
- Younger investors demanding digital-first products
Crypto ETFs fit perfectly into the bigger picture.
Search data shows rising interest in:
- Crypto investment trends 2026
- Bitcoin ETF approval news
- Institutional crypto adoption
This tells us one thing clearly:
**People want clarity, safety, and access.**
ETFs deliver all three.
---
### Risks Investors Should Still Understand
Even with all the optimism, it’s important to stay grounded.
Crypto markets can still be volatile. ETF approval does not mean prices only go up. Global regulations, interest rates, and macroeconomic events still matter.
Smart investors focus on:
- Long-term strategy
- Risk management
- Avoiding hype-based decisions
Education remains key.
For real-time price tracking and market data, many investors rely on platforms like [CoinMarketCap](https://df.media/) for transparency and updates.
---
### What Happens Next?
The next steps involve regulatory review and market response. Approval timelines can vary, and market sentiment will shift as more details emerge.
What is certain is this:
**Crypto has crossed another bridge into mainstream finance.**
Morgan Stanley’s move will likely encourage other banks and asset managers to follow.
---
### Final Takeaway
This is not just crypto news. This is **finance news**.
Morgan Stanley filing for Bitcoin and Solana ETFs confirms what many investors already believed:
**Digital assets are here to stay.**
Whether you are an active investor or simply watching from the sidelines, understanding this shift is crucial.
---
[🔔 **Follow Daily Finanace News** ](https://df.media/)**for more updates on finance, crypto, markets, and global investment trends.**
For more daily finance coverage, insights, and breaking news, visit:
**Categories:** Banking
---
### [Bitcoin Price Today Crosses $92000 as Global Markets Turn Cautious](https://df.media/bitcoin-price-today-crosses-92000/)
**Published:** January 5, 2026
**Author:** Laura Anderson
**Excerpt:** Bitcoin price today rises above $92,000 as global markets grow cautious amid geopolitical uncertainty and key economic data this week.
**Content:**
**January 5, 2026**
[Bitcoin price today](https://coinmarketcap.com/currencies/bitcoin/) moved decisively above the $92,000 mark, reflecting a complex mix of cautious optimism, global risk reassessment, and renewed interest in liquid alternative assets. While the move appears modest on the surface, the underlying market dynamics reveal a deeper shift in how investors are positioning themselves amid rising geopolitical uncertainty, upcoming macroeconomic data, and changing confidence in traditional financial systems.
Unlike sharp speculative rallies of the past, this advance in Bitcoin is marked by restraint. Traders are not chasing momentum blindly. Instead, capital flows suggest a strategic reallocation driven by uncertainty rather than exuberance.
---
## Bitcoin Price Today: What Is Driving the Move?
As of early trading hours, Bitcoin rose roughly 1.1% to trade near **$92,264**, tracking strength in global technology equities and renewed interest in artificial intelligence-linked assets. Historically, Bitcoin has shown a correlation with tech sentiment, particularly during periods when innovation narratives dominate capital markets.
However, this price movement is not occurring in isolation. Investors are navigating a dense macro environment shaped by:
- Heightened geopolitical stress
- Upcoming U.S. nonfarm payrolls data
- Persistent inflation concerns
- A cautious reset following Bitcoin’s 2025 pullback
Bitcoin ended 2025 down approximately 6.4%, cooling off after reaching record highs earlier in the year. The current rebound reflects **bargain buying**, not speculative excess.
---
## Global Uncertainty Is Quietly Supporting Bitcoin
One of the less visible but structurally important drivers behind Bitcoin’s stability is growing political distrust across multiple regions. Recent geopolitical developments, including heightened U.S. involvement in Latin America, have contributed to broader concerns around sovereignty, energy security, and policy unpredictability.
While Bitcoin is not reacting to any single event, these conditions tend to push investors toward **portable, liquid, and non-sovereign assets**. This has historically benefited gold, the U.S. dollar, and increasingly, Bitcoin.
Importantly, Bitcoin is being treated less like a high-risk gamble and more like a **strategic allocation hedge** during uncertain periods.
---
## How Bitcoin Compares to Traditional Safe Havens
As global markets digested geopolitical signals, traditional safe-haven assets also strengthened:
- Gold prices climbed over 2%
- The U.S. dollar saw increased demand
- Treasury yields remained tightly watched
Bitcoin’s response fits into this broader pattern. While it does not replace gold, it increasingly complements it, especially for investors seeking digital exposure without direct sovereign risk.
This positioning explains why Bitcoin’s gains remain measured rather than explosive.
---
## Crypto Market Update: Altcoins Remain Cautious
The broader crypto market echoed Bitcoin’s tone.
- Ethereum traded flat near $3,144
- XRP posted moderate gains
- BNB, Solana, and Cardano saw limited upside
- Meme coins showed mixed performance, with Dogecoin slightly lower
This confirms that the current move is **Bitcoin-led**, not a speculative altcoin surge. Retail frenzy is absent. Institutional caution is dominant.
---
## Why Bitcoin Is Still Recovering From 2025
Despite early-2026 gains, Bitcoin is still stabilizing after a challenging second half of 2025. Several factors weighed on sentiment last year:
- Slower institutional inflows into crypto funds
- Doubts around Bitcoin treasury strategies
- Exclusion of major crypto-linked firms from key equity indexes
- A flash crash that shook retail confidence
The current recovery reflects recalibration, not hype. Investors are selectively re-entering at perceived value levels.
---
## What Investors Are Watching Next
The next major catalyst for Bitcoin price today is macroeconomic, not crypto-specific.
Markets are focused on:
- U.S. nonfarm payrolls
- Federal Reserve policy signals
- Global growth outlooks
- Political risk escalation
Any surprise in employment or inflation data could reshape risk appetite across all asset classes, including crypto.
---
## FAQs
**Why is Bitcoin price rising today?**
Bitcoin price today is rising due to cautious optimism in global markets, strength in technology stocks, and renewed interest in liquid hedging assets amid geopolitical uncertainty.
**Is Bitcoin acting like a safe haven?**
Bitcoin is increasingly viewed as a complementary hedge alongside gold and the U.S. dollar, particularly during periods of political and economic distrust.
**Does geopolitical tension affect Bitcoin prices?**
Yes. Geopolitical instability often increases demand for assets that are portable, decentralized, and liquid, indirectly supporting Bitcoin prices.
**Is this a long-term Bitcoin rally?**
Current gains appear driven by strategic repositioning rather than speculative enthusiasm. Sustainability will depend on macroeconomic data and policy signals.
**Should investors expect high volatility next?**
Yes. With key economic data and global political developments unfolding, short-term volatility remains likely.
---
## Bitcoin’s Role Is Quietly Evolving
Bitcoin price today crossing $92,000 is less about excitement and more about **positioning**. In an environment shaped by political uncertainty, cautious markets, and selective risk-taking, Bitcoin is increasingly treated as a strategic financial instrument rather than a speculative trade.
As global confidence continues to be tested, Bitcoin’s relevance in diversified portfolios is no longer theoretical. It is structural.
**[Follow Daily Finance](https://df.media/) for more updates on global markets, crypto trends, and macroeconomic insights shaping the future of money.**
**Categories:** Bitcoin (BTC), Concordium (CCD), Cryptocurrency, Ethereum (ETH), Global News
**Tags:** bitcoin price, Global Markets
---
### [FTSE 100 Hits 10000: What Investors Need to Know in 2026](https://df.media/ftse-100-crosses-10000-in-2026/)
**Published:** January 2, 2026
**Author:** Vishnu Priya
**Excerpt:** FTSE 100 crosses 10,000 points on January 2, 2026, signaling investor confidence, global portfolio opportunities, and growth in European equities.
**Content:**
**January 2, 2026**
The **FTSE 100** has officially crossed the **10000-point milestone** on **January 2, 2026**, marking a strong start to the year for European equities. For investors, fund managers, and financial advisors, this is more than a number. It signals renewed confidence in European markets and potential shifts in **global investment flows**.
Whether you are based in **Sydney, London, New York, or Singapore**, understanding what this milestone means for your portfolio is essential.
---
## **Why the FTSE 100 Milestone Matters**
The FTSE 100 is widely seen as the **pulse of European equities**, but its influence extends far beyond the UK.
**Global Confidence Indicator**
Crossing 10,000 points on **January 2, 2026** reflects **strong investor sentiment**, signaling a willingness to deploy capital in European equities after a volatile 2025.
**Capital Rotation**
Analysts see a **rotation from expensive U.S. technology stocks to European value equities**, giving global investors alternative opportunities for diversification.
**Macro Insights**
The surge reflects **robust corporate earnings, stable GDP projections, and favorable trade dynamics** in Europe.
(Source: Financial Times)
---
## **Opportunities for Australian Investors**
Australian investors can view this rally as a chance to **reassess international equity exposure**.
**Diversification**
European equities can complement domestic holdings, balancing portfolios that are heavily weighted in Australian resources or technology companies.
**Sector Focus**
Sectors driving the rally, including **financial services, consumer goods, and energy**, offer reliable income streams and growth potential.
**Currency Considerations**
Keep an eye on **GBP/AUD exchange rates**, which can influence returns when investing overseas.
---
## **Insights for Startups and Technology Investors**
Even though the FTSE 100 is dominated by large-cap companies, the rally has implications for **startups and tech-focused investors**.
**Funding Signals**
A strong equity market often translates to **increased venture funding and IPO activity**, providing new opportunities for technology startups.
**Valuation Benchmarks**
Public market performance helps guide **private valuations**, giving founders and investors clearer expectations.
**Cross-Border Strategy**
European liquidity can open doors for **startups looking to scale internationally**.
---
## **Global Implications**
For a global audience, the FTSE 100 milestone is a **barometer for macroeconomic and market trends**.
**Portfolio Benchmarking**
Investors seeking diversification beyond U.S. equities may see European markets as an attractive alternative.
**Risk Hedging**
Exposure to the FTSE 100 can **offset regional risks** in Asia or the Americas.
**Institutional Flows**
Pension funds, sovereign wealth funds, and multinational portfolios will likely adjust allocations in response to European market momentum.
---
## **Analyst Perspective**
Financial experts highlight that crossing **10,000 points** on **January 2, 2026** is not just symbolic. It reflects **real market strength**.
> “Hitting this milestone shows that investors are valuing European equities more competitively, especially compared with U.S. technology-focused portfolios. This could lead to sustained inflows and greater market liquidity throughout 2026.”
Strong dividends and resilient earnings from FTSE-listed companies continue to attract both **retail and institutional capital**, reinforcing the index’s role as a global benchmark.
---
## **Actionable Takeaways for Investors**
1. **Rebalance Portfolios** Consider adding **European equities** to reduce concentration risk.
2. **Focus on Leading Sectors** Pay attention to **financial services, energy, and consumer goods**, which are driving the rally.
3. **Manage Currency Risk** For international investors, **hedging against GBP fluctuations** can protect returns.
4. **Monitor Momentum** Early-year gains suggest opportunities, but **stay alert to market volatility and macroeconomic shifts**.
---
The FTSE 100 surpassing **10,000 points on January 2, 2026** is a globally significant milestone. It highlights **investor confidence, potential rotations into European equities, and early-year optimism** across markets.*[Source](https://timesofindia.indiatimes.com/business/international-business/uk-market-milestone-ftse-100-crosses-10000-for-first-time-global-equity-rally-carries-into-2026/articleshow/126303136.cms?utm_source=chatgpt.com)*
For **Australian investors, startup founders, and global fund managers**, this is a reminder to **revisit investment strategies, diversify globally, and identify sectors poised for growth** in 2026.
Stay ahead of market trends and insights. **[Follow Daily Finance ](https://df.media/)** for updates on **equities, crypto, global markets, and startup funding opportunities**.
**Categories:** Capital Markets, Finance, Global News
---
### [Gold Price 2025 Hits Record High as Bitcoin Holds Near $89,000: Global Market Analysis](https://df.media/gold-price-2025-bitcoin-market-analysis/)
**Published:** December 22, 2025
**Author:** Laura Anderson
**Excerpt:** Gold price 2025 surges past $4,400 per ounce while Bitcoin steadies near $89,000. Investors in US, UK, EU, India, and Gulf brace for 2026 rate cuts.
**Content:**
On **December 22, 2025**, the **gold price 2025** surged past **$4,400 per ounce**, hitting record highs as investors worldwide sought safe-haven assets amid ongoing market volatility.
At the same time, **Bitcoin remained near $89,000**, reflecting growing institutional confidence in digital currencies. These simultaneous moves highlight a global trend of portfolio diversification, with investors in the **US, UK, EU, India, and Gulf countries** increasingly balancing traditional and digital assets.
---
## Why Gold Price 2025 Is Surging
Several macroeconomic and geopolitical factors are driving the historic rise in **gold price 2025**:
1. **Geopolitical Tensions:** Conflicts and trade disputes in Europe, the Middle East, and parts of Asia have prompted global investors to move capital into safe-haven assets like gold.
2. **Inflation Concerns:** Inflation remains above central bank targets in the US, UK, EU, and India, while energy and commodity price fluctuations affect Gulf economies. Gold acts as a hedge against rising costs.
3. **Anticipated 2026 Rate Cuts:** Analysts expect central banks—including the Federal Reserve, Bank of England, European Central Bank, and Gulf central banks—to adjust interest rates in 2026. Lower or adjusted rates increase gold’s appeal as a non-yielding, stable asset.
According to Sarah Thompson, a London-based commodities strategist:
> “Gold price 2025 is reaching new heights because investors are seeking stability while preparing for central bank decisions next year. Combining gold and cryptocurrencies is now a strategic necessity.”
---
## Bitcoin Stability Amid Market Volatility
While gold climbs, **Bitcoin remains near $89,000**, showcasing resilience in a volatile market. Institutional adoption of cryptocurrencies is growing across the US, UK, EU, India, and Gulf regions. Banks and financial institutions are introducing crypto trading, custody services, and tokenized investment products, providing credibility and stability to the market.
Jonathan Reeves, a US financial analyst, notes:
> “Bitcoin and gold now complement each other in diversified portfolios. Investors can hedge against inflation with gold while capturing growth in digital assets.”
---
## Regional Market Analysis
### United States
Investors in the US are increasing allocations to gold-backed ETFs, physical bullion, and futures contracts. Bitcoin adoption is growing in retirement accounts, hedge funds, and institutional portfolios. Analysts expect continued portfolio diversification as the Fed prepares for potential 2026 rate adjustments.
### United Kingdom & European Union
In Europe, **gold price 2025** has triggered strong retail and institutional demand. London and Frankfurt are seeing increased interest in gold funds, while Bitcoin remains stable due to growing institutional confidence. European investors are carefully balancing traditional safe-haven assets with cryptocurrencies in preparation for future monetary policy shifts.
### India
In India, **24K gold trades at approximately ₹13,615 per gram (~$165 per gram)**, while **22K gold is ₹12,480 (~$151 per gram)**. Gold remains a cultural and financial cornerstone. Cryptocurrency adoption, particularly Bitcoin and Ethereum, is rising among urban investors seeking portfolio diversification and inflation protection.
### Arab & Gulf Region
In the UAE, Saudi Arabia, Qatar, and Kuwait, **gold price 2025** is trending at **$4,400 per ounce**, with increased demand for bullion, coins, and jewelry. Local investors are also embracing cryptocurrencies, with exchanges offering secure trading and institutional-grade digital asset services. Gold and Bitcoin together are shaping wealth preservation and growth strategies in the Gulf.
---
## Expert Takeaways
- **Gold Price 2025:** Investors should track global economic indicators, central bank policies, and geopolitical developments. Opportunities exist in ETFs, futures, and physical bullion.
- **Bitcoin & Crypto:** Digital assets provide high-potential growth and diversification, especially when paired with traditional safe-haven assets.
- **Diversified Portfolios:** Combining gold and Bitcoin allows investors to hedge against inflation, currency fluctuations, and geopolitical risks across regions.
---
## Outlook for 2026
Analysts predict that **gold and Bitcoin** will remain central to investment strategies as 2026 approaches. Rate decisions across the US, UK, EU, India, and Gulf countries will influence market dynamics, and investors should strategically balance exposure to both assets.
From a financial analyst perspective, this period is ideal for investors seeking **wealth protection, inflation hedging, and growth** in a diversified, globally aware portfolio. Combining **gold price 2025** with Bitcoin provides a dual approach to navigating market volatility and global economic uncertainty.
### FAQs
**1. What is the current gold price in 2025?**
As of December 22, 2025, the **gold price 2025** is trading around **$4,400 per ounce** globally, with prices varying slightly across regions such as the US, UK, EU, India, and Gulf countries.
**2. How much is 24K and 22K gold in India today?**
In India, **24K gold** is approximately **₹13,615 per gram (~$165/gram)**, and **22K gold** is around **₹12,480 (~$151/gram)**.
**3. What is the current Bitcoin price?**
Bitcoin is holding steady near **$89,000**, reflecting strong institutional confidence and global adoption.
**4. Why is the gold price 2025 rising?**
Gold is rising due to **geopolitical tensions, inflation concerns, and expectations of 2026 central bank rate cuts**. Investors use gold as a hedge against market volatility.
**5. How are Bitcoin and gold connected?**
Both gold and Bitcoin are viewed as **safe-haven assets**. Investors diversify portfolios by combining the stability of gold with the growth potential of Bitcoin.
**6. What does the gold price trend mean for investors in the Gulf region?**
Investors in UAE, Saudi Arabia, Qatar, and Kuwait are increasing allocations to gold and cryptocurrencies, balancing wealth protection with growth opportunities amid global market volatility.
**7. How should investors prepare for 2026?**
Analysts recommend diversifying portfolios across **gold, cryptocurrencies, and other assets** to hedge against potential interest rate changes and inflation in 2026.
**8. Where can I buy gold and Bitcoin safely?**
Gold can be purchased through **bullion dealers, ETFs, and jewelry stores**, while Bitcoin can be bought via **regulated crypto exchanges** in your region, including US, UK, EU, India, and Gulf countries.
---
**Stay ahead of global markets, gold prices, central bank policy, and breaking finance news.[Daily Finance](https://df.media/)**
**Categories:** Cryptocurrency, Global News, Investing
---
### [Japan Bond Yields Jump After BOJ Hike as Global Markets Signal Confidence](https://df.media/japan-bond-yields-jump-after-boj-rate-hike/)
**Published:** December 19, 2025
**Author:** Vishnu Priya
**Excerpt:** Japan bond yields surge after the Bank of Japan raises rates to a 30-year high, as U.S. and European markets respond with confidence.
**Content:**
Japan’s bond market delivered a clear message to global investors on Friday. The era of ultra-easy money is ending, and markets are ready for it.
After the Bank of Japan raised interest rates to their highest level in three decades, Japanese government bond yields surged, the yen weakened, and global markets responded not with panic, but with measured optimism. Wall Street futures pointed higher, European markets stayed steady, and Asian equities closed firmly in positive territory.
This was not just a Japan story. It was a global turning point.
### A Historic Shift in Japanese Monetary Policy
The Bank of Japan raised its short-term policy rate to 0.75 percent, marking another step away from decades of aggressive monetary stimulus. Japan’s 10-year government bond yield climbed to a 26-year high, reflecting investor expectations that further tightening lies ahead.
For years, Japan stood apart from the rest of the world, holding rates near zero while the United States and Europe tightened policy to fight inflation. That divergence shaped global capital flows, supported risk assets, and fueled carry trades funded in yen.
Friday’s move confirms that Japan is no longer an outlier.
Despite the rate hike, the yen weakened sharply, falling to around 157 per dollar. That reaction signals that investors believe Japan’s tightening cycle is still in its early stages and that fiscal stimulus from Tokyo could continue to pressure the currency in the near term.
Japanese equities took the news in stride. The Nikkei index closed up about 1 percent, suggesting investors see the policy shift as a sign of economic normalization rather than a threat to growth.
### Wall Street Looks Ahead, Not Back
In the United States, the response was constructive. Wall Street futures pointed to gains of up to 0.3 percent following a strong tech-led rally the previous session. Semiconductor stocks, boosted by standout results from Micron Technology, helped reinforce confidence that corporate earnings momentum remains intact.
Investors were also digesting fresh inflation data showing U.S. consumer prices rising at a slower pace. Headline inflation cooled to 2.7 percent, easing pressure on the Federal Reserve even as officials remain cautious about declaring victory.
Bond markets reflected that balance. The yield on the 10-year U.S. Treasury hovered near 4.15 percent, below recent highs, while expectations for a near-term rate cut remained limited. Markets are pricing patience, not urgency.
The takeaway is clear. Global markets are absorbing tighter financial conditions without losing confidence in growth.
### Europe Holds the Line
Across Europe, policymakers struck a firm but controlled tone.
The European Central Bank held interest rates steady and signaled that the easing cycle may be nearing its end. Markets now see little chance of meaningful rate cuts in 2026, reinforcing the ECB’s message that inflation risks remain a priority.
In the United Kingdom, the Bank of England cut rates, but only by a narrow margin following a close vote. Officials emphasized caution about future easing, pushing expectations for another cut further into the year.
European equities were modestly lower, with the STOXX 600 slipping slightly, but volatility remained muted. Investors appeared more focused on policy clarity than short-term market moves.
Meanwhile, European Union leaders agreed to provide Ukraine with 90 billion euros in support over the next two years. While plans to use frozen Russian assets stalled, the deal underscored Europe’s willingness to coordinate fiscal policy during a period of geopolitical uncertainty.
### Commodities Reflect a Balanced Market
Commodity markets added another layer to the global picture.
Oil prices edged higher as traders assessed the risk of supply disruptions linked to Venezuela, following comments from U.S. President Donald Trump that left the possibility of conflict on the table. Brent crude rose to around 60 dollars a barrel, while U.S. crude traded near 56 dollars.
Gold slipped slightly to about 4,322 dollars an ounce, remaining below its recent peak but still elevated by historical standards. The move suggests reduced demand for immediate safe-haven protection rather than a loss of confidence in the metal’s long-term role.
### Why This Moment Matters
The significance of the Bank of Japan’s decision extends far beyond Tokyo.
Japan has been the final anchor of ultra-loose monetary policy in the global system. As that anchor lifts, global markets must adjust to a world where liquidity is no longer unlimited and capital carries a clearer price.
So far, that adjustment has been orderly.
Stocks are holding gains. Bond yields are rising without spiking. Currencies are recalibrating, not collapsing. This is what a healthy transition looks like.
Analysts expect the Bank of Japan to continue tightening gradually, with some forecasting rates could reach 1.75 percent by 2027. The challenge for policymakers will be managing inflation without derailing growth, especially as Japan’s government prepares additional fiscal stimulus.
### The Bigger Picture
What markets are signaling today is confidence. Confidence that global growth can continue without emergency support. Confidence that policymakers are moving carefully rather than abruptly. Confidence that the post-pandemic era of extraordinary measures is giving way to something more sustainable.
Japan’s bond yields may have jumped, but global markets did not flinch.
That calm response may be the most important signal of all.
## FAQS
1.**Why did Japan bond yields jump today?**
Japan bond yields jumped after the Bank of Japan raised interest rates to their highest level in 30 years, signaling further tightening ahead.
2.**How did global markets react to the BOJ rate hike?**
Global markets remained stable. U.S. futures rose, European stocks were steady, and Asian equities gained, showing confidence rather than concern.
3.**Did the yen strengthen after the BOJ hike?**
No. The yen weakened as investors priced in expectations of additional rate increases and continued fiscal stimulus.
---
## Global markets just crossed a meaningful line.
Japan’s bond yields jumped after the Bank of Japan raised rates to a three-decade high, signaling a shift that goes far beyond Tokyo. For years, Japan anchored the world’s ultra-easy money era. That chapter is now closing.
What’s notable is how markets reacted.
US futures stayed firm.
European equities held steady.
Risk assets adjusted without panic.
That’s not turbulence. That’s confidence.
Central banks are reasserting credibility, and markets are rewarding clarity over caution. Capital is being repriced, not withdrawn. This is what a healthier global financial system actually looks like.
For investors, operators, and policy leaders, the takeaway is clear: the era of emergency support is fading, and fundamentals are back in charge.
The global money map is changing. Those who adapt early will lead the next cycle.
👉 **Stay ahead of global markets, gold prices, central bank policy, and breaking finance news. [Daily Finance](https://df.media/)**
**Categories:** Banking, Global News
**Tags:** Global Markets
---
### [UK Crypto Regulation 2025: Powerful FCA Rules Shaping Markets](https://df.media/uk-crypto-regulation-2025-powerful-fca-rules/)
**Published:** December 16, 2025
**Author:** Laura Anderson
**Content:**
---
UK Crypto Regulation 2025 \| FCA Digital Assets Framework # UK Crypto Regulation 2025: Building Institutional Trust in Digital Assets
📅 December 16, 2025 ✍️ Financial Analysis Team ⏱️ 7 min read
 The regulatory landscape for cryptocurrencies is undergoing a fundamental shift. As institutional investors and fintech firms seek clarity, the UK Financial Conduct Authority has introduced a comprehensive framework for digital assets that reflects a new approach: treating crypto as a mature financial sector requiring oversight, rather than a speculative market to be restricted.
This marks a strategic inflection point. Unlike earlier piecemeal regulations that focused on containment, UK crypto regulation 2025 prioritizes market stability, consumer protection, and sustainable growth. For global capital flows, this signals a jurisdiction willing to foster innovation within clearly defined boundaries.
## A Structured Regulatory Framework
The FCA’s approach extends beyond simple registration requirements. The framework establishes governance standards for crypto exchanges, mandatory disclosures for token listings, capital adequacy requirements for intermediaries, and oversight mechanisms for custody and staking services.
Crypto firms operating in or serving UK customers must now meet risk management standards equivalent to traditional investment firms. This convergence is deliberate—it reduces regulatory arbitrage, attracts institutional capital with confidence in operational standards, and creates a level playing field.
**Key Principle:** Regulation is increasingly viewed as a source of competitive advantage rather than constraint. Early adopters of compliant practices position themselves favorably in an environment where institutional investors demand verified standards.
## Why This Matters for Global Investors
Capital allocation decisions rest on regulatory clarity. The UK framework provides precisely that—a single regulator, transparent rules, and a clear timeline for implementation. This contrasts sharply with jurisdictions employing enforcement-led strategies or maintaining ambiguous guidance.
For international crypto operators, the UK provides a gateway to European markets with established compliance credentials. For asset allocators, the framework reduces counterparty risk through improved transparency, clearer token issuance protocols, and robust custody standards.
The result: institutional participation becomes feasible. Pension funds, family offices, and large asset managers can allocate capital to crypto strategies without the reputational risk that accompanies regulatory uncertainty.
## Consumer Protection as Foundation
The FCA’s position is explicit: regulation cannot eliminate risk, but it must ensure informed participation. The framework mandates transparent disclosures, fair marketing standards, and protection against market manipulation and insider trading.
For comprehensive information on regulatory frameworks and institutional adoption, [visit the FCA’s official website](https://www.fca.org.uk/). Crypto platforms must maintain sufficient liquid capital to execute orderly wind-downs if required. This addresses a systemic vulnerability—the sudden platform failures that previously resulted in significant retail losses. It is a structural safeguard rather than a speculative restriction.
## Business Model-Specific Rules
Rather than imposing uniform requirements, the FCA’s approach is risk-based and differentiated. Centralized exchanges face listing standards and execution controls. Staking providers must clarify reward structures, lock-up periods, and asset ownership. Decentralized finance platforms are subject to consistent risk assessment regardless of technological architecture.
This sophistication reflects understanding of operational realities. It avoids over-regulation while maintaining accountability. A risk-based framework is inherently more sustainable than bright-line rules that become obsolete as technology evolves.
## UK vs. Global Regulatory Models
**United States:** Fragmented across multiple agencies (SEC, CFTC, OCC), creating uncertainty and regulatory arbitrage opportunities for firms.
**European Union:** The MiCA framework is comprehensive but less flexible. The UK approach maintains rigor while permitting adaptive updates as technology matures.
**United Kingdom:** Single-regulator model with transparent accountability, phased implementation, and built-in review mechanisms. This balance between structure and flexibility provides strategic advantage.
## Implementation Timeline
The timeline reflects pragmatism. Consultation extends through early 2026, with final rules confirmed by mid-2026 and full implementation in 2027. This phased approach allows firms to adjust systems, governance structures, and capital allocations without market disruption.
For market participants, the message is clear: compliance planning is now a strategic priority. Organizations that begin implementation early will optimize operational efficiency and avoid compressed timelines that increase costs and errors.
## The Broader Implication
UK crypto regulation 2025 represents more than specific rules. It signals a fundamental reorientation in how governments view digital assets. Crypto is no longer treated as a speculative asset class or a regulatory problem to be solved. It is a financial system component requiring oversight, accountability, and trust.
This shift has cascading effects. As regulatory clarity accumulates, capital becomes available. As capital arrives, market infrastructure improves. As infrastructure improves, retail participation becomes safer. This virtuous cycle—clarity driving confidence driving adoption—is the regulatory strategy’s ultimate objective.
The path forward is defined: institutional confidence through regulatory clarity, consumer protection through operational safeguards, and sustainable growth through early adoption. For investors, platforms, and regulators, UK crypto regulation 2025 establishes the framework within which digital finance will mature.
### Stay Informed on Crypto Regulation & Markets
Get daily analysis on regulatory developments, market trends, and institutional adoption of digital assets.
[Follow for daily finance news](https://df.media/)
#### Financial Analysis Team
Providing institutional-grade analysis of crypto regulation, capital markets, and financial policy for professional investors and industry participants.
**Follow daily finance insights, crypto regulation updates, and global market analysis on [daily finance news](https://df.media/).**
**Categories:** Cryptocurrency, Global News
**Tags:** FCA Rules, UK Crypto Regulation 2025
---
### [JPMorgan Launches Tokenized Money-Market Fund on Ethereum](https://df.media/jpmorgan-tokenized-money-market-fund-ethereum/)
**Published:** December 15, 2025
**Author:** Laura Anderson
**Excerpt:** JPMorgan launches its first tokenized money-market fund on Ethereum, signaling growing institutional adoption of blockchain in global finance
**Content:**
**December 15, 2025**
JPMorgan Asset Management has launched its first tokenized money-market fund, marking one of the most significant steps yet by a major global bank into blockchain-based financial products.
- [A traditional product, rebuilt on blockchain](#a-traditional-product-rebuilt-on-blockchain)
- [Why JPMorgan’s timing matters](#why-jp-morgans-timing-matters)
- [Built on Ethereum, settled through JPMorgan rails](#built-on-ethereum-settled-through-jp-morgan-rails)
- [Regulatory clarity opens the door](#regulatory-clarity-opens-the-door)
- [A shift in how institutions use blockchain](#a-shift-in-how-institutions-use-blockchain)
- [The bigger picture](#the-bigger-picture)
The fund, called **My OnChain Net Yield Fund (MONY)**, is built on the Ethereum blockchain and seeded with **$100 million from JPMorgan’s own balance sheet**. It allows institutional investors to hold tokenized shares of a traditional money-market fund directly on-chain, blending conventional cash management with blockchain infrastructure.
With more than **$4 trillion in assets under management**, JPMorgan’s move signals that tokenization is shifting from pilot programs into mainstream institutional finance.
### A traditional product, rebuilt on blockchain
Money-market funds are among the most widely used low-risk investment products globally, holding an estimated **$7.7 trillion in assets**. They typically invest in short-term government securities, high-quality corporate debt, and repurchase agreements, offering liquidity and capital preservation.
MONY mirrors that structure but changes how ownership and settlement work.
Instead of traditional fund shares recorded through transfer agents, investors receive **digital tokens** representing their holdings. These tokens can be held in approved crypto wallets, with **interest accruing daily and distributions handled programmatically** through smart contracts.
Subscriptions can be made using cash or **USDC stablecoin**, with a **minimum investment of $1 million**. The fund is available to qualified institutional investors through JPMorgan’s **Morgan Money** platform.
### Why JPMorgan’s timing matters
JPMorgan is not the first asset manager to tokenize a money-market fund. BlackRock’s BUIDL fund, launched earlier, currently leads the sector by assets. Franklin Templeton and other firms have also introduced blockchain-based funds on networks such as Stellar.
What sets JPMorgan’s entry apart is scale and intent.
Unlike earlier experimental launches, MONY is positioned as a **core institutional product**, backed directly by the bank’s balance sheet and integrated into its existing liquidity management systems. Analysts see this as a signal that tokenization is moving beyond niche use cases into the infrastructure layer of capital markets.
“This is not about crypto speculation,” said one digital assets strategist at a European investment firm. “It’s about operational efficiency, settlement speed, and modernizing how cash moves.”
## Competitive Landscape: The Tokenization Race
JPMorgan joins a growing cohort of financial giants entering the tokenized money-market space:
| Institution | Fund Name | Blockchain | Assets (Approx.) |
|---|---|---|---|
| BlackRock | BUIDL | Ethereum | $500M+ |
| JPMorgan | MONY | Ethereum | $100M (seeded) |
| Franklin Templeton | FOBXX | Stellar | $360M+ |
| Fidelity | n/a | Ethereum | In development |
*[Source:](https://finance.yahoo.com/news/jpmorgan-launches-tokenized-money-market-113340187.html) Company announcements, public blockchain data*
### Built on Ethereum, settled through JPMorgan rails
The fund runs on **Ethereum’s public blockchain**, using JPMorgan’s proprietary **Kinexys Digital Assets** infrastructure. The bank says the platform has already processed billions of dollars in tokenized assets since its launch.
Settlement is handled through **JPM Coin**, JPMorgan’s internal digital payment system, allowing same-day movement between traditional bank accounts and blockchain-based assets. That bridge is considered essential for institutional adoption, where compliance, custody, and reconciliation remain critical concerns.
By using a public blockchain rather than a private ledger, JPMorgan is also aligning itself with the broader digital asset ecosystem, increasing interoperability with existing crypto infrastructure.
### Regulatory clarity opens the door
The launch comes amid improving regulatory clarity in the United States around tokenized financial instruments and digital representations of traditional assets. While rules continue to evolve, major banks appear increasingly confident that compliant blockchain products can operate within existing frameworks.
Market participants say this could encourage more asset managers, pension funds, and corporate treasuries to explore tokenized funds as alternatives to traditional cash vehicles.
In Europe and parts of Asia, regulators are also accelerating work on digital asset frameworks, suggesting that tokenized money-market funds could see broader cross-border adoption over time.
### A shift in how institutions use blockchain
For years, blockchain adoption in finance was driven largely by experimentation and limited pilots. JPMorgan’s MONY fund reflects a different phase—one focused on **practical utility rather than innovation theatre**.
Tokenized funds offer faster settlement, real-time transparency, and reduced back-office complexity. For large institutions managing liquidity across multiple jurisdictions, those efficiencies can translate into meaningful cost and time savings.
Industry observers say products like MONY could eventually compete with bank deposits, treasury bills, and even stablecoin-based yield products, especially for institutional investors seeking low-risk returns with operational flexibility.
### The bigger picture
JPMorgan’s entry into tokenized money-market funds reinforces a broader trend: blockchain is increasingly being adopted as **financial infrastructure**, not an alternative system running in parallel.
Rather than disrupting traditional finance, banks are integrating blockchain into familiar products, reshaping how assets are issued, settled, and managed quietly and at scale.
As one market analyst put it, “This is what real adoption looks like. It doesn’t shout. It just works.”
[Follow daily finance news ](https://df.media/)covering global markets, crypto, business, and institutional investing.
Stay informed with timely updates, expert analysis, and stories that move capital markets worldwide.
**Categories:** Banking, Finance
**Tags:** ethereum, JPMorgan, tokenised money
---
### [Global Daily Finance News | December 12, 2025](https://df.media/dec-12-tech-selloff-sensex-rally-fed-finance-news/)
**Published:** December 12, 2025
**Author:** Vishnu Priya
**Excerpt:** December 12, 2025: Broadcom's AI disappointment sparks tech selloff, Sensex surges 449 points, Fed resumes $40B QE as global debt hits record $346 trillion
**Content:**
*Tech Selloff Spreads, Sensex Roars, and Fed Returns to QE Amid Record Global Debt*
Wall Street’s AI revolution faced its reality check on December 12, 2025, as Broadcom’s earnings beat failed to impress investors, triggering a sharp rotation from technology stocks into value plays while Indian markets staged a dramatic comeback and the Federal Reserve quietly resumed quantitative easing. The global debt mountain reached a staggering $346 trillion, setting the stage for a more cautious investment landscape as central banks navigate divergent monetary paths.
## **The Tech Reckoning**
Broadcom became the day’s cautionary tale, with shares plummeting despite beating earnings expectations as investors questioned whether massive AI capital spending would deliver adequate returns. The disappointment rippled through US indices, leaving the Nasdaq down over 1% while the Dow Jones Industrial Average managed a fresh record at 48,704.01, powered by value stocks and financials. Oracle’s decline highlighted how concentrated AI bets could sway entire sectors, while Lululemon provided a bright spot, surging 9%+ on strong quarterly results and a $1 billion stock buyback increase.
The Federal Reserve’s actions added complexity to the narrative. While cutting rates to 3.65% for the third time in 2025, the central bank simultaneously announced it would resume net asset purchases at $40 billion monthly to address overnight lending market pressures—a move that blurred the line between easing and technical adjustments. Chicago Fed President Austan Goolsbee warned against further cuts after three consecutive reductions, suggesting the easing cycle might be nearing its end.
## **India’s Resilient Rally**
Indian markets demonstrated remarkable resilience, with the Sensex surging 449 points to reverse a three-day losing streak and the Nifty decisively reclaiming the 26,000 level. Metal stocks led the charge, with Tata Steel and Hindustan Zinc gaining up to 4% on strong global cues, while PSU insurance stocks jumped as much as 8% after the Cabinet approved 100% FDI in the insurance sector.
The Reserve Bank of India cut its repo rate to 5.25% and announced plans to inject ₹1 lakh crore through OMO purchases, while also clearing a $7 billion FX backlog and unifying exchange windows. Yet the rupee touched a historic low of 90.56 against the US dollar, reflecting persistent importer demand and foreign portfolio outflows.
Silver’s ascent added to the metal mania, with MCX futures breaching ₹2 lakh per kg for the first time, while gold reached seven-week highs.
## **Europe’s Cautious Optimism**
European markets showed measured strength, with the Stoxx 600 rising 0.5% to 581.17 as value rotation offset tech weakness. The European Central Bank prepared to quiz 110 banks on various oversight matters, while the UK’s Nationwide faced a $59 million fine for financial crime control failings. Switzerland’s SNB held rates at 0%, diverging from the global easing trend, and the Euro50 index gained 0.18% to 5,769 points.
European shares benefited from the Fed’s dovish tilt, with financials and cyclicals outperforming as investors questioned the sustainability of US tech valuations.
## **Asia-Pacific Divergence**
The region showed mixed signals. Japan’s Nikkei 225 gained 1.37% as yen weakness boosted exporters, while China’s CSI 1000 rose 1.52% on policy support. However, South Korea’s Kospi and Taiwan’s tech-heavy indices faced pressure from the global semiconductor slump.
Australia’s central bank maintained its pause as inflation showed stickiness, while New Zealand’s dollar strengthened on commodity support. Singapore benefited from capital flows seeking stability, and Hong Kong’s Hang Seng showed resilience despite mainland tech concerns.
## **Emerging Markets & Commodities**
Latin American assets rallied strongly, with regional currencies gaining 1.2% and stocks climbing 2.4% following the Fed cut. Brazil’s real led gains as the country secured $879 million in venture funding, far outpacing Nigeria’s $186 million. Brazil-Mexico free trade negotiations advanced after Mercosur authorization.
In the Middle East, UAE markets eased as oil prices slipped to $61.80 amid profit-taking, while Iraq faced an $11 billion decline in crude export revenues. African markets showed reform momentum, with Nigeria’s central bank clearing FX backlogs and Uganda rolling out market liberalization measures.
## **The Debt Supercycle & Alternatives**
The International Institute of Finance reported that global debt reached a record near $346 trillion in Q3 2025, approximately 310% of world GDP, raising concerns about leverage across both advanced and emerging economies. This backdrop fueled demand for alternative assets, with silver’s market cap briefly exceeding $3.5 trillion to surpass Microsoft as the world’s fifth-largest asset.
Bitcoin traded around $90,000 after dipping below that level on AI-related risk concerns, while gold futures climbed to seven-and-a-half-week highs. The US Dollar Index fell for a third consecutive week, hitting multi-week lows and providing tailwinds for emerging market assets.
## **Market Outlook**
As trading desks wound down for the year, the narrative was clear: the AI trade faces scrutiny, value is making a comeback, and central banks are approaching inflection points. With global debt at unprecedented levels and interest rate trajectories diverging, investors are reassessing risk across regions and sectors. The coming weeks will test whether this rotation represents a healthy rebalancing or a precursor to deeper market adjustments.
**For deeper insights on finance, crypto, and global markets, [Follow Daily Finance](https://df.media/) for daily updates.**
**Categories:** Global News
**Tags:** ai, Bitcoin, Broadcom, December 2025, Fed, Federal Reserve, Global Debt, Global Finance, Markets, QE, RBI, Sensex, Silver, Tech Selloff
---
### [Dollar Slides as Markets Absorb Softer Fed Outlook, While Swiss Franc Surge Signals Renewed Strength](https://df.media/dollar-slides-as-softer-fed-outlook-sparks/)
**Published:** December 11, 2025
**Author:** Laura Anderson
**Excerpt:** The dollar slides after a softer Fed outlook, while a strong Swiss franc surge follows the SNB rate decision. Full market insight.
**Content:**
The global currency market delivered another wave of movement today as the **dollar slides** for a second straight session, driven by a surprisingly softer **Fed outlook** and renewed confidence in the Swiss economy. Investors watched key currency pairs shift sharply as central bank signals shaped expectations for the months ahead.
The greenback remained under pressure after the Federal Reserve delivered a widely expected 25-basis-point rate cut but paired it with a far less hawkish policy tone. Markets had braced for a tougher stance, especially after recent remarks from other central banks hinting at possible rate hikes. Instead, the Fed kept its message balanced, reaffirming flexibility while pointing to a potential rate cut in 2026.
This shift immediately weighed on the dollar, sending the euro to a near two-month high at 1.1713 dollars and keeping sterling firm at 1.1338 dollars. The yen also strengthened, pushing the dollar down to 155.7 yen.
ING’s global head of markets emphasized that Chair Powell avoided locking the central bank into a pause, giving markets a softer landing than expected and pushing the **dollar slides** narrative further.
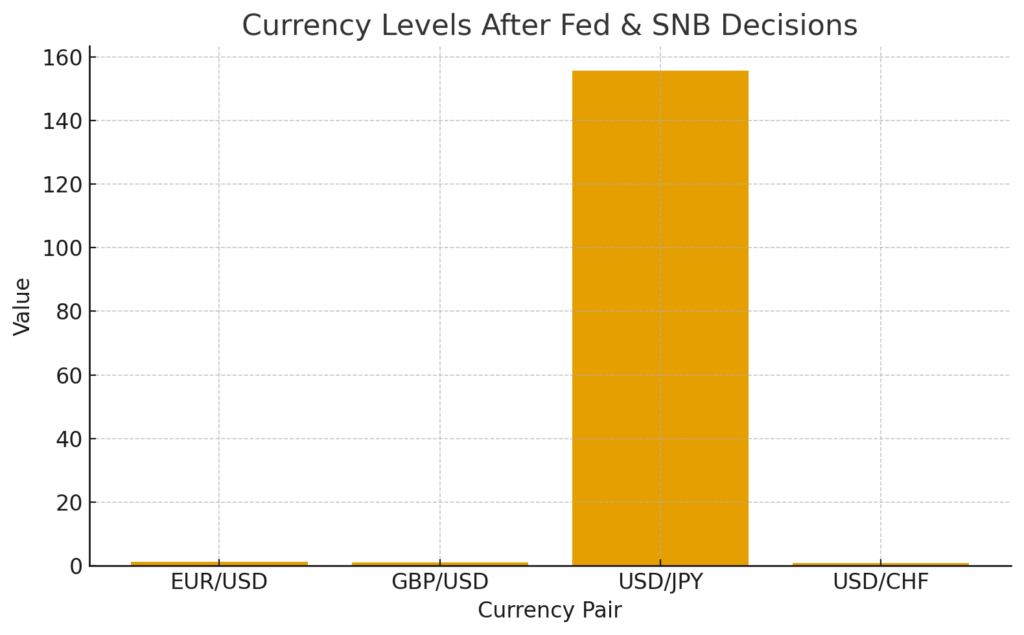Adding to the movement, the Fed announced it would begin purchasing short-dated Treasury bills on December 12, injecting 40 billion dollars into the market to stabilize liquidity. This decision further softened investor appetite for the greenback.
---
## **Swiss Franc Surge After SNB Holds Rates Steady**
The most notable move outside the U.S. came from Switzerland, where a **Swiss franc surge** followed the Swiss National Bank’s decision to keep its policy rate unchanged at zero percent. The SNB highlighted improved economic confidence tied to reduced U.S. tariffs on Swiss exports, despite inflation underperforming expectations.
The franc accelerated quickly, pushing the dollar down 0.46 percent to 0.7963 francs, its lowest point in three weeks. The euro also slipped to 0.9331 francs as the **Swiss franc surge** strengthened the currency across major pairs.
SNB chairman Martin Schlegel noted that while the stronger franc complicates inflation management, the threshold for returning to negative rates remains high.
---
## **Aussie Dollar and Crypto Retreat on Risk Concerns**
The Australian dollar weakened after November employment numbers revealed the sharpest decline in nine months. Meanwhile, global risk sentiment deteriorated after cloud-computing giant Oracle posted disappointing earnings, renewing concern that AI infrastructure investments may be outpacing returns.
Crypto assets also faced turbulence. Bitcoin briefly dipped below 90,000 dollars before recovering slightly but still ending 2.4 percent lower. Ether dropped more than 4 percent to trade near 3,200 dollars.
According to analysts, October’s excess leverage is still being unwound, making markets hypersensitive to macro signals—even with a softened **Fed outlook**.
**Categories:** Finance, Global News
**Tags:** central bank decisions, CURRENCY, currency market news, DOLLAR, Dollar slides, Fed outlook, forex analysis, Swiss franc surge
---
### [Bitcoin Short Squeeze 95000 – BTC Price Outlook 2025](https://df.media/bitcoin-short-squeeze-95000-btc-price-outlook-2025/)
**Published:** December 10, 2025
**Author:** Laura Anderson
**Excerpt:** Bitcoin short squeeze 95000 could trigger a rally or crash. Read BTC price outlook 2025 for key triggers, risks and scenarios.
**Content:**
Bitcoin is approaching a critical short squeeze threshold at 95,000. Traders and investors are watching closely. A large liquidation cluster sits just above 95,000, putting pressure on leveraged shorts. If Bitcoin breaks above 95,000 with sufficient volume, forced buy-backs could trigger a sharp rally. But with volatility still high and macro risks looming, the run-up may face stiff resistance.
## What is the 95,000 Short Squeeze Cluster?
A short squeeze occurs when the price rises against traders betting against it. Many short positions are concentrated near 95,000, forming what analysts call a liquidation cluster. Should Bitcoin cross 95,000, forced liquidations may ignite a surge, pushing BTC upward rapidly. This cluster makes the 95,000 mark a pivotal resistance zone.
## Technical Setup and Market Signals for Bitcoin
Bitcoin recently bounced back, trading near the low 90,000s. Momentum appears to be recovering as investor sentiment returns. But the 95,000 resistance remains a significant barrier. Technical indicators suggest strength, yet the medium-term trend depends heavily on volume and macro conditions.
If Bitcoin manages a clean breakout above 95,000, the path toward 100,000 becomes plausible. Without strong support, however, the rally may fizzle, or lead to a volatile correction.
## Catalysts and Risks for Bitcoin’s Near-Term Move
**Potential rally triggers:**
- A break above 95,000 on strong volume, triggering short-squeeze buying
- Renewed investor interest or institutional inflows
- Positive macroeconomic signals or easing financial conditions
**Key risks:**
- Weak macro backdrop or unfavorable global events shifting sentiment
- Thin liquidity or profit-taking among large holders
- Market hesitation if Bitcoin fails to clear 95,000 convincingly
## What This Setup Means for Traders and Investors
For traders, the 95,000 short squeeze scenario offers an opportunity for quick gains but also sharp swings. Tight risk management becomes critical. For long-term holders, this could be a moment to observe and position with caution, especially if Bitcoin manages to break 95,000 and hold above it.
## Possible Price Scenarios for Bitcoin
- **Breakout rally:** Bitcoin breaks above 95,000 → squeeze triggers → BTC could move toward 100,000 quickly
- **Range-bound consolidation:** Bitcoin remains between low 90,000s and 95,000, waiting for fresh catalysts
- **Risk-off reversal:** Negative macro news or lack of follow-through causes weakness, possibly pushing BTC back toward mid 80,000s
Bitcoin’s approach to the 95,000 short squeeze level marks a high-tension moment in the crypto market. The outcome could define the near-term trend and set tone for 2025. Whether Bitcoin surges or retreats, this is a scenario worth tracking closely. [s0urce](https://finance.yahoo.com/news/crypto-market-news-today-november-090727205.html)
**Stay tuned to [Daily Finance](https://df.media/) for timely updates, deep analysis and live coverage of BTC developments, macro signals and volatility triggers.**
**Categories:** Bitcoin (BTC), Cryptocurrency
**Tags:** Bitcoin
---
### [China Trade Surplus 2025 Hits $1 Trillion Amid Rising Global Tariffs](https://df.media/china-trade-surplus-2025-hits-1-trillion/)
**Published:** December 9, 2025
**Author:** Laura Anderson
**Excerpt:** China Trade Surplus 2025 Hits $1 Trillion Amid Global Tariffs as strong global demand offsets U.S. tariffs .
**Content:**
Historic Milestone: China’s Trade Surplus Tops $1.08 Trillion
China Trade Surplus 2025 Tops $1 Trillion — Tariff Tensions Rise # China Trade Surplus 2025 Tops $1 Trillion as Tariff Tensions Rise
By Laura — 9 December 2025 · Updated
Beijing — China’s annual goods trade surplus has exceeded US$1 trillion for the first time, driven by a sharp rebound in exports to non-U.S. markets even as shipments to the United States fell steeply. November’s export rebound and weak imports combined to push the year-to-date surplus past a historic threshold.
## Key takeaways
- **Record surplus:** Year-to-date trade surplus surpassed ~US$1.08 trillion.
- **Export rebound:** November exports rose ~5.9% year-on-year while imports rose just ~1.9%.
- **Market shift:** Exports to the EU, Southeast Asia, Australia and Latin America offset large declines to the U.S.
- **Policy pressure:** Premier Li Qiang urged global institutions to resist protectionism as tariffs rise worldwide.
## What happened — the data
Official customs releases show exports rebounded strongly in November, while imports remained muted — a combination that produced a near-record monthly surplus of roughly US$111–112 billion. The cumulative effect through November put the surplus above US$1 trillion.
“The mutually destructive consequences of tariffs are becoming increasingly apparent,” Premier Li said at the 1+10 Dialogue in Beijing, urging the IMF, World Bank and WTO to bolster global trade governance.
## Why exports rose while U.S. shipments fell
Shipments to the United States fell about 28–29% year-on-year in November amid longstanding tariffs and trade frictions. At the same time, Chinese exporters shifted volumes to the European Union, ASEAN countries, Australia and Latin America. Industry analysts describe this as a deliberate market diversification that has cushioned overall export activity.
### Analyst view
“U.S. import tariffs have diverted Chinese exports to other destinations,” says Fred Neumann, HSBC’s chief Asia-Pacific economist. Economists caution that while tariffs alter trade flows, they do not automatically correct macroeconomic imbalances such as China’s reliance on external demand.
## Global reaction and risks
Policymakers in Europe and elsewhere have voiced concern. French leaders signalled readiness to consider countermeasures, and the European Commission has been studying resilience measures in response to cheap imports. Market risks include price pressure in sectors where China has large production runs — notably EVs, solar panels, batteries and consumer electronics.
### Macro implications
A persistent surplus on this scale can influence currency expectations, change capital flows and heighten calls for trade remedies. Some economists argue that a stronger renminbi or a boost to domestic consumption would be the most durable solutions to ease external pressure — but Beijing appears focused on targeted infrastructure and production policies for now.
### Graph: China Monthly Trade Surplus & Export Growth — Jan to Nov 2025
November 2025 saw exports rise ~5.9% and a monthly surplus near $111.7bn; year-to-date surplus exceeded $1.08tn. Sources: China Customs, Reuters.
| Month | Export growth (%) | Monthly trade surplus (USD bn) |
|---|---|---|
| Jan 2025 | 2.1 | 95.3 |
| Feb 2025 | 1.8 | 92.1 |
| Mar 2025 | 3.5 | 100.5 |
| Apr 2025 | 2.9 | 98.4 |
| May 2025 | 4.2 | 105.7 |
| Jun 2025 | 3.8 | 102.3 |
| Jul 2025 | 4.5 | 108.6 |
| Aug 2025 | 3.2 | 101.9 |
| Sep 2025 | 4.0 | 106.2 |
| Oct 2025 | 3.5 | 104.1 |
| Nov 2025 | 5.9 | 111.7 |
## Policy pressures and outlook
International pressure is mounting for China to rebalance toward consumption. Analysts note that absent a material shift to boost domestic demand, export reliance will likely persist — and with it the international tensions that have prompted tariff talk and policy responses.
For a contemporaneous take on Li Qiang’s remarks and tariff consequences, see Reuters: [China’s Li says tariff consequences increasingly evident (Reuters)](https://www.reuters.com/business/finance/chinas-li-says-tariff-consequences-increasingly-evident-2025-12-09/?utm_source=chatgpt.com). Additional market context: [Bloomberg Markets](https://www.bloomberg.com/markets).
## Conclusion
China’s crossing of the US$1 trillion trade surplus threshold in 2025 is a structural signal — not a short-term blip. Export diversification has so far masked U.S. tariff impacts, but global policy choices, currency moves and potential protectionist responses will determine whether this dynamic rebalances or intensifies in 2026.
#### Want deeper trade & market analysis?
Subscribe to DAILY FINANCE for weekly briefings on global trade flows, policy shifts and market implications.
[Subscribe — DAILY FINANCE](https://df.media/)
## Frequently Asked Questions
**Why did China’s trade surplus exceed $1 trillion in 2025?** +
The surplus is the result of strong export growth to non-U.S. markets combined with relatively weak imports, reflecting continued global demand for Chinese manufactured goods and subdued domestic consumption.
**Are tariffs the main driver of this market shift?** +
Tariffs have redirected some trade flows, but they are not the only factor. Export diversification strategies, regional demand patterns and competitive pricing have all contributed.
**What sectors are most impacted by this trend?** +
Sectors most affected include electric vehicles, solar panels, batteries, semiconductors, consumer electronics and industrial machinery.
**Categories:** Global News
**Tags:** china trade, Global Tariff, trade
---
### [Global Crypto Shock: Binance Wins Abu Dhabi Mega Licenses as Crypto Markets, Blockchain Regulators, and Global Finance Take Notice](https://df.media/binance-abu-dhabi-mega-licenses-crypto-blockchain-finance/)
**Published:** December 8, 2025
**Author:** Laura Anderson
**Content:**
## **A Landmark Decision With Global Financial Ripples**
In a move sending shockwaves through **global finance**, Abu Dhabi’s top regulator has granted Binance three powerful operational licenses, allowing the world’s largest cryptocurrency exchange to expand aggressively across the Middle East. The approvals arrive at a time when **crypto markets** are battling uncertainty and **blockchain regulation** is tightening worldwide, making the UAE’s green light a breakthrough moment for the industry.
The approvals cover Binance’s **regulated exchange**, **clearing and custody infrastructure**, and **broker-dealer services**, giving the company one of its most complete regulatory frameworks in any international market.
## **Binance Strengthens Ties With the UAE’s Massive Wealth Ecosystem**
The UAE has steadily positioned itself as a global hub for digital assets, supported by its **$2 trillion sovereign wealth network**. Binance’s momentum in the region accelerated after securing a **$2 billion investment from MGX**, an AI-driven investment powerhouse chaired by Sheikh Tahnoon bin Zayed Al Nahyan.
This fresh regulatory recognition signals that Abu Dhabi intends to dominate the future of digital economies, at a time when other markets remain divided on how to regulate crypto.
## **Abu Dhabi Quietly Triples Its Bitcoin ETF Position**
Adding fuel to the story is a major strategic move by the Abu Dhabi Investment Council. New disclosures reveal the council **tripled its Bitcoin ETF holdings** during Q3, lifting its stake in BlackRock’s iShares Bitcoin Trust to nearly **8 million shares** — a position worth more than **$518 million** at the time of filing.
This investment surge occurred shortly before the global crypto bull run lost steam, suggesting the region is committed to long-term digital asset exposure regardless of short-term volatility.
## **Binance Still Dominates Global Crypto Markets**
Despite regulatory challenges across Europe, the UK, and the US, Binance remains the world’s largest exchange, holding **35 percent of global Bitcoin trading volume**, according to Kaiko.
The exchange continues expanding through acquisition as well. South Korea recently approved its long-awaited takeover of GOPAX after more than two years of regulatory scrutiny — another win for Binance’s international footprint.
## **UAE a Potential Headquarters for Binance’s Global Operations**
Co-CEO Richard Teng, a former senior executive at Abu Dhabi Global Market (ADGM), has repeatedly stated the UAE is a “high-clarity regulatory environment,” making it a strong contender for Binance’s future global headquarters.
With its new licenses, Binance can now operate a complete financial ecosystem under a single regional umbrella — something the company has not achieved in most jurisdictions.
## **Why This Matters for Global Finance and Blockchain Regulation**
Abu Dhabi’s decision comes at a critical juncture where many countries are tightening enforcement, raising compliance expectations, and scrutinizing every crypto firm’s structure. Yet, the UAE is doubling down, signalling to international markets that it aims to become a strategic, regulated safe zone for high-volume digital asset operations.
This development places pressure on regulators in Europe, Asia, and North America to revisit their approaches especially if major players begin shifting operations toward the Middle East. [Source](https://www.zawya.com/en/press-release/africa-press-releases/binance-becomes-first-crypto-exchange-to-secure-a-global-license-under-abu-dhabi-global-market-adgm-framework-n4dnp7q5)
## **A Turning Point for the Crypto Markets?**
While global financial markets remain cautious, Binance’s major regulatory win in Abu Dhabi could serve as a psychological boost for the broader industry. Institutional investors, venture funds, and blockchain startups are now watching closely to see whether other major jurisdictions may follow Abu Dhabi’s lead.
Stay informed with [Daily Finance ](https://df.media/) for sharp global finance reporting that cuts through noise and tracks real-world shifts shaping capital, energy, and commodity markets.
**Categories:** Cryptocurrency, Global News
**Tags:** Crypto Markets
---
### [Japan’s Bond Market Faces a New Reality: Yields Reach Highest Levels in Years](https://df.media/japan-bond-yields-2025-surge-to-multi-year-highs/)
**Published:** December 4, 2025
**Author:** Laura Anderson
**Content:**
- [Why Japan Bond Yields 2025 Are Surging to Multi-Year Highs](#why-japan-bond-yields-2025-are-surging-to-multi-year-highs)
- [BOJ Policy Expectations Push Japan Bond Yields 2025 Higher](#boj-policy-expectations-push-japan-bond-yields-2025-higher)
- [Government Spending Plans Add New Pressure](#government-spending-plans-add-new-pressure)
- [Global Investors Rebalance as Japanese Yields Shift](#global-investors-rebalance-as-japanese-yields-shift)
- [Currency Markets Prepare for Yen Strength](#currency-markets-prepare-for-yen-strength)
- [Investor Focus: What Happens Next](#investor-focus-what-happens-next)
# Why Japan Bond Yields 2025 Are Surging to Multi-Year Highs
Japan’s bond market is entering a pivotal moment as **Japan bond yields 2025** climb to their highest point in years, triggering fresh concerns across global financial markets. Investors are repositioning quickly as expectations of central bank action and rising government spending reshape the long-term outlook.
The move is not an isolated event. It reflects a deeper shift in how global capital is moving, how foreign bond markets are pricing risk, and how currency markets are preparing for potential volatility.
---
## **BOJ Policy Expectations Push Japan Bond Yields 2025 Higher**
The Bank of Japan is at the center of the market’s repricing. After years of ultra-low interest rates, the landscape is shifting. Inflation is holding steady, wage pressures are visible, and policymakers are signaling an environment that no longer justifies near-zero rates.
Investors are betting that rate adjustments are coming. That expectation alone is lifting **Japan bond yields 2025**, especially on long-dated bonds that are sensitive to policy direction.
For background on BOJ policy history, see the Bank of Japan’s official releases (external resource).
---
## **Government Spending Plans Add New Pressure**
Alongside policy tightening expectations, Japan’s expanding fiscal plans are raising fresh questions.
New spending priorities in defense, infrastructure, and economic security initiatives are increasing the country’s long-term borrowing needs.
This combination of policy normalization and higher fiscal commitments is pushing demand for higher returns. As a result, **Japan bond yields 2025** are trending upward far faster than seen in previous cycles.
For comparison, similar fiscal-driven yield movements were observed in the US market in 2023 (linking out to an external news resource).
---
## **Global Investors Rebalance as Japanese Yields Shift**
Japan is one of the largest global capital exporters. When domestic yields rise, international investors often reduce exposure to foreign bonds and shift capital back into Japanese government securities.
This movement can tighten liquidity worldwide, impacting:
• US Treasuries
• UK Gilts
• European sovereign debt
If **Japan bond yields 2025** continue rising, global investors may see parallel upward pressure across major bond markets.
## **Currency Markets Prepare for Yen Strength**
Currency strategists are monitoring the yen closely. Rising yields typically strengthen a currency, and **Japan bond yields 2025** are now high enough to get global FX desks repositioning.
A stronger yen could influence export competitiveness, corporate earnings, and Asia-Pacific market flows.
This is why currency markets treat Japanese yield movements as a forward signal. [source](https://www.moneycontrol.com/news/business/markets/japan-s-30-year-government-bond-yield-surges-to-a-record-3-43-amidst-concerns-of-possible-rate-hike-13709247.html)
---
## **Investor Focus: What Happens Next**
The next major triggers for the market include:
• The Bank of Japan’s upcoming policy statement
• The release of updated government spending frameworks
• External macro data such as US inflation and global rate decisions
Any shift in guidance may accelerate or slow the rise in **Japan bond yields 2025**.
Investors, asset managers, and corporate finance teams are now adapting strategies to stay aligned with this fast-moving environment
Stay informed with [Daily Finance ](https://df.media/) for sharp global finance reporting that cuts through noise and tracks real-world shifts shaping capital, energy, and commodity markets.
**Categories:** Finance
---
### [Global Debt Crisis Deepens as Growth Slows Worldwide](https://df.media/global-debt-crisis-deepens-as-growth-slows-worldwide/)
**Published:** December 3, 2025
**Author:** Laura Anderson
**Excerpt:** Developing nations face a historic $741B net debt outflow as UNCTAD warns global growth will slow to 2.6 percent through 2026.
**Content:**
# Debt Crisis 2025
**Dec 3, 2025 — Global Markets Desk**
Two major economic assessments released this week offer a sobering view of where the global economy is heading. Both point to a world where growth is slowing, investment flows are shifting, and the **developing nation debt crisis 2025** is becoming one of the most urgent challenges facing policymakers. What is emerging is not just another temporary setback, but a structural turning point that will shape the next decade of global development, trade, and financial stability.
---
## **Developing Nation Debt Crisis 2025 Accelerates**
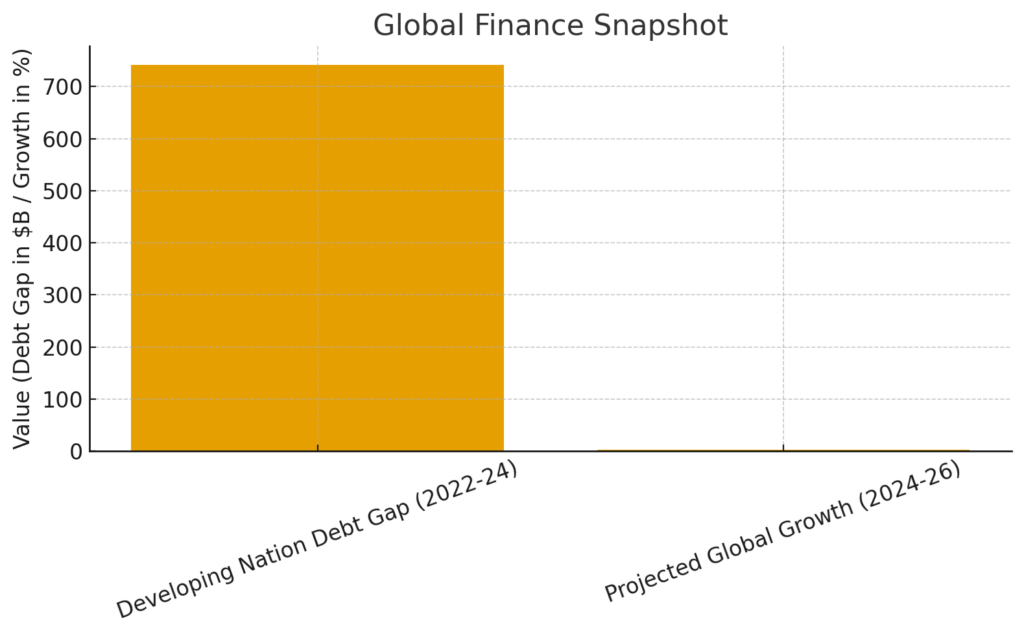### **A Historic Outflow Raises Red Flags**
According to a new World Bank report, developing countries paid **$741 billion more** in principal and interest than they received in fresh financing between **2022 and 2024**. That figure represents the largest negative net flow in **five decades**, and it signals a dramatic reversal in global capital movement.
Historically, emerging markets relied on steady inflows to fund infrastructure, healthcare, education, and industrial growth. But today’s reality looks very different. With global interest rates rising and risk appetite falling, many developing nations are struggling to refinance debt and attract foreign capital.
The World Bank warns that this reversal is not an accident but the result of a structural shift: global liquidity has tightened, foreign investors are more cautious, and external borrowing has become significantly more expensive.
### **Understanding the Pressure Behind the Outflow**
Much of the strain comes from aggressive rate hikes in advanced economies, particularly the U.S. and Europe. When the Federal Reserve and the European Central Bank kept rates high to cool inflation, the cost of borrowing for emerging markets climbed in tandem. Investors moved toward dollar-denominated assets, leaving many developing nations facing higher repayment costs and weaker currency positions.
These countries are also contending with lower export revenues, fragile post-pandemic recovery, and rising geopolitical risks. The combination makes it difficult to build foreign reserves or support local development agendas. Instead of expanding their economies, governments are being forced to cut spending, delay projects, or take on emergency loans at unattractive terms.
This dynamic is at the heart of the **developing nation debt crisis 2025**, and for many countries, the situation is moving toward a breaking point.
### **A Growing Push for Debt Restructuring**
International institutions are urging governments and lenders to adopt more coordinated debt-restructuring frameworks. Without faster action, the risk of defaults could rise, particularly among frontier markets with limited fiscal space.
Several countries are expected to approach the IMF over the next year, seeking extended maturities, grace periods, or alternative financing. But IMF programs come with conditions that can be politically sensitive, such as subsidy cuts or tax reforms. Balancing economic stability with social welfare will become a major political challenge across Africa, South Asia, and Latin America.
Economists say that unless global rates fall sooner than expected, the **developing nation debt crisis 2025** could morph into a broader financial shock — one that affects trade, investment flows, and cross-border lending for years to come.
---
## **Global Growth Outlook Turns Soft**
### **UNCTAD Warns of a Prolonged Global Slowdown**
Adding to the concerns raised by the World Bank, UNCTAD issued a separate projection showing global economic growth averaging **2.6 percent through 2026**. That is markedly below the pre-pandemic average and signals a world entering a more cautious phase of expansion.
UNCTAD describes the current slowdown as both cyclical and structural. While higher interest rates are weighing on near-term growth, deeper issues such as geopolitical fragmentation, slow productivity gains, and declining global trade intensity are reshaping the global economy.
### **Why Growth Is Losing Momentum Worldwide**
[UNCTAD highlighted several trends ](https://unctad.org/publication/world-of-debt)that are expected to keep growth subdued:
**1. Tight monetary policy is still working its way through economies.**
Even as inflation eases, the lagged impact of higher borrowing costs is suppressing consumer spending and business investment.
**2. Supply chains remain fragmented.**
Tensions across regions — from Europe to East Asia — have pushed companies to rethink sourcing and production, often resulting in higher costs and slower logistics.
**3. Investment sentiment remains weak.**
Companies are holding back on major capital expenditure, waiting for more stable economic signals.
**4. Global trade volumes are falling.**
Export-driven regions such as China, South Korea, and several EU economies are feeling the pressure from weaker demand.
Together, these forces paint a picture of an economy that is expanding, but at a slower and less stable pace.
### **Implications for Corporates, Investors, and Policymakers**
Companies may need to prepare for slower revenue cycles, tighter margins, and more conservative capital planning. Many firms are expected to prioritize technology investments — especially AI and automation — that can boost efficiency despite limited growth environments.
Investors are likely to shift toward **resilient, defensive sectors**, including healthcare, essential consumer goods, infrastructure, and energy transition technologies. Long-duration assets may come under pressure until clarity emerges on central-bank rate paths.
For governments, the coming years will require a delicate balance between supporting growth and maintaining fiscal discipline. With central banks nearing their limits on monetary easing, more responsibility may fall on **targeted fiscal interventions**.
Stay informed with [Daily Finance ](https://df.media/) for sharp global finance reporting that cuts through noise and tracks real-world shifts shaping capital, energy, and commodity markets.
**Categories:** Global News
---
### [Federal Reserve Rate Cut Odds Jump as Markets Rally Worldwide](https://df.media/fed-rate-cut-odds-surge-as-global-markets-rally/)
**Published:** November 27, 2025
**Author:** Vishnu Priya
**Content:**
Global Markets Rally: Fed Rate Cut Odds Surge \| DF Media Breaking Market News# Fed Rate Cut Odds Surge: Global Markets Ignite Rally
### Market Briefing: Key Topics
- [📉 Market Sentiment Turns Risk-On](#sentiment)
- [🌍 Global Equities Respond](#equities)
- [🚀 Crypto Markets Follow the Macro Shift](#crypto)
- [📊 Macro Indicators Reinforce Optimism](#macro)
- [💡 Investor Strategy for the Week](#strategy)
The tone across global **daily finance** coverage shifted sharply today as markets recalibrated around rising expectations of a December Federal Reserve rate cut.
Traders increased their probability models to reflect the likelihood of easing, and the sentiment injection rippled across equities, crypto, and commodities. The market is now entering a period defined by **accelerating risk appetite** and strategic repositioning heading into month-end flows.
## Market Sentiment Turns Risk-On
The shift in expectations is reshaping intraday behavior across institutional desks. As softer inflation readings aligned with stronger employment data, the market’s conviction strengthened that a more accommodative policy path is approaching. The move pushed **Treasury yields sharply lower**, with the 10-year benchmark slipping below four percent. This provided immediate relief to long-duration assets and increased appetite for growth-focused allocations.
## Global Equities Respond
The equity landscape reflected this mood reset. US indices extended multi-session gains, powered by large-cap technology and sectors sensitive to rate movements. European markets paused after a strong rally but maintained supportive sentiment. Asian markets continued their upward trend, especially Japan and India, both benefiting from liquidity tailwinds. These synchronized moves illustrate how **daily finance** flows react quickly to macro signals.
Investors tracking cross-asset performance are now raising their exposure to AI, digital infrastructure, and semiconductors, which historically outperform during early-rate-cut cycles. Strategists note that bullish momentum could extend over the next several sessions as positioning realigns with updated policy forecasts.
## Crypto Markets Follow the Macro Shift
Crypto assets mirrored the traditional markets. **Bitcoin reclaimed the 91,000 level**, while Ethereum crossed 3,000 with strong volume support. Altcoins demonstrated synchronized strength, benefiting from the broader risk-on environment. Institutional flows are re-entering at a steady pace, driven partially by the improved macro backdrop and ETF activity.
An interesting development in today’s **daily finance** stream was the strengthening link between crypto performance and central bank expectations. As rate-cut narratives advance, digital assets tend to rally, reflecting increased liquidity potential across speculative segments.
## Macro Indicators Reinforce Optimism
US jobless claims declined to a seven-month low, adding confidence to the market’s interpretation of economic resilience. Meanwhile, Turkey’s Economic Confidence Index reached its strongest level since March, signaling broad-based improvements across consumer and industrial sectors. Commodities presented a mixed picture, with Brent crude slightly lower and natural gas edging higher.
For deeper reference, today’s key macro highlight includes the analysis [Gold Holds Elevated Levels as Fed Rate Cut Expectations Deepen](https://www.investing.com/analysis/gold-holds-elevated-levels-as-fed-rate-cut-expectations-deepen-200670899), offering additional context around commodity behavior during Fed policy shifts.
## Investor Strategy for the Week
Portfolio managers are now positioning with greater precision, increasing exposure to technology, financials, and corporate credit while maintaining disciplined risk controls. Retail investors are encouraged to track macro indicators closely and avoid short-term emotional decisions during this transitional phase. Market structure dynamics indicate that the next few sessions could produce elevated volatility but also present attractive opportunities.
For continued insights across global markets, visit our internal resource hub at [Click Here for more Insights](https://df.media/).
**Follow Daily Finance for the latest Market updates and Finance News** Get the signals before the market moves.
[Visit Daily Finance](https://df.media/)
**Categories:** Banking
---
### [Bitcoin Dips Under $86,000 as Crypto Market Faces Leverage Flush-Out](https://df.media/daily-finance-news-5-shocking-crypto-moves-today/)
**Published:** December 1, 2025
**Author:** Vishnu Priya
**Excerpt:** Daily Finance explains why Bitcoin dipped under $86,000, how a crypto leverage flush-out hit market cap, and what traders should watch next.
**Content:**
## 📉 Bitcoin & Crypto Market Overview – Dec 1, 2025
**Bitcoin Performance**
- Bitcoin fell nearly **6% in 24 hours**, trading below **$86,000** (at $85,778), after holding around $91,000 last week.
- November saw Bitcoin lose **16.7%** from its recent all-time high of **$126,251**.
**Altcoins Performance**
- Ethereum declined **5.85%**, trading at $2,814.
- Other major altcoins (XRP, BNB, Solana, Cardano, Tron, Dogecoin, Hyperliquid) fell over **10%**, contributing to a total crypto market capitalization drop of **4.82% to $2.94 trillion**.
**Market Drivers & Analysis**
- **Leverage flush-out**: Over $140 billion wiped from the crypto market due to liquidation of leveraged positions.
- **Macro factors**: Rising US jobless claims (1.96M) increased expectations of an expansionary Fed, adding downward pressure.
- **Technical levels**: Bitcoin broke below key support at $89,500; potential short-term retests at $85,500 or $82,000.
- **Liquidity tailwinds**: A weakening US dollar may provide support for BTC accumulation in uncertain macro conditions.
**Expert Commentary**
- **CoinDCX Research Team**: Highlights China’s continued crypto crackdown and stablecoin warnings, contributing to bearish sentiment.
- **Delta Exchange Analyst Riya Sehgal**: Emphasizes panic-driven liquidations ($300M in leveraged longs wiped out) but notes this is likely a temporary structural flush-out.
- **ZebPay Head of Trade Harish Vatnani**: Reports over 180,000 traders affected by $539M in liquidations, mostly in long BTC and ETH positions.
**Key Takeaway**
- Despite the sharp drop, experts suggest this is more of a **leverage-driven correction** than a fundamental market breakdown. Bitcoin could stabilize and attempt to reclaim the $90,000–$92,000 range once excess leverage clears.
Bitcoin and the broader crypto market have been sliding steadily since late November, with a sharp acceleration on December 1 driven by risk-off sentiment and a leverage flush-out that erased billions in market capitalization. The chart of Bitcoin price vs total crypto market cap from November 25 to December 1 shows both lines trending down together, underlining Bitcoin’s dominant influence on overall crypto valuation.
Bitcoin price and total crypto market capitalization declined steadily in the week leading up to the sharp Dec 1, 2025 sell-off
## Chart insight: price and cap move together
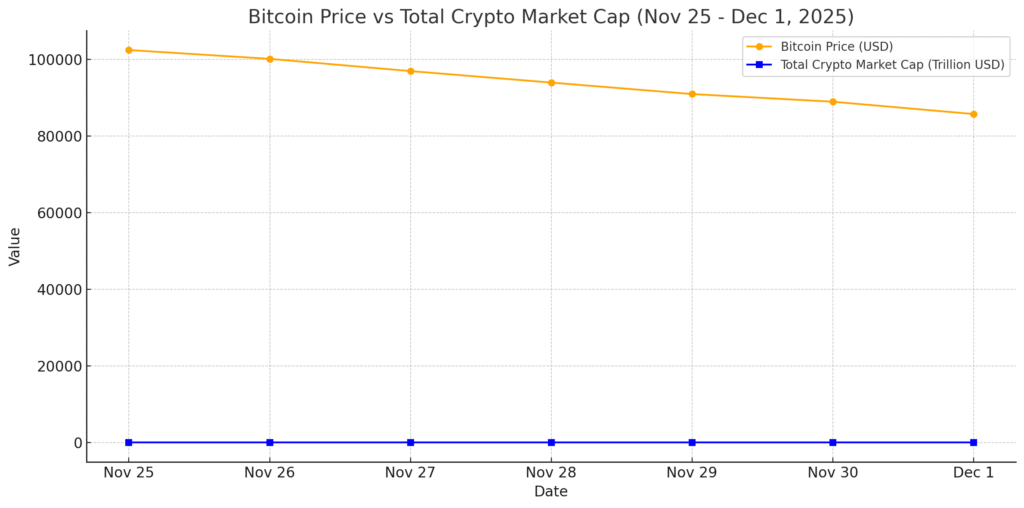The line chart “Bitcoin Price vs Total Crypto Market Cap (Nov 25 –Dec 1, 2025)” visualizes how Bitcoin fell from about 102,500102,500 USD on November 25 to 85,77885,778 USD on December 1, while total crypto market cap dropped from roughly 3.40 trillion USD to 2.94 trillion USD in the same period. The steepest joint decline occurs on December 1, matching reports of a nearly 6% intraday Bitcoin drop and a market-wide sell-off.
Bitcoin price and total crypto market capitalization declined steadily in the week leading up to the sharp Dec 1, 2025 sell-off
This parallel movement reinforces that Bitcoin still acts as the primary driver of crypto market sentiment, with its drawdowns closely mirrored by aggregate capitalization. When leveraged long positions in Bitcoin unwind, liquidity is pulled from the entire ecosystem, dragging altcoins and the total market cap lower in tandem.
## What drove the December 1 flush-out
On December 1, Bitcoin slipped below the 86,000 USD mark after trading near 91,000 USD the previous week, while global crypto market capitalization fell to around 2.94 trillion USD. Reporting attributes this move to a combination of heavy liquidations, weakening technical support levels, and a broader risk-off shift among investors.
Bitcoin price and total crypto market capitalization declined steadily in the week leading up to the sharp Dec 1, 2025 sell-off
Analysts quoted in the coverage describe the event as a leverage flush-out rather than a structural breakdown, noting that roughly 140 billion USD in crypto market value was wiped as overextended positions were cleared. This interpretation aligns with the chart’s pattern: a steady week-long slide followed by a sharper capitulation day, a structure often seen in de-leveraging phases that can later pave the way for stabilization if macro conditions improve.
## Unlock deeper insights with DF Media
Stay ahead of market momentum with stories that shape tomorrow’s business landscape. Elevate your strategy, accelerate growth, and access perspective that moves industries forward.
[ Explore DF Media Now ](https://df.media/)
##
**Categories:** Cryptocurrency, Global News
**Tags:** Bitcoin, Crypto Market
---
### [G20 Shifts Focus as U.S. Assumes Presidency: Debt, De-Dollarization and Global Stakes](https://df.media/u-s-presidency-emerging-debt-de-dollarization-g20-2025/)
**Published:** November 24, 2025
**Author:** Laura Anderson
**Excerpt:** U.S. takes G20 presidency from South Africa, facing record-high emerging market debt and global de-dollarization discussions.
**Content:**
G20 Shifts Focus as U.S. Assumes Presidency: Debt, De-Dollarization and Global Stakes # G20 Shifts Focus as U.S. Assumes Presidency: Debt, De-Dollarization and Global Stakes
The G20 has entered a new chapter as South Africa officially handed over the presidency to the United States. Global attention is now on how the U.S. will steer discussions on pressing economic challenges. Emerging economies are facing record-high debt levels while debates around de-dollarization, the effort to reduce reliance on the U.S. dollar, are intensifying. How the G20 under American leadership addresses these issues could reshape the global financial landscape.
## The Debt Challenge in Emerging Economies
Emerging markets are struggling with unprecedented debt levels, worsened by interest rate increases, supply chain disruptions and inflation pressures. Analysts warn that without coordinated action from global powers, many nations could face serious financial strain.
The U.S. now faces the task of proposing solutions that balance fiscal responsibility with the development needs of these countries. Discussions are expected to focus on debt restructuring, international financial assistance and sustainable financing.
## De-Dollarization and Global Implications
De-dollarization has moved from theory to action in recent years. Countries including China and Russia have taken steps to reduce their reliance on the U.S. dollar in trade and reserves. The G20 under U.S. leadership will need to address how to maintain confidence in the dollar while responding to legitimate calls for more diversified financial systems.
The results of these discussions could influence trade agreements, currency policies and investment flows with ripple effects for both emerging and developed markets.
## Emerging Market Debt Table 2025
Data sourced from [RBI](https://rbi.org.in/Scripts/PublicationsView.aspx?id=22725), [Reuters](https://www.reuters.com/world/americas/brazils-gross-debt-hits-762-gdp-february-amid-high-interest-costs-2025-04-08/), and [Trading Economics](https://tradingeconomics.com/mexico/government-debt-to-gdp).
| Country | Public Debt / GDP (%) |
|---|---|
| India | 81.8% |
| Brazil | 76.2% |
| South Africa | 77.9% |
| Indonesia | 40.8% |
| Mexico | 53% |
## U.S. Leadership and Global Expectations
The U.S. presidency brings both opportunities and scrutiny. Investors and policymakers will watch closely to see whether American-led initiatives can provide relief to heavily indebted economies while maintaining stability in the international financial system.
The U.S. will also need to build consensus among G20 members, balancing the interests of emerging economies, European nations and Asian stakeholders. Success could reinforce U.S. influence in global finance. Missteps could accelerate moves toward alternative economic structures.
## Key Areas to Watch
- Debt relief initiatives for emerging economies
- Currency diversification and de-dollarization efforts
- Global economic stability and market reactions to U.S.-led proposals
## FAQs
**What does the G20 presidency do?** The presidency sets the agenda for the year and guides discussions and action plans among the 20 major economies.
**Why is emerging market debt a concern?** High debt limits countries’ ability to invest in growth and can lead to financial instability if not managed collaboratively.
**What is de-dollarization and why does it matter?** De-dollarization is the process of reducing reliance on the U.S. dollar in trade and reserves. It affects global currency dynamics and U.S. financial influence.
**How long is the U.S. G20 presidency?** The presidency lasts one year. During this time, the host country leads discussions and hosts key meetings.
[Follow DF Media for More Information](https://df.media/)
**Categories:** Global News
**Tags:** De-Dollarization, G20
---
### [Global Markets Are Cracking Under AI Bubble Fears as Bitcoin Crashes to Seven-Month Low](https://df.media/global-markets-crack-on-ai-bubble-fears-as-bitcoin-falls/)
**Published:** November 21, 2025
**Author:** Vishnu Priya
**Excerpt:** Global markets slide as AI bubble fears concerns rise and Bitcoin hits a seven-month low. Investors brace for volatility amid tech selloffs
**Content:**
Global markets are experiencing a fresh wave of turbulence this week as concerns over an emerging AI bubble send shockwaves across equities and crypto. Investors who spent much of the year piling into tech are beginning to feel the weight of overheated sentiment. And with Bitcoin dropping to a seven-month low, the anxiety is cascading across almost every risk asset.
---
## **AI Euphoria Begins to Cool as Valuation Fears Intensify**
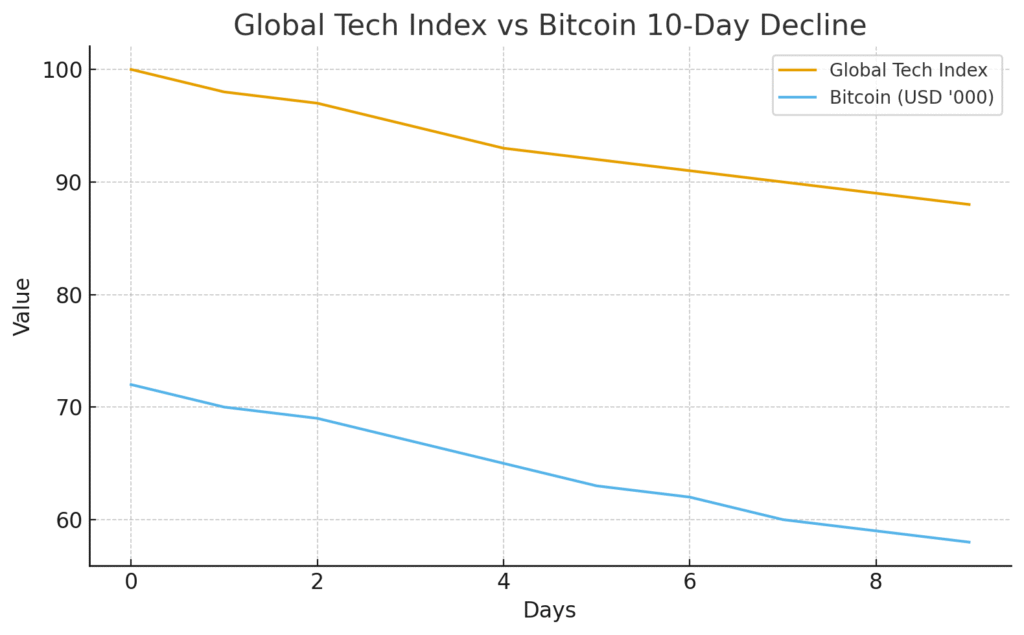Global Tech Index and Bitcoin both show a steady 10-day decline, signaling rising investor anxiety over an overheating AI market and weakening crypto sentiment.The shift is sudden but not entirely unexpected. For nearly two years, heavy capital inflows into AI infrastructure created record-high valuations for chipmakers and cloud providers. The enthusiasm was powerful, often irrational, and almost immune to weak macro indicators. Now even mild signals that AI spending may be peaking are enough to spark aggressive selloffs.
---
## **Tech Markets in the US and Asia Take the Biggest Hit**
Global indices have been reflecting this tension. Tech-heavy markets in the United States and Asia recorded broad declines as traders pulled back from high-multiple stocks. Analysts note that investors are reassessing whether the current pace of AI investments is sustainable. Some are drawing parallels to the early 2000s dot-com era, a time when hype pushed valuations far beyond fundamentals.
---
## **Bitcoin’s Seven-Month Low Signals Rising Liquidity Stress**
Bitcoin’s fall adds another layer of pressure. Dropping to its lowest point in seven months, the world’s largest cryptocurrency shows how quickly sentiment shifts when global liquidity tightens. Crypto markets, often a mirror of tech-sector volatility, are responding sharply to the AI-driven market turbulence.
---
## **Investors Confront the Reality of Slowing AI Spending**
At the core of current volatility is a simple concern: valuation discomfort. Some large enterprises have reportedly paused or slowed AI infrastructure spending, raising fears that early 2025 earnings may fail to meet expectations. Even if temporary, such signals shift global risk appetite fast.
---
## **Risk Sentiment Weakens Despite Strong Long-Term AI Fundamentals**
From a macro perspective, the downturn isn’t tied to collapsing fundamentals. Instead, it’s driven by the volatility of expectations. Central banks remain conservative, and geopolitical tensions continue to hover. Combined with profit-taking behavior after a year of oversized gains, the drop becomes easier to rationalize.
Still, long-term optimism for AI remains. Analysts argue that short-term corrections prevent unhealthy overheating and ultimately support healthier growth cycles.
---
## **Crypto Traders Brace for Institutional Dip-Buying Opportunities**
For Bitcoin, analysts believe the decline could trigger institutional buying at favorable entry points. ETF inflows, regulatory updates, and liquidity cycles remain the biggest drivers of long-term crypto performance. This week’s drop, though sharp, fits within Bitcoin’s historical volatility norms.
---
## **What Traders Will Watch Next**
Looking ahead, all eyes are on corporate earnings releases, cloud spending guidance, chip supply updates, and AI capex disclosures. Strong confirmations could quickly reverse the current downturn. Weak numbers, however, may amplify caution across equities and crypto.
For now, markets are adjusting. Investors are recalibrating. And the world is watching whether this becomes a temporary correction or an early pressure test for the AI boom.
## **Most Asked Questions**
**1. Why are global markets falling?**
Because AI spending concerns are fueling valuation stress across tech.
**2. Why did Bitcoin drop to a seven-month low?**
Crypto is mirroring tech volatility amid tightening liquidity.
**3. Is an AI bubble forming?**
No official signs, but investor behavior hints at early caution.
**4. Will tech stocks recover?**
A rebound depends on upcoming earnings and cloud spending forecasts.
**5. Should investors worry about long-term risks?**
Most analysts still argue AI fundamentals remain strong
**RELATED POST**
> [First U.S. Spot XRP ETF Goes Live](https://df.media/first-u-s-spot-xrp-etf-goes-live/)
**Categories:** Bitcoin (BTC), Cryptocurrency
**Tags:** AI BUBBLE, Bitcoin
---
### [Japan’s Economy on Edge: China Travel Ban Could Slash $13 Billion in Tourism Revenue](https://df.media/japan-economy-on-edge-china-travel-ban-hits-tourism/)
**Published:** November 18, 2025
**Author:** Laura Anderson
**Excerpt:** China’s travel ban threatens Japan’s fragile 2025 GDP, risking $13B in tourism revenue and impacting Asian financial markets.
**Content:**
Japan’s economy is teetering on the edge as a fresh diplomatic spat with China threatens to erode one of its most critical growth drivers: tourism. With Chinese visitors accounting for nearly a quarter of all foreign arrivals in 2025, the newly issued travel advisory could slash as much as $13 billion in tourism revenue, analysts warn.
The move comes amid an already fragile economic recovery, with Japan’s Q3 GDP contracting 0.4% sequentially the first decline in six quarters and global investors watching closely for ripple effects across Asian financial markets.
---
### **Dynamic Body Content**
#### **Historic Context & Precedents**
Past diplomatic disputes have shown how geopolitics can directly impact Japan’s economy. The 2012 Senkaku-Diaoyu dispute caused an 8% drop in Chinese tourists, hitting tourism-dependent sectors like airlines, hotels, and retail. Similarly, South Korea’s 2016 THAAD incident triggered a “soft ban” from China, disrupting trade and entertainment industries. Experts caution that history could repeat itself if tensions persist.
#### **Current Developments**
- **Diplomatic Trigger:** Japanese Prime Minister Sanae Takaichi’s comments on Taiwan prompted China to advise against travel to Japan.
- **Tourism Impact:** Mainland Chinese visitors, roughly 5.7 million this year, represent 23% of foreign tourists. A halving of arrivals could reduce GDP growth by 0.2 percentage points.
- **Stock Market Reaction:** Tourism-exposed stocks have already taken a hit, with investors wary of prolonged tensions.
**Micro-analysis:** Japan’s economy relies on tourism to boost domestic consumption, and even minor declines can reverberate through retail, hospitality, and transportation sectors.
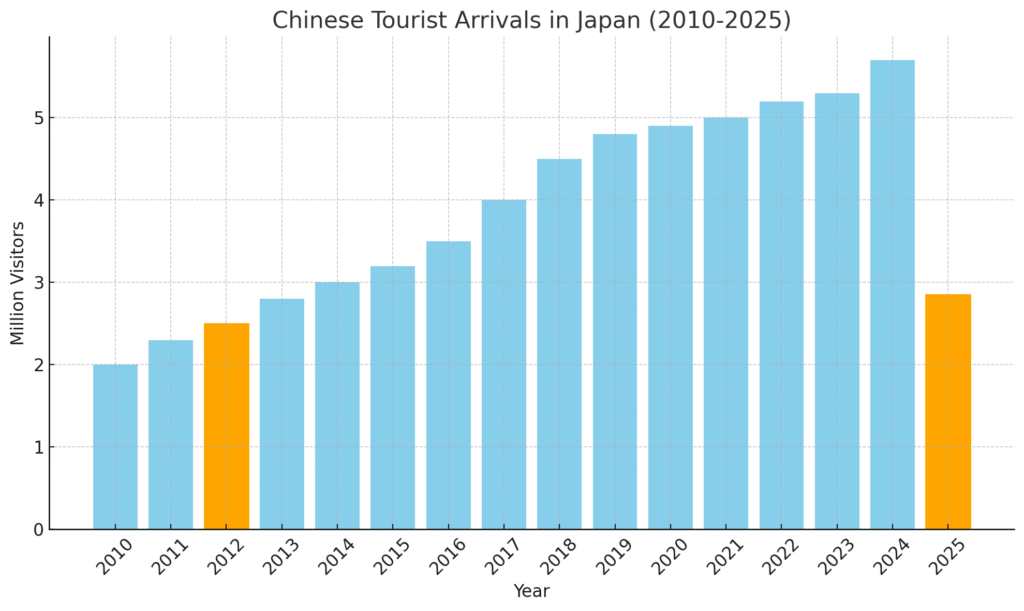Here’s **Chart 1: Chinese Tourist Arrivals in Japan (2010–2025)**.
- **Orange bars** highlight key years: **2012** (Senkaku dispute) and **2025** (current year, projected drop if travel ban persists).
- Visitors are in **millions**, showing both historical trends and potential future decline.
**Micro-insight:** The current diplomatic spat could extend for months, and with Japanese tourism already a fragile pillar of economic recovery, the stakes are high.
Japan faces a critical test of economic resilience. With tourism revenue poised to drop dramatically, the ripple effects could touch every corner of the economy from hotels to retail to transportation and send cautious signals across Asian financial markets. Historical precedents remind investors and policymakers alike: geopolitical tensions are not just political they are economic shocks waiting to unfold.
Don’t miss critical finance insights that impact your business and investments. [Follow Daily Financ](https://df.media/)e for real-time updates, expert analysis, and market trends that matter
**Categories:** Global News
**Tags:** Travel Ban
---
### [NVIDIA Earnings 2025: Markets Brace for High-Stakes Report as Tech Rotation Deepens](https://df.media/nvidia-earnings-2025-q3-results-guidance-market-impact/)
**Published:** November 17, 2025
**Author:** Vishnu Priya
**Content:**
*Updated: November 17, 2025 \| DF Media Finance Desk*
Wall Street is entering one of its most closely watched weeks of the quarter, with investors positioning themselves cautiously ahead of **NVIDIA’s midweek earnings**, a financial event that has increasingly become the single largest volatility trigger for U.S. markets. The S&P 500 opened the week on mixed cues, the Dow trimmed early losses, while the Nasdaq drifted without clear direction as traders weighed whether the chipmaker’s results will validate the strong year-to-date rally in artificial intelligence–linked equities.
### **A Market Waiting for Clarity**
Following last week’s sharp sector rotation where energy, utilities, and defensives briefly overshadowed tech the market’s tone on Monday felt distinctly hesitant. Treasury yields stabilized after a turbulent fortnight, but traders remained cautious as delayed federal economic reports continue to distort short-term data models. Analysts say this uncertainty is another reason why NVIDIA’s upcoming numbers carry outsized importance.
The broader economy may have survived the recent government shutdown, but as economists noted Monday morning, “all is not well.” Consumer sentiment has cooled, manufacturing surveys remain uneven, and Apple’s supply chain downgrades have injected fresh nerves into mega-cap tech. Within this context, NVIDIA’s earnings are being viewed as both an economic indicator and a market catalyst.
### **The High Bar for NVIDIA**
Expectations for NVIDIA remain high—perhaps dangerously so. Wall Street consensus is forecasting another quarter of explosive data-center revenue, continued AI-infrastructure expansion, and a guidance outlook that shapes the entire semiconductor sector for 2026. Any deviation from this trajectory could ripple across tech indices, options volatility, and even global chip supply-chain valuations.
Institutional desks say demand for options tied to **NVIDIA earnings 2025** remains elevated, suggesting traders are bracing for a wide post-earnings swing. Implied volatility in NVDA contracts is already pricing a 6–9% move—double the quarterly average for mega-cap tech names.
### **AI Spending Still Rising, but Investors Want Proof**
Despite broader economic concerns, the appetite for AI-capable hardware remains intact. Corporate cloud budgets for 2025 continue to allocate outsized spending to training chips and accelerated computing frameworks, a trend that has directly benefited NVIDIA’s data-center arm. Several top investment banks expect the company to post another record on AI server spending.
However, the sentiment is not unanimously bullish. Some analysts argue that hyperscalers may be entering a “digesting phase,” where earlier infrastructure build-outs slow before the next expansion cycle. While this scenario does not threaten NVIDIA’s long-term trajectory, it could influence guidance expectations—something markets will scrutinize intensely.
### **Broader Market Movements Reflect NVIDIA’s Influence**
The S&P 500’s muted performance on Monday was hardly accidental. Investors have learned that the market’s reaction to NVIDIA earnings can often overshadow macroeconomic data releases. In fact, several algo-driven funds now treat NVIDIA’s report as a structural market event, placing it in the same tier as CPI releases and FOMC press conferences.
Financial strategists describe the current setup as “binary.” A strong beat could reignite risk appetite, push the Nasdaq higher, and unwind last week’s defensive flows. A softer print, however—particularly on data-center revenue or 2026 guidance—could reinforce fears of an AI spending slowdown and deepen sector rotation.
### **The Investor Mindset Heading Into Wednesday**
Retail and institutional investors alike appear divided. Some believe this is another opportunity for NVIDIA to reset expectations upward, showcasing the durability of AI growth even in a patchy economy. Others expect near-term caution, emphasizing that the stock’s valuation already reflects years of aggressive expansion.
What remains consistent is NVIDIA’s central role as a financial barometer for the health of the global AI build-out. Markets no longer treat the company as just another semiconductor giant; its earnings call has become a pulse check for the next phase of technological spending.
As Wall Street counts down to NVIDIA’s highly anticipated earnings release, markets remain suspended between optimism and restraint. With macroeconomic uncertainty, delayed federal data, and fragile sector rotations adding pressure, NVIDIA’s results hold the power to reset sentiment across global equities. Whether the chipmaker can extend its extraordinary run or signal a period of normalization will shape the remainder of 2025’s market narrative.
For more expert breakdowns, earnings-day analysis, and market intelligence,[ **follow DF Media**](https://df.media/) **for the latest financial insights.**
**Categories:** Finance, Global News
**Tags:** NVIDIA, Q3 Results
---
### [First U.S. Spot XRP ETF Goes Live](https://df.media/first-u-s-spot-xrp-etf-goes-live/)
**Published:** November 14, 2025
**Author:** Vishnu Priya
**Excerpt:** The first U.S. spot XRP ETF launches today, opening institutional access and reshaping crypto-finance dynamic
**Content:**
The launch of the first U.S. spot XRP ETF marks a pivotal shift in how institutional capital accesses alternative digital assets. With regulated exposure now available to the token previously known mainly for its payments-network role, this new vehicle transforms perception and opens fresh pathways to investment.
## **Institutional access unlocked**
For years large investors avoided token-based assets like XRP because of custody, audit-trail and regulatory ambiguity concerns. Now, through a regulated spot fund structure, the barrier dissolves. Institutions that paused at wallets and untested platforms can now step in via mainstream brokerages.
## **New liquidity corridor, changed demand dynamics**
With the first U.S. spot XRP ETF now trading, the flow from fiat institutions into XRP opens a fresh liquidity corridor. That changes demand curves, alters volatility structure and shifts the narrative positioning of XRP within the broader digital-asset stack. Early trading volume already reached tens of millions of dollars, signalling serious interest.
**Market dynamics & early signals**
While the fund’s debut saw strong flow metrics—one report cited roughly US $58 million in day-one trading volume—underlying XRP token price reacted with a modest pull-back, reflecting a classic “sell-the-news” pattern. Analysts are watching the next 72 hours closely: inflows and redemptions will serve as a gauge of institutional appetite beyond hype. These metrics may foreshadow how willing allocators are to include non-Bitcoin/non-Ethereum assets into mainstream portfolios.
## **Strategic implications for portfolios**
This launch is more than a headline. For portfolio strategists, it signals that XRP has transitioned from speculative token to investible vehicle under new rules of engagement. For crypto strategists, it acts as a lead indicator: if institutions buy into this ETF, similar frameworks may follow for other altcoins. For risk managers, this changes the volatility regime of the alt-asset space.
## **Risks & watch-points**
- **Sustainability of flows**: strong initial volume is promising, but continuity matters. If flows fade fast, narrative risk grows.
- **Tracking token vs fund performance**: the fund structure may decouple somewhat from token price due to issuance/redemption mechanics.
- **Regulatory context**: approval of one fund is not the end of oversight; future regulatory actions could reshape the product’s appeal.
## **Conclusion**
The debut of the first U.S. spot XRP ETF is a strategic unlock. It blurs the line between digital assets and traditional investment vehicles, invites institutional capital, and signals a broader convergence of crypto and mainstream finance. The next few days will reveal whether this marks a foundational shift—or a flash in the pan.
For further updates, insights and daily finance news around the globe, follow [**DF Media**.](https://df.media/)
## **Frequently Asked Questions (FAQs)**
#### Q1: What exactly is a spot XRP ETF?
A spot XRP ETF is a fund listed on a regulated exchange that holds the underlying XRP token and tracks its spot market price, rather than derivatives or futures.
#### Q2: Why does the launch of the first U.S. spot XRP ETF matter?
It matters because it opens a regulated investment path for XRP to institutional investors, creating new liquidity and shifting how the token is perceived—transitioning it from speculative crypto to investible asset.
#### Q3: What should investors monitor now that the fund is live?
Key metrics include fund inflows/outflows, token vs fund performance, and any regulatory or structural changes that may affect fund mechanics or token exposure.
**Categories:** Banking
---
### [Why Germany’s 500-Billion-Euro Recovery Plan Isn’t Lifting the Economy — What Happens Next?](https://df.media/germanys-e500b-recovery-plan-fails-to-lift-economy/)
**Published:** November 12, 2025
**Author:** Laura Anderson
**Excerpt:** Germany’s 500-billion-euro recovery plan is falling short. Experts cut 2026 GDP forecast and warn Berlin to rethink spending priorities.
**Content:**
Germany’s much-hyped 500-billion-euro recovery fund was meant to be the engine that reignites Europe’s largest economy. But instead of powering growth, it’s sputtering. Economic experts now warn that Berlin’s massive spending plan may be falling flat — and that the country’s economic outlook for 2026 is weaker than expected.
### **The Promise of a Comeback That Never Took Off**
When Chancellor **Friedrich Merz** introduced the recovery fund, it was positioned as a bold fix for two years of economic stagnation. The plan aimed to modernize infrastructure, repair aging bridges, upgrade rail networks, and invest in green projects to cut emissions — all while restoring confidence in Germany’s global competitiveness.
Yet, months later, optimism has faded. The country’s **Council of Economic Advisers** slashed its 2026 GDP growth forecast to **0.9%**, down from the earlier **1% projection**, and well below the government’s own estimate of **1.3%**.
The message is clear: Germany’s stimulus isn’t hitting the real pain points of its economy.
### **Experts Say the Money Is Being Misused**
The problem isn’t the size of the fund — it’s how it’s being spent. The advisers argue that a large share of the €500 billion has gone into **budget reallocations** and **daily operational costs**, rather than the **new investments** needed to spark sustainable growth.
“If the funds were used entirely for additional investments, GDP could grow by up to 5% by 2030,” said **Martin Werding**, one of the council’s members. “But under current plans, the boost will likely be under 2%.”
Their recommendation? Berlin must **restructure the plan** to ensure that the money targets projects that genuinely create value — innovation hubs, advanced manufacturing, clean energy infrastructure, and workforce retraining.
### **A Recovery Plan Caught in Bureaucracy**
What was supposed to be a transformative economic program has become tangled in layers of bureaucracy and political compromise. Critics say the Merz coalition’s cautious spending style and Germany’s constitutional **debt brake** rules have slowed the fund’s real impact.
Meanwhile, Berlin’s decision to exempt **defense spending** from debt limits — while necessary for security — has further complicated the nation’s fiscal balance. The risk, experts say, is that Germany might be financing yesterday’s problems instead of investing in tomorrow’s opportunities.
### **Industry Still Struggling to Find Its Footing**
The German industrial engine — once the envy of Europe — continues to struggle. Exports remain weak, U.S. tariffs are biting into key sectors, and manufacturing output is far below pre-pandemic levels.
For a country that has long relied on exports, global demand shifts are proving hard to absorb. Economists warn that without bold innovation, digital transformation, and stronger domestic investment, Germany risks a prolonged stagnation phase.
### **What Happens Next for Berlin?**
Berlin faces a difficult balancing act. On one side is the need to maintain fiscal discipline; on the other, the urgent demand to reignite growth and restore business confidence.
The Council’s report calls for **greater transparency and stricter monitoring** of how the recovery fund is used — echoing growing public frustration over sluggish reforms.
If Berlin can refocus its spending on high-impact sectors, analysts believe growth could rebound by the end of the decade. But if spending continues as planned, Germany might only see **marginal improvement**, barely avoiding a third consecutive year of contraction.
### **The Bigger Picture: Europe’s Engine Needs a Tune-Up**
Germany’s slowdown isn’t just a national issue. As the continent’s largest economy, its performance shapes the broader **Eurozone outlook**. A sluggish Germany means slower European growth, weaker trade flows, and rising political tension across the bloc.
The world will be watching whether Berlin can reinvent its economic model from an export-heavy past to a more innovation-driven future.
Stay informed with the latest updates in global finance, markets, and AI innovation.[👉 **Follow DF Media**](https://df.media/) for real-time analysis and stories shaping the future of business and technology.
**Categories:** Banking
---
### [SoftBank’s $5.83B Nvidia Exit Fuels Its AI Vision](https://df.media/softbank-sells-5-83b-nvidia-stake-for-openai-push/)
**Published:** November 11, 2025
**Author:** Laura Anderson
**Excerpt:** SoftBank sells $5.83B Nvidia stake to fund OpenAI and AI growth plans. Full update on DF Media.
**Content:**
SoftBank has sold its entire **$5.83 billion stake in U.S. chipmaker Nvidia**, signaling a strategic shift toward funding the next wave of artificial intelligence ventures. The Tokyo-based conglomerate also liquidated part of its **T-Mobile holdings for $9.17 billion**, reinforcing its focus on building capital for aggressive AI expansion.
Chief Financial Officer **Yoshimitsu Goto** announced that the move is part of SoftBank’s “asset monetization” strategy, which aims to provide new investment opportunities while maintaining financial strength. “Through these options and tools, we make sure we are ready for funding in a very safe manner,” Goto said during the investor presentation.
The company is expected to channel over **$30 billion** in the October–December quarter alone — including **$22.5 billion for OpenAI** and **$6.5 billion for semiconductor firm Ampere**.
---
### **Ties with Nvidia Remain Through AI Ventures**
Although SoftBank’s complete exit from Nvidia surprised markets, it’s not the first time the group has cashed out of the chipmaker. Its Vision Fund had previously sold its $4 billion Nvidia stake back in 2019.
Despite this latest selloff, SoftBank’s technology ventures remain closely linked to Nvidia. The company continues to rely on Nvidia’s chips for its **$500 billion Stargate project**, which focuses on developing massive AI data centers across the United States.
Equity research analyst **Rolf Bulk** of New Street Research stated that the sale “should not be seen as a cautious or negative stance on Nvidia, but rather as a reallocation of capital for upcoming AI investments.”
---
### **Vision Fund Reports Record $19 Billion Gain**
SoftBank’s **Vision Fund**, the company’s flagship tech investment vehicle, delivered a record **$19 billion gain** this quarter — doubling the group’s net profit compared to last year. The fund’s success is largely driven by its early bet on **OpenAI**, whose valuation has surged past **$500 billion**, making it one of the world’s most valuable AI firms.
Goto emphasized that this performance reinforces SoftBank’s long-term strategy of dominating the AI value chain — from chipmakers and data centers to language models and robotics startups.
---
### **Market Reaction and Outlook**
SoftBank’s shares have been volatile in recent weeks amid concerns about a potential “AI bubble.” However, the company remains optimistic, announcing a **four-for-one stock split** to increase accessibility for retail investors.
Goto added that SoftBank intends to “provide as many investment opportunities as possible” while preparing for a global AI-driven future.
Market analysts say the company’s latest moves position it as a central player in the AI economy — shifting from chip holdings to ownership of AI infrastructure, platforms, and startups.
---
### **Key Takeaway**
SoftBank’s sale of its Nvidia stake is not a retreat — it’s a recalibration. The company is betting on AI as the foundation of its next decade of growth, with **OpenAI, Ampere, and Stargate** at the center of its global investment strategy.
---
### 💡 **Follow DF Media for Daily Global Finance and Tech Insights**
Stay informed with the latest updates in global finance, markets, and AI innovation.
👉 **Follow [DF Media](#)** for real-time analysis and stories shaping the future of business and technology.
**Categories:** Banking, Business
**Tags:** ai, fund
---
### [US Senate Shutdown Breakthrough Sparks Global Stock Market Rally – So What’s Next for Investors?](https://df.media/stock-market-rally-us-senate-shutdown-boosts-global-stocks/)
**Published:** November 10, 2025
**Author:** Vishnu Priya
**Content:**
*Published on: November 10, 2025 \| For: Daily Finance*
The financial world is buzzing. Following a breakthrough in the US Senate to resolve the prolonged government shutdown, **global stock markets** surged, with a clear **market rally** evident across major indices.
Investors are wondering: how long will this rally last, and which sectors stand to gain the most?
## 🏛️ Why the US Senate Deal Kicked Off a Global Rally
The aggressive market response wasn’t just about relief; it was about the anticipated return of **clarity** and **certainty**.
1. **Reinstating Crucial Data:** The single biggest hurdle for investors and the Federal Reserve was the freeze on **critical economic data**—like inflation, jobs, and trade reports. The Senate breakthrough means this data flow will resume, eliminating a major source of forecasting risk.
2. **The Shift to ‘Risk-On’:** Nervous money had been stockpiling in traditional **safe-haven assets** (like US Treasuries and Gold). With the policy risk suddenly receding, capital immediately rotated out of these safe havens and aggressively back into higher-growth, **risk-on assets** like stocks, fueling the surge.
3. **Removing the Policy Drag:** The end of the 40-day shutdown removes a significant drag on US economic activity, mitigating fears of a slowdown in the fourth quarter’s GDP growth.
The deal in the Senate has brought a sense of relief to markets that had been jittery for weeks. Historically, government shutdowns create uncertainty that slows spending, reduces confidence, and negatively affects stocks. The resolution triggered an immediate uptick in investor sentiment, prompting equities to jump across the US, Europe, and Asia.
**Market Rally Across Global Stocks**
The rally was led by US tech and consumer sectors, while European markets, including the FTSE 100, neared record highs. Asian markets followed suit, with Tokyo and Shanghai posting notable gains. Analysts say that this is more than a short-term bounce—it reflects renewed confidence in political stability and economic growth.
**Why This Market Rally Matters**
For investors, a **global stock market rally** signals opportunities—but also risks. Sectors tied closely to consumer spending and government contracts may see faster growth, while defensive sectors remain important for balance. Short-term traders can capitalize on volatility, but long-term investors need to consider how sustainable this rally is in light of ongoing fiscal challenges.
**Key Takeaways**
1. **Market rally indicators:** Look at volume, momentum, and sector performance to track sustainability.
2. **Investor confidence:** The breakthrough has restored confidence, especially in risk-on assets.
3. **Global implications:** Emerging markets, like India and Southeast Asia, are benefiting from a spillover of capital seeking growth opportunities.
**What’s Next for Investors?**
While the immediate market rally is exciting, cautious optimism is advised. Investors should monitor future policy developments, upcoming earnings reports, and any geopolitical risks. The key question remains: can this market rally sustain momentum into the end of 2025?
Ultimately, the US Senate shutdown resolution has served as a reminder of how political events can drive **[market rally](https://www.reuters.com/)** trends worldwide. Understanding the dynamics behind these moves is essential for any investor looking to navigate the evolving financial landscape.
Explore more in-depth analysis, expert insights, and strategies on [**DAILY FINANCE**](https://df.media/) to stay informed and ahead of market trends.
**Categories:** Finance
**Tags:** Market Rally
---
### [Bitcoin and Concordium Bring Age-Verified Payments to 75 Million Wallets](https://df.media/bitcoin-and-concordium-age-verified-crypto-payments/)
**Published:** November 7, 2025
**Author:** Daniel Reynolds
**Excerpt:** Bitcoin and Concordium partner to bring age-verified crypto payments to 75 million wallets worldwide.
**Content:**
In a development that could reshape how blockchain platforms handle compliance, **Bitcoin and Concordium** have announced a strategic partnership to integrate Concordium’s *“1-Click Verify & Pay”* solution into the Bitcoin.com Wallet. The integration will introduce **age-verified, privacy-preserving payments** for over 75 million users—a move signaling crypto’s steady march toward regulated mainstream finance.
---
## **A Strategic Collaboration for the Next Phase of Web3**
The collaboration blends **Bitcoin.com’s vast user base** with **Concordium’s identity-first blockchain** architecture. Through this, wallet users will be able to prove required information—such as legal age or location without revealing personal data. The approach merges the security of self-custody wallets with the compliance frameworks governments are increasingly demanding.
Concordium’s system introduces the *CCD token* and its zero-knowledge proof protocol directly into Bitcoin.com’s ecosystem. Each transaction can be verified without disclosing who the user is, creating a seamless, secure bridge between **privacy** and **regulation**.
---
## **Privacy with Precision**
Traditional KYC processes demand users’ full names, IDs, and addresses. In contrast, the *1-Click Verify & Pay* tool applies **zero-knowledge proofs (ZKPs)** cryptographic math that confirms facts (like being 18+) without exposing the evidence behind them.
For merchants, this means compliance without risk of data leaks. For users, it means freedom to transact privately while remaining compliant at the **protocol level**, not just at the app layer.
---
## **Why Age Verification Is Suddenly Essential**
The boom in online gaming, tokenized entertainment, and digital collectibles has prompted regulators to demand better safeguards. Age verification is now pivotal for platforms offering restricted content, betting, or adult-oriented financial products.
**Bitcoin and Concordium** provide an elegant answer: on-chain age verification that doesn’t compromise anonymity. This not only satisfies evolving global standards but also protects younger audiences from exposure to speculative or inappropriate content.
---
## **The Broader Impact on Crypto Payments**
The partnership hints at where **Web3 finance** is heading—compliant infrastructure without sacrificing decentralization. By embedding identity proofs directly into transactions, Concordium’s model makes it easier for institutional partners, payment providers, and governments to trust blockchain payments.
As more merchants adopt digital assets such as **stablecoins** or **real-world-asset (RWA) tokens**, compliance will be non-negotiable. Age-verified transactions could become the baseline for licensed operators, from online marketplaces to streaming platforms and virtual worlds.
---
## **A Shift in User Experience**
For everyday users, the biggest advantage is **frictionless verification**. No more repeated ID uploads or lengthy KYC checks; the wallet handles everything in a single cryptographic handshake. Users retain control of their data while meeting merchant requirements automatically.
Imagine buying access to a concert livestream or a gaming NFT drop. The wallet silently verifies you’re over 18 and geographically eligible, then completes payment all within seconds. That’s the **user-centric model** Web3 has been missing.
---
## **Market Momentum and Adoption Potential**
Analysts estimate that **27 percent of U.S. internet users** now hold a crypto wallet, while adoption in **South Korea, Singapore, and Brazil** already surpasses 20 percent. With digital wallets becoming as common as credit cards, the demand for **secure identity verification services** is set to surge.
Bitcoin.com’s reach spanning over 75 million wallets gives Concordium a massive launchpad. If this integration succeeds, expect competing wallets to follow suit by embedding similar *verify-and-pay* layers within their own ecosystems.
---
## **Compliance Without Compromise**
For regulators, this collaboration demonstrates that crypto can meet compliance obligations without centralizing user data. Concordium’s model allows authorities to verify identities when required (for example, in cases of fraud) while keeping individual transactions pseudonymous in normal circumstances.
That balance could become a regulatory template—especially in regions exploring **MiCA-style frameworks**, **FATF guidelines**, and **digital asset licenses**.
---
## **Looking Ahead: What This Means for Web3**
The alliance between **Bitcoin and Concordium** is not just a technical upgrade it’s a statement of intent. Crypto infrastructure is maturing from anonymity-driven to **trust-driven**, creating space for institutional participation without undermining user sovereignty.
As the global financial landscape converges around tokenization and digital currencies, expect more partnerships built on privacy-preserving compliance models like this one.
---
## **Neutral Editorial Conclusion**
The Bitcoin and Concordium partnership underscores a core truth about blockchain’s next decade: **privacy and compliance must coexist**. Their *1-Click Verify & Pay* integration moves that vision closer to reality where identity is verified, not exposed, and every transaction meets the rules without revealing the person behind it.
If successful, it could set a new benchmark for crypto-wallet infrastructure and reshape how millions engage with digital assets in a privacy-safe, regulation-ready future.
Explore more in-depth analysis, expert insights, and strategies on **[DF Media](https://df.media/)** to stay informed and ahead of market trends.
**Categories:** Bitcoin (BTC), Cryptocurrency, Global News
---
### [Ripple Hits $40 Billion Valuation After $500 Million Funding — What This Means for Crypto Investors?](https://df.media/ripple-raises-500m-valuation-soars-to-40b/)
**Published:** November 6, 2025
**Author:** Vishnu Priya
**Content:**
### Breaking News: Ripple Secures $500 Million at $40 Billion Valuation
Ripple, the enterprise-focused fintech and blockchain company, announced a $500 million funding round led by Fortress and Citadel Securities, propelling its valuation to an impressive $40 billion. This milestone underscores continued institutional confidence in Ripple’s enterprise-grade crypto solutions, including its blockchain-powered payments network and token infrastructure.
The funding aims to accelerate product development, expand enterprise adoption of Ripple’s digital asset solutions, and solidify its positioning in global financial markets.
---
### Why Ripple’s Growth Matters
Ripple’s latest valuation highlights a broader trend: institutional investors are increasingly backing blockchain infrastructure over speculative retail crypto. Key implications include:
- **Enterprise adoption acceleration:** Banks and payment providers are expected to integrate RippleNet and XRP liquidity solutions more extensively.
- **Market confidence:** Large-scale investment from Fortress and Citadel signals trust in Ripple’s technology, governance, and revenue model.
- **Alternative finance positioning:** Ripple is bridging traditional finance and crypto markets, offering both liquidity solutions and regulatory compliance.
**Investor Insight:** Early movers in Ripple’s enterprise ecosystem may see significant upside, while monitoring regulatory frameworks remains crucial.
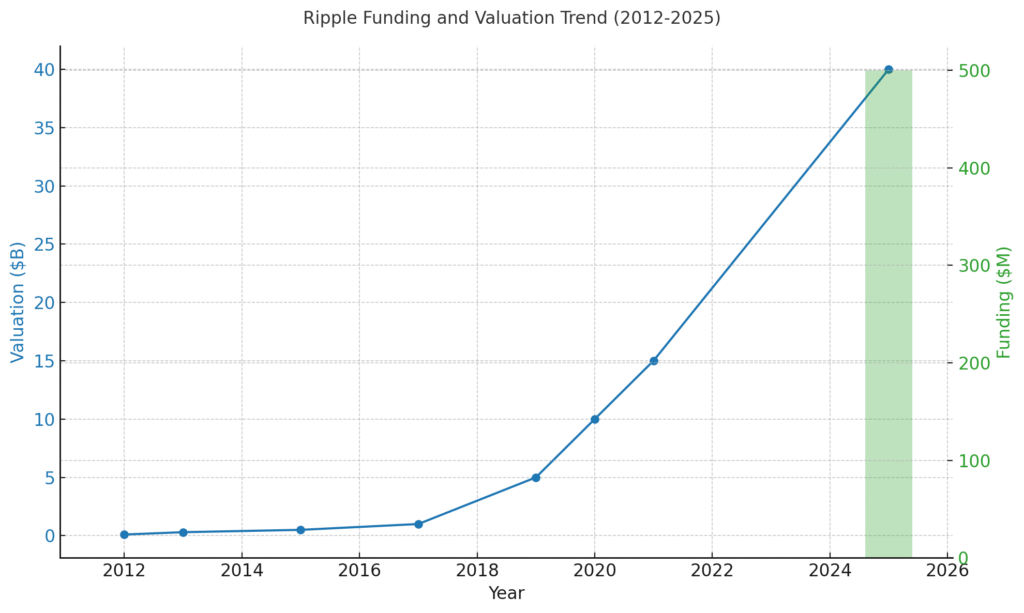Ripple’s funding rounds (bars, $M) and company valuation (line, $B) over time, highlighting the $500M funding that propelled its valuation to $40B in 2025.
---
### Ripple’s Impact on Crypto and Payments
With global cross-border payments increasingly digital, Ripple’s technology addresses real pain points: speed, cost, and transparency. Compared to traditional banking rails, Ripple’s solutions reduce transaction times from days to seconds and lower costs dramatically.
**Investor Perspective:** Adoption of enterprise-grade crypto solutions suggests institutional portfolios might shift towards infrastructure tokens like XRP, highlighting a diversification opportunity beyond Bitcoin and Ethereum.
---
### Strategic Partnerships Fuel Expansion
Ripple has previously partnered with dozens of financial institutions worldwide, and this funding is expected to deepen those collaborations. Key objectives:
- **Banks & payment providers:** Scale usage of RippleNet and XRP for cross-border settlements.
- **Regulatory alignment:** Continue working closely with regulators to ensure compliance and broader adoption.
- **Tech innovation:** Expand blockchain infrastructure capabilities for institutional-grade applications.
### From an Investor’s Point of View
- **Opportunities:** Institutional-grade crypto exposure, early participation in enterprise blockchain adoption, portfolio diversification.
- **Risks:** Regulatory scrutiny in key markets (US SEC), volatility of underlying token assets, competition from other fintech/blockchain platforms.
- **Signals to Monitor:** New enterprise partnerships, regulatory approvals, platform adoption rates, and liquidity volumes.
### FAQs
**Q1. What is Ripple and how does it differ from Bitcoin?**
[Ripple](https://ripple.com/) focuses on enterprise blockchain solutions for cross-border payments, whereas Bitcoin is primarily a decentralized digital currency.
**Q2. Who invested in Ripple’s latest funding round?**
The round was led by Fortress and Citadel Securities, with participation from other institutional investors.
**Q3. How will the $500M funding be used?**
Funds will accelerate product development, expand enterprise adoption, and strengthen Ripple’s infrastructure and regulatory compliance initiatives.
**Q4. Is Ripple a safe investment for crypto portfolios?**
While Ripple has institutional backing and enterprise utility, investors should consider regulatory risks and token market volatility.
**Q5. What does this valuation mean for the broader crypto market?**
A $40B valuation for Ripple signals strong institutional confidence in blockchain infrastructure, which could shift investment focus toward enterprise-focused crypto solutions.
Stay ahead in the world of startups and finance — **follow[ Daily Finance](https://df.media/)** for daily updates on breaking finance news, market trends, and startup insights
**Categories:** Finance, Investing
---
### [China Gold Tax Policy Shift Sparks Market Repricing and Global Demand](https://df.media/china-gold-tax-policy-change-shakes-global-bullion-market/)
**Published:** November 3, 2025
**Author:** Laura Anderson
**Content:**
### Introduction: Why this move matters
China has withdrawn its long-standing tax advantage on investment gold, raising acquisition costs for buyers in the world’s most influential bullion market. This decision lands at a moment when gold has been one of the few confident safe-haven assets amid volatile equities, uncertain rate paths, and currency pressures. The policy shift forces traders, retail buyers, and global markets to recalculate demand strength and price direction.
Gold demand in China has shaped world pricing cycles for years. When Beijing changes tax treatment, global finance listens.
---
### Policy shift: What exactly changed
China’s policy removed the preferential tax treatment on investment-grade gold bars, coins, and government-recognized bullion products. Investors and jewelers who once enjoyed reduced tax burden will now pay higher effective costs per gram or per ounce.
This is not a small administrative move. The tax break supported one of the largest physical gold buying markets on earth. Removing it marks a meaningful shift in the government’s financial policy stance toward precious metals.
---
### Cause: Why China did this
Several forces appear to sit behind this decision.
**1. Curb speculative demand**
Gold saw rapid buying by retail investors in China as currency volatility and property market uncertainty pushed households toward hard assets. Policymakers may be signaling caution against overconcentration in bullion.
**2. Stabilize capital flow and currency positioning**
China continues managing currency pressures and capital allocation. Higher gold costs can reduce gold hoarding and support more controlled capital behavior.
**3. Revenue and fiscal considerations**
With continued macro uncertainties and policy spending priorities, removing tax relief expands fiscal room without major political cost.
**4. Align with broader financial discipline**
The government has continued to tighten loose financial channels in different sectors. Precious metals were not going to stay untouched forever.
---
### Immediate effect: Demand friction inside China
The first visible outcome is buyer hesitation.
Retail investors who purchased gold bars and coins as a savings tool will feel the price pinch. Jewelers who rely on bullion inventory now face higher working costs. Consumer gold purchases had been rising across 2024 and early 2025. This policy acts as a speed bump.
Institutional buyers and central banks inside China may continue absorbing inventory, but retail volume is likely to slow near term.
---
### Market reaction: Pricing and sentiment shift
Prices did not collapse, because global investors still see gold as a hedge against policy uncertainty, trade tensions, and currency risk. However, price charts show hesitation and trading desks have widened short-term volatility expectations.
For refiners and dealers in Dubai, Singapore, and London, the focus shifts to how much Chinese demand cools and whether trading volume reroutes through offshore channels.
The bullion supply chain thrives on clarity. This move introduces uncertainty.
---
### Global implications: Beyond China’s borders
**Capital flow narrative reshapes**
Investors worldwide may now assume China will prioritize internal capital stability over free demand cycles. That supports a narrative of controlled investment behavior rather than speculative freedom.
**Other central banks watch closely**
Emerging markets that experienced rising retail gold demand may consider similar measures. When China shifts policy direction, neighbors and partners pay attention.
**Alternative safe-haven flows**
Some capital may migrate to sovereign bonds, money market instruments, or dollar-denominated savings products if yield conditions remain supportive. Diversity is a natural outcome when policy guides behavior.
---
### Outlook: What happens next
Expect three near-term dynamics.
**Short-term demand softness**
Retail participation slows. Traders reposition. Jewelers adjust procurement cycles.
**Strategic buying continues**
Central banks continue gold stocking patterns as a hedge against global instability.
**Potential offshore channel growth**
Some Chinese investors may explore Hong Kong and international platforms to access bullion at lower cost structures, depending on regulatory posture.
---
### Bottom line
China has made a calculated financial adjustment that increases gold buying costs and nudges investor behavior. The global bullion market will feel the shift, but gold’s role as a hedge remains intact. This is not a bear signal for gold. It is a demand reset and a reminder that policy power in Beijing shapes global asset markets.
---
### Summary
China’s withdrawal of tax benefits on investment gold raises costs for buyers and cools demand in one of the world’s largest bullion markets. Retail demand is expected to soften, but institutional and reserve buying remains strong. Prices hold steady as investors assess the long-term implications for global gold flows and capital behavior.
Stay informed with [DF Media](https://df.media/) for sharp global finance reporting that cuts through noise and tracks real-world shifts shaping capital, energy, and commodity markets.
**Categories:** Finance, Global News, Investing
**Tags:** CHINA, gold tax, gold tax policy
---
### [Shocking Bitcoin Price Drop 2025: 5 Facts Behind the Crash](https://df.media/shocking-bitcoin-price-drop-2025-5-facts-behind-the-crash/)
**Published:** November 5, 2025
**Author:** Laura Anderson
**Excerpt:** The Bitcoin price drop 2025 triggered a crypto liquidation spike and renewed debate on institutional crypto adoption in volatile markets.
**Content:**
## Bitcoin Price Drop 2025: What Happened
**\[Updated: 2025-11-05 09:30 IST\]** — Bitcoin rolled over overnight, slipping below a critical support level as a wave of forced liquidations rippled through futures markets. Traders reported cascading stop-losses that amplified selling pressure across major exchanges.
**Price action:** Bitcoin fell from about $102,500 to trade near $97,800 in the Asian session, representing a loss of roughly 4.5 percent in under six hours. On-chain data and derivatives platforms show more than $1.1 billion in long liquidations within the last 24 hours. The sudden unwind pushed volatility higher across the crypto complex, with Ether and major altcoins following lower.
**Why it matters:** Rapid liquidation events often trigger short-term panic and elevated trading volumes. For institutional players and corporate treasuries watching crypto allocations, such spikes underline the risks of concentrated leverage and thin liquidity during stress windows.
**Market reaction:**
• Spot exchanges saw widened bid/ask spreads and short-term funding spikes on perpetual swaps.
• Option markets priced higher implied volatility for the next 30 days.
• Stablecoin volumes increased as traders rotated to fiat-pegged liquidity.
The dramatic **bitcoin price drop 2025** stunned global traders as markets saw nearly **$1.2 billion in forced long liquidations** in less than 24 hours. Bitcoin slipped from the $102,000 zone to $97,000, shaking institutional traders and retail investors alike.
Crypto exchanges reported an accelerated unwinding process, and futures platforms triggered cascading liquidations. That sudden movement reinforces one lesson: leverage cuts both ways.
This latest **crypto liquidation spike** shows how fast sentiment can flip when automated trading meets macro fear.
---
## Why a Crypto Liquidation Spike Matters
A liquidation wave signals imbalance. When long positions unwind at scale, it means traders did not anticipate this level of volatility.
Market depth thinned. Liquidity providers reset bids. Funding rates moved sharply. The ecosystem absorbed shock, but not without pain.
For new entrants, this is a reminder that crypto markets are powerful and unforgiving during stress cycles.
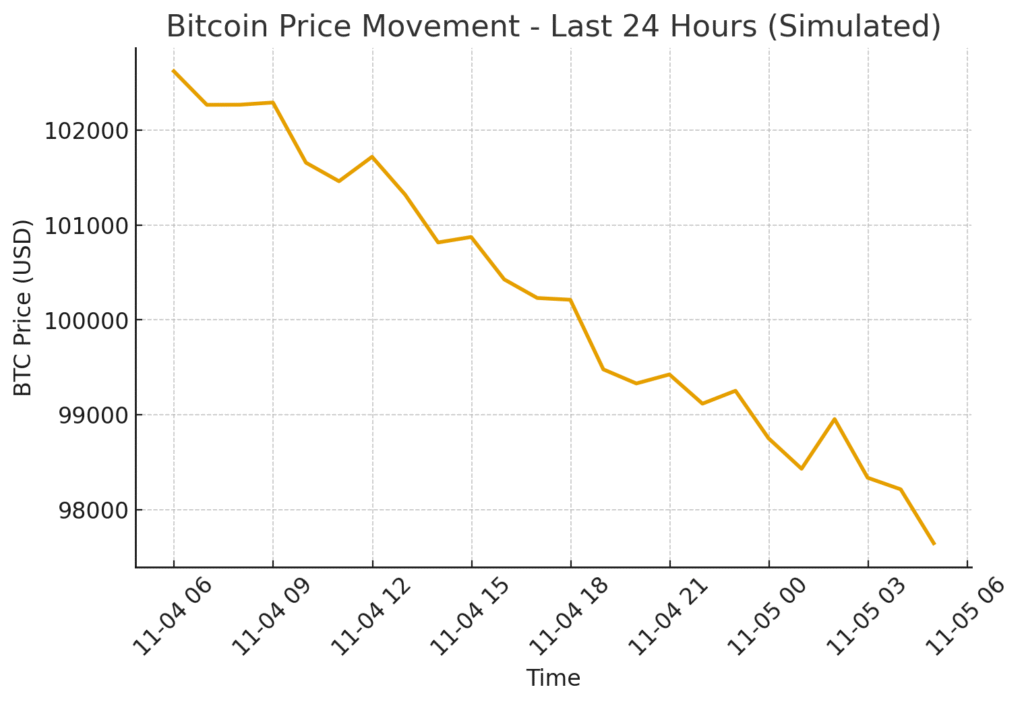BTC structurally trended lower across the last 24 hours, moving from near $102,500 to roughly $97,650, with accelerating downside momentum in late Asia hours. Price action confirms liquidation pressure rather than organic distribution.---
## Institutional Crypto Adoption 2025 Trends
Despite price swings, **institutional crypto adoption 2025** continues shaping this asset class. Banks, regulated custodians, and fintech platforms are expanding crypto services.
Licensing frameworks in Singapore, the UAE, Europe, and India are driving safer participation. Yet, strict compliance rules can trigger synchronized risk-off behaviour.
This is the balancing act. Institutions stabilise crypto long-term, but create short-term feedback loops during high-volatility windows.
---
## Market Sentiment and Trading Behaviour
When the **bitcoin price drop 2025** hit, retail accounts rushed to stablecoins. Futures traders reduced leverage. Long-term holders stayed patient.
Smart capital never panics in a noise cycle. Volatility is a feature, not a flaw.
Money flows prove it: institutional desks paused, not exited. Their playbook is strategic accumulation when fear peaks.
---
## Future Outlook
This correction is a reminder that bitcoin will keep testing conviction. Yet, each pullback historically sets a stronger foundation for long-term growth.
Investors watching this market cycle should consider diversification, custody security, and risk-managed exposure.
Regulated digital asset frameworks will keep expanding. Crypto is not going backward. It is maturing.
---
## FAQs
**What caused the bitcoin price drop 2025?**
A sudden crypto liquidation spike triggered cascading sell orders on futures markets.
**Is this a long-term trend?**
No. Long-term institutional participation remains intact despite short-term volatility.
**Should investors panic?**
Market history suggests disciplined investors benefit from corrections rather than reacting emotionally.
**Categories:** Finance, Global News
**Tags:** Bitcoin
---
### [Nvidia Becomes First Company to Reach US$5 Trillion Market Cap](https://df.media/nvidia-hits-us5-trillion-valuation-historic-milestone/)
**Published:** October 30, 2025
**Author:** Laura Anderson
**Excerpt:** Nvidia sets a new record as it becomes the first company to cross a US$5 trillion market cap, driven by surging AI demand and chip-leader
**Content:**
In a landmark moment for tech and finance, Nvidia Corporation has become the **first public company ever** to achieve a market capitalisation of **US$5 trillion**. This achievement underscores the firm’s central role in the global artificial-intelligence boom.
**Rising to $5 Trillion**
Nvidia’s ascent has been swift. Just three months ago the company passed the US$4 trillion mark, making this milestone even more dramatic.
Its shares recently climbed above US$207, giving it a market cap of roughly US$5.03 trillion.
The surge reflects booming demand for its GPU-based chips used in training and running AI systems, as well as major partnerships and infrastructure investments.
**What’s Driving This Rally**
- [Nvidia](https://www.nvidia.com/en-in/) has disclosed about US$500 billion in AI chip orders in recent deals.
- It is also working with governments and other global companies to build AI systems and supercomputers.
- Investor optimism around AI’s transformational potential has pushed valuations in related sectors upward.
**Why It Matters**
This milestone signals that the market believes AI infrastructure and compute power are no longer niche bets — they’re foundational. For investors, it raises questions about how much of the expected growth is already priced in. For the tech sector, Nvidia’s dominance positions the firm as both a driver and a benchmark.
**Risks and Considerations**
Despite the celebratory tone, several caution flags are in place:
- High valuations rely on continued execution and growth — any slowdown could prompt re-rating.
- Geopolitical and export challenges could impact Nvidia’s access to global markets.
- Some analysts warn of an “AI bubble” as valuations stretch ahead of proven returns.
**Outlook**
While predicting when Nvidia might hit US$6 trillion is speculative, the key takeaway is that the market is betting big on AI infrastructure. That means those building around AI (hardware, software, services) may benefit — but so too may see increased scrutiny and risk.
Nvidia’s milestone of [US$5 trillion market](https://www.nvidia.com/en-in/) value marks a landmark moment in tech-finance history. It reflects the shift of AI from promise to premium.
Yet for investors and industry watchers, the question now is: how much of the future is already priced in and what’s next?
### FAQs
1.**What helped Nvidia reach a US$5 trillion valuation?**
Strong demand for its AI chips, major enterprise and government partnerships, and record infrastructure spending in artificial intelligence have pushed Nvidia’s stock higher. Growing adoption of AI across industries continues to fuel revenue expectations.
2.**How fast did Nvidia grow to US$5 trillion?**
Nvidia crossed the US$4 trillion mark only a few months ago. This rapid rise highlights investor confidence in the AI sector and Nvidia’s dominant market share in AI chip technology.
3.**Is Nvidia profitable enough to justify the valuation?**
Nvidia has reported strong earnings growth for several quarters. However, the valuation also reflects future expectations. Analysts point out that the company will need to keep delivering major revenue gains to support this level.
4.**Is this growth sustainable?**
No one can say with certainty. The long term story remains positive due to strong AI infrastructure demand, but risks exist such as tighter competition, regulatory scrutiny, and global trade challenges.
5.**How does this milestone affect global markets?**
Nvidia’s rise has contributed significantly to gains in major US stock indices. It also raises concentration risk since a small number of tech companies now represent a large share of market performance.
6.**What companies are Nvidia’s biggest customers?**
Major cloud and tech companies including Microsoft, Alphabet, and Meta are large purchasers of Nvidia’s AI chips and systems. Their capital expenditure trends will continue to influence Nvidia’s future performance.
7.**Could Nvidia face competition?**
Yes. Companies like AMD, Intel, and several emerging AI chip makers in the United States and Asia are working to challenge Nvidia. However, Nvidia currently holds a strong technology and ecosystem advantage.
Follow [DF Media ](https://df.media/)for more insights and global finance updates.
**Categories:** Global News
---
### [iBig Advances Global Impact & Innovation Focus: Building a Future Where Purpose and Profit Converge](https://df.media/ibig-advances-global-impact-innovation-focus-df-media/)
**Published:** October 27, 2025
**Author:** Vishnu Priya
**Excerpt:** iBig accelerates purpose-driven investment worldwide, merging profit and sustainability under its Global Impact & Innovation strategy.
**Content:**
**Copenhagen, Denmark – October 2025**,Impact Business Investment Group (iBig), a global investment holding company redefining purpose-driven entrepreneurship, today announced the next chapter of its global expansion strategy. Rooted in innovation, sustainability, and operational excellence, iBig continues to accelerate the growth of transformative ventures that blend profitability with purpose reaffirming its commitment to reshaping how capital, technology, and social good intersect.
The company’s focus this quarter centers on Global Impact & Innovation, a theme that encapsulates iBig’s mission to architect a new generation of enterprises designed not only to perform but also to contribute meaningfully to people, planet, and prosperity.
## **A Vision Beyond Capital: Redefining the Meaning of Investment**
Founded and funded by Algreen Capital, iBig was built on the conviction that the traditional investment model focused solely on returns is no longer sufficient for the challenges of the 21st century. In a world facing ecological strain, technological disruption, and growing social inequity, iBig’s vision is clear: to foster a more conscious form of capitalism that generates lasting value through responsibility, creativity, and collaboration.
**“We are not here just to invest in companies; we’re here to co-create a movement,” said Jonathan Tjoa Algreen, Founder of iBig. “Our goal is to build scalable, future-proof ventures that align financial success with real-world impact. Purpose is not a side effect, it’s the foundation of enduring growth.**”
Unlike conventional venture capital firms, iBig does not follow the “fund-and-forget” model. Instead, it operates as an active architect working directly with founders and management teams to refine business models, optimize operations, and build resilient organizations equipped for long-term success.
## **A Model Built for the Future: Deep Engagement, Dual Engines, and Defined Impact**
iBig’s investment philosophy is anchored in three pillars that distinguish it from traditional funds:
### **1. Deep Operational Engagement**
Every iBig portfolio company benefits from the hands-on involvement of experienced operators and strategists. The firm’s in-house experts support ventures across leadership, technology, finance, marketing, and sustainability ensuring that each company grows with structure, accountability, and agility.
This “build-together” approach helps founders overcome early-stage challenges faster while creating stronger foundations for scalability.
### **2. Dual-Engine Portfolio: Enterprise SaaS and ESG Ventures**
iBig’s portfolio strategy combines two of the world’s most transformative forces: technology-led innovation spanning SaaS, digital platforms, business services, and media and ESG-driven ventures that address environmental and social challenges through commercially scalable models.
By investing across both B2B and B2C ecosystems, iBig builds a diversified portfolio that bridges technological advancement with sustainable value creation. This dual approach allows iBig to capture resilience, relevance, and long-term growth across interconnected sectors.
### **3. Defined Liquidity Path and Long-Term Value**
As part of its long-term roadmap, iBig is evaluating a future public listing that would provide liquidity to shareholders and solidify its position as a global architect of responsible growth. This roadmap reflects its belief in transparency, investor confidence, and scalable governance hallmarks of sustainable capital markets.
## **Global Impact: Scaling Sustainability Across Borders**
Operating across Europe, the USA, and Southeast Asia, iBig is uniquely positioned to bridge global markets and accelerate cross-border innovation. The group’s network allows ventures to scale efficiently across diverse economies while maintaining strong environmental, social, and governance (ESG) principles.
Over the past year, iBig has expanded its presence in key strategic markets, supporting founders who address real-world challenges such as climate resilience, ethical fashion, circular manufacturing, and digital inclusion.
Through this global perspective, iBig has become a catalyst for international growth, helping its ventures unlock new markets while preserving their authentic missions. Its collaborative model ensures that businesses founded on integrity and sustainability can expand responsibly proving that impact and innovation thrive best when scaled together.
## **Innovation as a Force for Good**
At the heart of iBig’s strategy lies a simple principle: innovation is most powerful when it serves humanity.
From enterprise software that enhances transparency and efficiency to sustainable lifestyle brands redefining conscious consumption, iBig’s portfolio companies share a common DNA: the pursuit of excellence with empathy.
Innovation at iBig isn’t limited to product or technology; it extends to governance models, operational processes, and stakeholder engagement frameworks. By embedding ESG metrics into decision-making, iBig ensures that innovation remains accountable and aligned with long-term global goals.
**“Our companies are not chasing trends, they’re creating the next paradigm,” said Jonathan. “Whether it’s climate-tech, ethical commerce, or sustainable data platforms, we invest in ideas that are both meaningful and measurable.”**
## **Building a Global Community of Principled Capital**
In a rapidly changing world, iBig stands out for its ability to align investors, founders, and consumers around a shared ethos: principled capital.
This concept, central to iBig’s identity, challenges the outdated notion that financial success and social responsibility are mutually exclusive. Instead, iBig demonstrates that profitability and purpose can reinforce one another when guided by discipline, transparency, and intention.
To that end, the company continues to build relationships with family offices, institutional investors, and mission-driven entrepreneurs who share its long-term vision. Through collaborative initiatives and knowledge-sharing programs, iBig aims to transform the broader investment landscape from extractive models to regenerative ones.
## **Engaging the Next Generation of Entrepreneurs**
Beyond investment, iBig acts as a mentor, incubator, and strategic partner for founders who aim to create businesses that matter. The firm’s co-building model provides access not just to capital but also to operational expertise, sustainable supply chain design, and growth acceleration frameworks.
**“We don’t just provide funding, we provide a compass,” added Jonathan. “Our portfolio founders are building companies that stand for something greater. We help them align that purpose with measurable outcomes and global opportunities.”**
This ecosystem approach has created a growing network of entrepreneurs who see iBig not as a financier but as a long-term ally, one that brings credibility, international access, and operational depth to every partnership.
## **Technology Meets Sustainability: The Dual Path to Progress**
The convergence of technology, business services, media, and sustainability is at the core of iBig’s impact thesis. By investing in digital platforms and ESG ventures that drive operational transparency and address planetary challenges, iBig ensures that its portfolio delivers not only economic but also environmental and social returns.
From AI-powered business analytics and purpose-driven media to ethical manufacturing systems that minimize waste, the group’s investments demonstrate that digital transformation and sustainability can and must go hand in hand.
## **Investor Engagement: Confidence in a Conscious Future**
iBig’s investor base continues to expand as global investors seek exposure to high-performance ventures with verifiable ESG alignment. The company’s unique structure operating as a global holding rather than a fixed-term fund allows it to maintain agility and focus on long-term value creation.
In recent months, iBig has deepened its dialogues with investors from the USA, Europe, the Middle East, and Asia, focusing on shared impact metrics, transparent governance, and scalable innovation. These conversations reinforce confidence in iBig’s model where financial growth and societal benefit advance in harmony.
**“Impact-focused investors are increasingly drawn to iBig’s model, one where doing well and doing good reinforce each other,” said Jonathan. “We’re building a framework that gives purpose-driven capital a clear path to measurable and meaningful growth.”**
## **A Roadmap Toward Public Listing and Global Scalability**
iBig’s long-term strategic plan includes a potential public listing, which would represent a pivotal milestone in the holding company’s evolution. A public listing will provide shareholders with liquidity while reinforcing the company’s commitment to accountability, transparency, and sustainable governance.
While maintaining a disciplined approach to expansion, iBig continues to strengthen its internal structures, refine its investment criteria, and expand its due diligence framework to align with international sustainability reporting standards.
The roadmap positions iBig not just as an investment company but as a movement for principled capitalism, one that invites global investors to participate in building an economy that values both prosperity and purpose.
## **The Human Side of Impact**
At its core, iBig’s philosophy is deeply human. It recognizes that behind every investment, technology, or innovation lies a story of entrepreneurs daring to challenge the status quo, of communities benefiting from responsible growth, and of investors seeking to make their capital a force for good.
Each portfolio company represents a commitment to resilience, inclusivity, and legacy. Whether developing ethical fashion ecosystems, advancing renewable technologies, or creating enterprise tools for sustainability reporting, iBig’s ventures all share a purpose: to make business a vehicle for positive transformation.
**“Capital has the power to heal as much as it has the power to grow,” Jonathan reflected. “Our mission is to make sure it does both.”**
**Looking Ahead: From Purpose to Performance**
As iBig enters its next phase of expansion, the company remains steadfast in its mission to architect businesses that embody sustainability, scalability, and soul. The coming quarters will see continued portfolio diversification, enhanced investor relations, and the rollout of a global media platform designed to share insights from across the iBig ecosystem.
With an emphasis on impact measurement, cross-border collaboration, and innovation-led sustainability, iBig is poised to set new benchmarks for how modern capital can accelerate the transition to a regenerative economy.
**“iBig is more than a holding company,” said Jonathan. “It’s a platform where purpose meets performance and where every investment becomes a step toward a better future.”**
## **About iBig**
**[Impact Business Investment Group (iBig) ](https://ibig.vc)**is a global investment holding company architecting scalable, purpose-driven ventures at the intersection of technology, business services, media, and sustainability.Founded and solely funded by the Algreen Capital single family office, iBig provides capital, operational expertise, and a repeatable blueprint for building companies that deliver superior risk-adjusted returns while making the world a better place.
***Follow us on LinkedIn***
- [LinkedIn](https://www.linkedin.com/company/impact-business-investment-group)
***Learn more at:** [https://iBig.vc](https://ibig.vc/)*
Stay ahead of global financial trends ,**[follow DF Media](https://df.media/) for daily updates on interest rate decisions, inflation news, and market insights**. Don’t miss a beat in today’s fast-moving economy.
**Categories:** Business, FinTech
---
### [Russia Central Bank Slashes Key Interest Rate cut to 16.5% Amid Inflation Surge and U.S. Sanctions](https://df.media/russia-central-bank-slashes-interest-rate-cut-to-16-5/)
**Published:** October 24, 2025
**Author:** Ethan Brooks
**Excerpt:** Russia Central Bank slashes interest rate cut to 16.5% amid inflation surge and U.S. sanctions. Governor Nabiullina outlines future monetary policy
**Content:**
*October 24, 2025 – Moscow, Russia*
The **Bank of Russia** has **slashed its key interest rate to 16.5%**, marking the first monetary policy adjustment since new **U.S. sanctions on Russian oil firms** were imposed earlier this month. The move is designed to balance **inflation control in Russia** while supporting economic activity amid ongoing fiscal and geopolitical pressures.
---
## **Monetary Policy Easing Amid Economic Pressures**
Governor **Elvira Nabiullina** explained that future **Russia interest rate decisions** will depend on the trajectory of inflation expectations and whether **price stability in Russia** can be achieved without fueling demand-driven pressures. The central bank confirmed that it would maintain tight monetary conditions until inflation reaches the **official 4% target by 2026**.
Despite the rate cut, policymakers emphasized that **real interest rates in Russia** remain restrictive. The bank forecasts rates will average **13–15% through 2026**, reflecting a cautious approach to contain inflation while preventing a sharp slowdown in credit activity and growth.
---
## **Bank of Russia Inflation Forecast and Economic Outlook**
The **Bank of Russia inflation forecast** for 2025 was revised upward to **6.5–7%**, influenced by a proposed **VAT hike in 2026** and ongoing supply disruptions from **Ukrainian attacks on Russian refineries**. Analysts suggest that while **inflation risks in Russia** persist, the central bank’s decision signals confidence in gradual economic stabilization.
Temporary factors such as rising fuel prices and seasonal food cost increases contributed to the inflation spike. As of October 20, cumulative inflation for 2025 had reached nearly 5%, with gas prices up 11.6% year-to-date.
---
## **Geopolitical Factors Driving Monetary Policy**
The latest **U.S. sanctions on Russian oil companies** are expected to slow exports and reduce GDP growth to around 1% in 2025, down from 4.3% in 2024. Governor Nabiullina noted that sanctions targeting raw material exports present challenges but are historically manageable due to Russia’s adaptation mechanisms.
The **Russia central bank budget rule** remains a key stabilizing tool, absorbing price volatility through reserves in the **National Welfare Fund**.
---
## **Future Outlook and Policy Considerations**
While businesses are calling for further rate cuts to stimulate investment, the central bank continues to exercise caution. Nabiullina emphasized that **gradual rate easing in Russia** is underway, and further reductions will depend on evolving economic conditions.
The **[Bank of Russia monetary policy](https://www.bloomberg.com/news/articles/2025-10-24/russia-cuts-rate-to-16-5-as-refinery-attacks-feed-inflation)** remains focused on balancing inflation containment with support for economic activity amid sanctions and fiscal pressures. Analysts predict that monetary decisions over the coming months will continue to adapt to global and domestic economic shifts.
Stay ahead of global financial trends—**[follow DF Media](https://df.media/) for daily updates on interest rate decisions, inflation news, and market insights**. Don’t miss a beat in today’s fast-moving economy.
**Categories:** Finance, Global News
**Tags:** finance
---
### [🚨 Shocking Crypto Market Crash 2025: Bitcoin & Ethereum Plunge as Gold Falls](https://df.media/crypto-market-crash-bitcoin-ethereum-plunge-as-gold-falls/)
**Published:** October 22, 2025
**Author:** Daniel Reynolds
**Excerpt:** Explore investor psychology, market analysis, and strategies to navigate the crypto market crash of 2025
**Content:**
**Crypto Market Crash** has sent shockwaves through global financial markets, with **Bitcoin (BTC)** and **Ethereum (ETH)** witnessing sharp declines over the past 24 hours. Investors are scrambling for answers as portfolios take hits, while gold—the traditional safe-haven asset—also falls, adding to the uncertainty. This article provides a **detailed analysis**, explores investor sentiment, and offers practical strategies to navigate these turbulent times.
This article provides a **detailed analysis** on why the crypto market crash and the declin, explores the psychology behind investor behavior, and offers practical strategies to navigate these turbulent markets.
---
### 📉 Bitcoin and Ethereum: Market Shockwaves
Bitcoin has dropped to approximately **$107,730**, while Ethereum hovers around **$3,834**, representing a **2–3% decline in just 24 hours**. Such sudden dips often trigger panic selling, especially among retail investors, causing further downward pressure on prices.
Investors’ emotions are key to understanding crypto volatility. Fear and greed dominate sentiment, and social media chatter reveals that many traders are **anxious and reactive**, selling in anticipation of further drops
---
### 🔍 Key Drivers of the Crypto Downturn
#### 1. Gold Prices Dip Unusually
Gold has fallen over 5% recently, surprising analysts and investors alike. Gold often acts as a hedge during market uncertainty, but its decline this time has added to investor caution. The simultaneous fall of both gold and cryptocurrencies highlights widespread **market anxiety**. ([Yahoo Finance](https://finance.yahoo.com/news/gold-silver-tumble-in-biggest-daily-drop-in-years-as-stunning-precious-metals-rally-comes-to-a-halt-155953734.html?utm_source=chatgpt.com))
#### 2. Regulatory Uncertainty
Governments across the US and EU continue discussions about cryptocurrency regulations. Speculations about stricter laws, taxation, or oversight often influence investor sentiment. Uncertainty fuels short-term selling and volatility, particularly among institutional investors.
#### 3. Market Volatility and Technical Indicators
Crypto prices are naturally volatile. Bitcoin breaking below **$108,000 support** and Ethereum dropping under **$3,850** has triggered stop-loss orders and automated selling. Technical traders closely monitor these thresholds to guide their decisions.
---
### 💡 Psychological Insights: Investor Mindset
Crypto investing is emotional. The **fear of missing out (FOMO)** often drives rapid buying, while **panic selling** occurs during downturns. Currently, fear dominates, with Reddit, Twitter, and Telegram forums reflecting heightened anxiety. Understanding the **psychology behind market moves** can help investors make informed, less emotional decisions
---
### 🪙 Gold vs Bitcoin: Interconnected or Separate?
Though Bitcoin and gold are both alternative assets, their correlation is not straightforward. Gold’s recent fall may cause some traders to question crypto’s stability, while others view the dip as a buying opportunity.
Investors should remember that macroeconomic factors **interest rates, inflation expectations, and geopolitical tensions** play crucial roles in the performance of both assets.
---
### 🧠 Investor Strategies Amid Market Turbulence
1. **Diversify Investments:** Don’t concentrate on crypto alone; balance with equities, bonds, or other assets.
2. **Maintain Long-Term Perspective:** Volatility is natural; focus on long-term gains instead of short-term swings.
3. **Stay Informed:** Track regulatory news, technical signals, and market trends.
4. **Manage Emotions:** Avoid panic selling and emotional trading; stick to your strategy.
---
### 📊 Market Summary
| Asset | Current Price | 24-Hour Change |
|---|---|---|
| Bitcoin (BTC) | $107,730 | -2.5% |
| Ethereum (ETH) | $3,834 | -2.6% |
| Gold | $1,985 | -5% |
*[Source](https://www.coindesk.com/price/bitcoin)*
---
The cryptocurrency market is highly volatile, and the recent simultaneous dip in Bitcoin, Ethereum, and gold underscores the **complex dynamics of investor behavior and market psychology**. While short-term losses can be stressful, maintaining a **well-researched, diversified approach** can help investors navigate these challenges successfully.
*Remember: Always perform due diligence and consult financial advisors before making investment decisions.*
### 📢 Stay Ahead in Crypto & Finance
Want to **make sense of the crypto market crash and navigate volatile markets like a pro**?
Explore more in-depth analysis, expert insights, and strategies on **[DF Media](https://df.media/)** to stay informed and ahead of market trends.
**Categories:** Bitcoin (BTC), Cryptocurrency
---
### [Bitcoin All-Time High 2025: What’s Driving the Record $125K Surge?](https://df.media/bitcoin-hits-125k-whats-driving-the-record-surge/)
**Published:** October 6, 2025
**Author:** Vishnu Priya
**Excerpt:** Bitcoin hits a record $125K, setting a new all-time high. Discover the key factors driving this massive crypto surge and what’s next for investors.
**Content:**
Bitcoin has once again shattered expectations soaring past the **$125K mark** and setting a **new all-time high in 2025**. From Wall Street traders to everyday investors, the excitement is electric.
But what’s behind this historic milestone? And is it sustainable?
Let’s break down the major forces driving this surge and what it means for the future of digital finance.
---
## **1. The Perfect Storm Behind Bitcoin’s Record High**
The **Bitcoin all-time high 2025** didn’t happen by chance. It’s the result of multiple global shifts aligning at once:
- **ETF approvals:** Major financial regulators finally approved multiple **Bitcoin ETFs**, opening the doors for institutional money.
- **Post-halving impact:** The 2024 Bitcoin halving reduced supply — while demand only grew.
- **Economic uncertainty:** As inflation bites and currencies weaken, investors are flocking to Bitcoin as a digital hedge.
Together, these factors created the ideal environment for Bitcoin to explode past its previous limits.
---
## **2. Institutional Adoption Changes Everything**
Big finance has officially joined the Bitcoin revolution.
Firms like **BlackRock**, **Fidelity**, and **ARK Invest** now hold massive Bitcoin positions, giving crypto an unprecedented level of credibility.
Institutional investors bring:
- **Liquidity** — smoother market movement
- **Stability** — fewer panic sell-offs
- **Trust** — more long-term confidence from traditional investors
Their presence has transformed Bitcoin from a speculative bet into a serious asset class.
---
## **3. Retail Investors Ride the Wave**
While institutions brought credibility, **retail investors brought energy**.
Apps like Coinbase, Binance, and PayPal have made it effortless to buy Bitcoin, even for first-timers.
In 2025, Bitcoin’s rally was amplified by:
- **Social media hype**
- **Crypto influencers**
- **Automated trading apps**
The result? Massive trading volume and millions of new investors jumping into the Bitcoin boom.
---
## **4. Government Stance and Global Adoption**
Governments are no longer resisting — they’re regulating.
Countries such as **Japan**, **UAE**, and **Singapore** have built friendly frameworks for crypto operations, while **El Salvador’s early Bitcoin move** continues to pay off.
Even major economies are exploring **CBDCs (Central Bank Digital Currencies)**, signaling that crypto’s role in global finance is here to stay.
The **Bitcoin all-time high 2025** marks a new era where regulation and innovation coexist.
---
## **5. The Role of AI and Technology**
Technology is supercharging the crypto market.
AI-powered bots and predictive trading systems now help investors spot trends and manage portfolios with precision.
Tech giants like **Nvidia** and **MicroStrategy** have benefited from this digital boom their stocks rising alongside Bitcoin’s record climb.
---
## **6. Is Bitcoin’s $125K Rally Sustainable?**
Experts believe this could just be the beginning:
- **ARK Invest’s Cathie Wood** predicts Bitcoin may hit **$250K by 2026**.
- **JP Morgan** sees Bitcoin stabilizing between **$110K–$130K** in the short term.
- On-chain data shows **long-term holders accumulating**, not selling a strong bullish sign.
While small corrections are natural, analysts agree that Bitcoin’s long-term trajectory remains upward.
---
## **7. What This Means for Investors**
If you’re considering entering the crypto space, here’s what experts recommend:
1. **Invest gradually:** Use a dollar-cost averaging (DCA) approach.
2. **Store safely:** Move holdings to **cold wallets**.
3. **Stay updated:** Follow regulatory and market news.
The **Bitcoin all-time high 2025** is proof that digital assets are no longer a niche they’re mainstream.
---
## **8. The Bigger Picture: The Future of Money**
Bitcoin’s rise isn’t just about price it’s about transformation.
Decentralized finance, AI-based trading, and blockchain transparency are changing how money works.
As Bitcoin leads the way, the global economy is slowly shifting toward a **borderless, tech-driven financial future.**
---
[Bitcoin ](https://www.coindesk.com/markets/2025/10/05/bitcoin-at-historic-highs-3-critical-levels-to-watch-now)reaching **$125K in 2025** is more than a headline it’s a defining moment in financial history.
With growing institutional trust, technological advancements, and public enthusiasm, Bitcoin is proving that the **future of finance is decentralized, digital, and unstoppable.**
The **Bitcoin all-time high 2025** isn’t the finish line it’s just the beginning of what’s to come.
For deeper insights on finance, crypto, and global markets, **[follow DF](https://df.media/) Media** for daily updates.
Curious how stablecoins are reshaping global finance?
Don’t miss our article:
[Why Stablecoins Are Becoming the Backbone of the Global Economy.](https://df.media/stablecoins-in-global-payments-2025-banking-2-0/)
**Categories:** Bitcoin (BTC), Cryptocurrency
---
### [Gold Price Hits 37th Record as Silver ETFs Shrink](https://df.media/gold-price-hits-37th-record-as-silver-etfs-shrink/)
**Published:** September 30, 2025
**Author:** Daily Finance
**Excerpt:** Gold price climbs above $3,800 per ounce, marking 37th record; silver ETFs shrink as bullion demand rises in global precious metals markets.
**Content:**
### Gold Surpasses $3,800 Amid Rising Demand
Gold price 2025 surged above $3,800 per Troy ounce on Monday, marking the 37th new record of the year. Spot gold reached $3,831 per ounce in London trading before settling slightly lower, reflecting strong investor demand and record-breaking ETF inflows.
---
### Silver Reaches 14-Year High
Silver prices also climbed sharply, rising 2.3% to a 14-year high of $47.17 per ounce during Asian trading. The Gold/Silver Ratio fell to just above 81, its lowest level in 12 months.
Meanwhile, the iShares Silver Trust ETF (SLV) shrank from its largest size in over three years, signaling reduced institutional exposure even as silver prices continued to rise.
---
### ETF Inflows Boost Gold Demand
September inflows into gold ETFs increased bullion backing by nearly 100 tonnes, according to the World Gold Council, just behind April’s 37-month record.
Bruce Ikemizu, Chief Director of the Japan Bullion Market Association, said:
> “The $400 surge from $3,400 to $3,800 shows growing awareness among institutional investors and hedge funds of the benefits of holding gold as prices rise.”
Derivatives platform Saxo Bank also highlighted that strong ETF demand is a key driver behind gold’s continued gains.
---
### Currency and Bond Market Impact
The US Dollar Index fell 0.2%, while US Treasury bond prices rose, pushing 10-year yields down 0.3 percentage points. London gold prices surged 1.6% to record highs of £2,850 and €3,268 per Troy ounce, while Shanghai Gold Exchange prices reached ¥862 per gram.
Despite these gains, gold in China traded at a $50-per-ounce discount to London prices, signaling weaker domestic demand relative to global supply.
---
### Other Precious Metals Climb
- **Platinum** rose 3% to a 12-year high of $1,628 per ounce and hit ¥7,598 per gram in Japan.
- **Silver** set new records in Japanese Yen above ¥224 per gram and 45-year highs in Euros at €40 per ounce.
Gold prices for Japanese retail investors crossed the psychological level of ¥20,000 per gram including consumption tax.
[ *Follow DF Media*](https://df.media/) *for the latest insights on digital finance, innovation, and the future of money.*
**Categories:** Finance
**Tags:** Gold Price
---
### [Global Debt 2025 Skyrockets to $337.7 Trillion: Are We Facing a Global Debt Crisis 2025?](https://df.media/global-debt-2025-hits-337-7-trillion/)
**Published:** September 29, 2025
**Author:** Vishnu Priya
**Excerpt:** Global debt 2025 hits $337.7T as fiscal pressures rise. Explore drivers, risks, and impacts on economies, investors, and markets worldwide.
**Content:**
---
Global debt 2025 has reached an unprecedented **$337.7 trillion**, marking a surge of over **$21 trillion** in just the first half of the year, according to the latest **Institute of International Finance (IIF)** report. This sharp rise signals the growing **global debt crisis 2025**, fueled by looser financial conditions, a weaker U.S. dollar, and accommodative central bank policies worldwide.
The unprecedented levels of debt have caught the attention of policymakers, investors, and citizens alike, raising urgent questions about **debt sustainability challenges 2025**, market stability, and long-term economic risks.
---
## Key Drivers Behind Global Debt 2025
Several factors are driving the surge in **rising global debt 2025**:
1. **Accommodative Monetary Policies:** Central banks continue to maintain low interest rates, encouraging borrowing and fueling debt accumulation.
2. **Weaker U.S. Dollar:** A softer U.S. dollar makes international borrowing cheaper, particularly for **emerging market debt 2025**.
3. **Pandemic-Era Fiscal Measures:** Residual government spending from pandemic relief efforts continues to push debt to record highs.
The pace of debt accumulation mirrors the surge seen in late 2020, highlighting the ongoing **global financial stability 2025** concerns.
---
## Emerging Markets and the $3.2 Trillion Challenge
Emerging economies are particularly vulnerable, with debt levels exceeding **$109 trillion**. They face **$3.2 trillion in bond and loan repayments** for the remainder of 2025, posing a serious risk to fiscal stability.
Challenges include:
- **Higher Borrowing Costs:** Gradual interest rate increases make debt servicing more expensive.
- **Currency Risk:** Weak domestic currencies amplify the cost of repaying dollar-denominated debt.
- **Fiscal Constraints:** Many emerging markets rely on borrowing to finance growth, leaving limited flexibility for additional spending.
These factors underscore the scale of the **global debt 2025 problem** and the potential impact on financial markets worldwide.
---
## Fiscal Pressures and Debt-to-GDP Ratios 2025 in Advanced Economies
Advanced economies are also experiencing mounting fiscal pressures in 2025. Countries like Japan, Germany, and France are facing slower economic growth alongside rising government obligations. In the U.S., short-term borrowing now constitutes **20% of total government debt**, raising concerns about **debt sustainability challenges 2025** and central bank independence.
Reliance on short-term debt increases vulnerability to market fluctuations. A sudden rise in interest rates or economic slowdown could create a debt spiral, impacting both national and global financial stability.
---
## What Rising Global Debt 2025 Means for Investors and Citizens
The record **global debt 2025** level carries several implications:
- **Investors:** Government debt levels influence bond yields, stock market volatility, and currency fluctuations. Investment in emerging markets requires careful consideration of repayment risks and currency exposure.
- **Citizens:** High national debt can lead to higher taxes, reduced public spending, and slower economic growth, affecting social programs and public services.
- **Policy Makers:** Governments must implement strategic fiscal reforms and manage borrowing prudently to avoid deepening the **global debt crisis 2025**.
Globally, the **debt-to-GDP ratio 2025** now exceeds **324%**, with emerging markets reaching **242.4%**, emphasizing the need for careful fiscal management.
---
## Strategies to Mitigate Debt Risks
To address the rising **global debt 2025**, several strategies are crucial:
- **Fiscal Discipline:** Balance spending with revenue generation to reduce dependency on borrowing.
- **Debt Restructuring:** Negotiate favorable repayment terms to ease pressure, especially for **emerging market debt 2025**.
- **Revenue Diversification:** Boost trade, foreign investment, and economic innovation to generate sustainable income.
- **Monetary Coordination:** Align central bank policies with fiscal measures to maintain stability without spurring inflation.
While the debt surge is alarming, proactive measures can prevent a full-blown crisis and safeguard economies and citizens alike.
---
### Conclusion
The record **$337.7 trillion global debt 2025** underscores growing fiscal vulnerabilities worldwide. Emerging and advanced economies must act carefully to ensure **debt sustainability challenges 2025** are managed effectively, while investors and citizens should stay informed about potential risks.
**For more insights on global economic trends, read the[ full IIF report here](https://www.iif.com/). Stay updated with[ DF Media ](https://df.media/)for daily coverage and expert analysis on global debt 2025 and beyond.**
**Categories:** Global News
**Tags:** debt
---
### [Artelize Ignites a Digital Uprising in the Performing Arts World](https://df.media/artelize-digitizing-the-stage-a-cultural-tech-revolution/)
**Published:** July 18, 2025
**Author:** Vishnu Priya
**Content:**
The global live events and performing arts industry faces an estimated annual loss of over $60 billion due to fragmented infrastructure, lack of digital integration, and data disconnect between audiences, artists, and institutions. A Danish startup, Artelize, has emerged with a platform aiming to address these persistent structural issues bringing the cultural sector into the digital era through a solution designed specifically for its unique challenges.
Artelize provides a comprehensive Audience Acquisition Platform built for performers, ensembles, and all-sized event organizers. The platform offers features such as real-time event indexing, self-updating artist and event pages, audience analytics, and CRM-like functionality enabling users to not only promote their events but also understand and grow their audience through data-driven tools.
“Imagine if the live events industry had its own IMDb,” says Jan Pilgaard Carlsen, Co-founder and Chief Product Officer. “We’ve built a platform that is intuitive, scalable, and deeply rooted in the needs of cultural professionals.”
To date, over 300,000 events have been indexed on Artelize. The startup is steadily approaching product-market fit, having gained traction among performing arts institutions and cultural leaders across Europe and North America.
---
### Founded by Artists Navigating a Digital Void
Artelize was co-founded by Sune Hjerrild, Paola Cacciatori, Jan Pilgaard Carlsen, and Vlad Poliakov—all with professional roots in music and live performance. The idea for the company arose from a shared frustration with the lack of digital infrastructure in the arts.
Their platform seeks to address this by exploring novel technologies, including creative tools for [**AI text to music**](https://artelize.com.).
Artelize now operates with a team of 20 professionals across product, engineering, data, and strategy, enabling rapid development and rollout of its platform across markets.
---
### Adoption by Cultural Institutions
Organizations such as Fort Worth Opera, Bay Philharmonic, and others have not only implemented Artelize into their operations but have also become active supporters of the platform’s capabilities.
“Artelize had already sold more tickets for us than the cost of the subscription, so it was a no-brainer,” said Matthew E. Graber, CMO of San Diego Opera.
Leaders in the cultural management space have also spoken to its ability to consolidate and visualize performance data.
“Imagine all your most important audience and donor metrics in one place. Artelize has made that pretty real easy,” remarked Aubrey Bergauer, CEO of Changing the Narrative.
This level of integration has been particularly attractive to institutions that lack large-scale marketing or tech teams but need agile, scalable digital solutions.
---
### Positioned for Sector-Wide Impact
Backed by investors associated with Scanmarket and Human Act, Artelize represents a growing trend of purpose-driven technology tailored for the cultural sector. The platform’s development has been guided by direct input from industry professionals, ensuring that the tools provided align with real-world workflows and needs.
As the performing arts world continues to adapt to post-pandemic realities and an increasingly digital public sphere, Artelize is positioning itself not as a disruptor, but as an enabler for a company working with and for the sector to ensure long-term resilience, visibility, and growth.
For more information, visit <https://artelize.com.>
**To stay updated on innovations transforming the performing arts world, follow[ DFmedia ](https://df.media/)for the latest in cultural tech breakthroughs.**
https://df.media
**Categories:** Finance, Global News
**Tags:** Performing Arts
---
### [Fold Bitcoin Credit Card 2025: Earn Bitcoin rewards with Every Purchase](https://df.media/fold-bitcoin-credit-card-2025-earn-bitcoin-rewards/)
**Published:** September 24, 2025
**Author:** Daily Finance
**Excerpt:** Discover the Fold Bitcoin Credit Card 2025, powered by Visa & Stripe. Earn Bitcoin rewards on every purchase and enjoy exclusive crypto perks.
**Content:**
The world of finance is changing fast, and cryptocurrencies are at the forefront of this revolution. In an exciting new development, **Fold has partnered with Visa and Stripe** to launch the **Fold Bitcoin Credit Card 2025**. This card allows users to earn Bitcoin rewards on every purchase, seamlessly integrating cryptocurrency into daily spending. Whether you’re shopping online, paying bills, or grabbing a coffee, this card makes digital currency more accessible than ever.
With the rising interest in crypto rewards programs, the **Fold Bitcoin Credit Card** is perfectly timed to meet the needs of both seasoned crypto enthusiasts and beginners looking for a simple way to earn Bitcoin.
---
### **What is the Fold Bitcoin Credit Card?**
The **Fold Bitcoin Credit Card 2025** is a first-of-its-kind credit card designed to reward users with Bitcoin instantly. Unlike traditional reward cards that offer points or cash back, this card provides **Bitcoin rewards** directly to your crypto wallet. Powered by **Visa**, it is accepted worldwide, while **Stripe’s advanced financial technology** ensures smooth transactions and security.
The card simplifies crypto adoption. Users don’t need to stake coins, open separate crypto exchange accounts, or navigate complex trading platforms. With each purchase, Bitcoin is automatically credited to the user’s Fold account, making crypto rewards seamless and easy to track.
---
### **Key Features and Benefits**
1. **Up to 3.5% Bitcoin Rewards:**
Cardholders earn **2% Bitcoin cashback** on all purchases instantly. Using a Fold Checking Account to pay off the balance can boost rewards to **3.5%**, maximizing your crypto earnings.
2. **Exclusive Retail Bonuses:**
Fold offers special Bitcoin cashback deals with top retailers such as **Amazon, Starbucks, Target, and Home Depot**. Users can earn up to **10% Bitcoin rewards** on select purchases, giving real value to everyday spending.
3. **No Complicated Requirements:**
Forget staking or crypto exchanges. Fold Bitcoin Credit Card users simply shop, and Bitcoin rewards are credited automatically. This ease-of-use makes the card appealing to beginners and experts alike.
4. **Global Acceptance:**
As a **Visa-powered card**, it works anywhere Visa is accepted. This ensures that users can earn Bitcoin whether they’re at home or traveling internationally.
5. **Secure and Reliable:**
With Stripe powering the backend, all transactions are fast, secure, and compliant with modern payment standards.
---
### **Why This Partnership Matters**
The collaboration between **Fold, Visa, and Stripe** is more than just a business deal—it’s a signal of crypto moving into mainstream finance. By offering Bitcoin rewards on a traditional credit card, these companies are bridging the gap between digital currency and everyday spending.
This partnership shows that cryptocurrency is no longer just an investment tool but a **practical medium for daily transactions**. It also encourages adoption among users who might have been hesitant about crypto due to technical complexity.
---
### **How to Get the Fold Bitcoin Credit Card**
The card was officially announced on **September 23, 2025**, and interested users can **join the waitlist** via the Fold website. Early adopters can start earning Bitcoin immediately after receiving their card, turning daily spending into a smart crypto investment.
Steps to apply:
1. Visit the Fold website.
2. Sign up for a Fold account.
3. Join the Bitcoin credit card waitlist.
4. Once approved, start using the card to earn Bitcoin rewards instantly.
---
### **Why You Should Consider This Card**
For crypto enthusiasts, the **[Fold Bitcoin Credit Card 2025](https://usa.visa.com/visa-everywhere/blog/2023/12/visa-crypto.html)** is a game-changer. It provides a simple, practical way to accumulate Bitcoin without complex trading or investment strategies. Even for beginners, it’s an effortless way to earn crypto while doing everyday shopping.
Additionally, the card opens doors for those curious about cryptocurrency but hesitant to navigate exchanges or digital wallets. By integrating Bitcoin into a credit card system, Fold is **lowering the barriers to entry** for mainstream crypto adoption.
---
The **Fold Bitcoin Credit Card 2025** represents a major step forward in merging traditional finance with cryptocurrency. With **Visa and Stripe** backing the card, users can enjoy worldwide acceptance, security, and reliability.
By turning daily purchases into Bitcoin rewards, Fold is not just offering a credit card—it’s providing a **gateway to the future of finance**. Whether you’re shopping at top retailers, paying bills, or traveling internationally, this card ensures every transaction contributes to your digital wealth.
Crypto enthusiasts and newcomers alike can benefit from this innovative approach, making the **Fold Bitcoin Credit Card 2025** a must-have for anyone looking to integrate cryptocurrency into their daily lives.
For more insights on cryptocurrency trends, financial strategies, and finance-related news from around the globe, **[follow DF Media](https://df.media/)** for up-to-date expert coverage and actionable advice
**Categories:** Bitcoin (BTC), Cryptocurrency
**Tags:** Bitcoin, Credit Card
---
### [Global Forex Market 2025: Key Updates and Trends](https://df.media/global-forex-market-2025-last-36-hours-updates/)
**Published:** September 23, 2025
**Author:** Vishnu Priya
**Excerpt:** Discover the latest Forex news and how Forex robots are shaping trading strategies in the last 36 hours.
**Content:**
The **global Forex market 2025** has seen significant volatility over the last 36 hours, influenced by central bank policies, economic data releases, and geopolitical developments. Major currencies, including the USD, Euro, CHF, and JPY, have experienced notable fluctuations, creating both opportunities and challenges for traders. This article summarizes the **Forex news and updates last 36 hours**, highlighting key currency movements and market sentiment to help traders stay informed.
---
## Forex News and Updates Last 36 Hours
### U.S. Dollar Weakens Amid Mixed Fed Signals
The U.S. dollar faced pressure as [Federal Reserve officials](https://www.federalreserve.gov/newsevents/pressreleases.htm) delivered conflicting messages on interest rate adjustments. Some policymakers advocated for gradual cuts to maintain economic stability, while others suggested more significant reductions to address broader economic risks. Consequently, the **USD weakened against major currencies**, including the Euro and Swiss franc, prompting traders to adjust their positions in key pairs.
### Canadian Dollar Moves Lower
The Canadian dollar (CAD) declined to a one-week low against the U.S. dollar, trading near 1.3820. Investors awaited remarks from Bank of Canada Governor Tiff Macklem regarding trade and monetary policy. Additionally, fluctuating oil prices contributed to the loonie’s temporary retreat, highlighting its sensitivity to commodity markets.
### Euro Experiences Volatility
The Euro remained under pressure as traders anticipated key economic indicators, such as **Purchasing Managers’ Index (PMI)** reports and U.S. inflation data. Political uncertainties in the European Union also weighed on investor confidence, keeping the EUR/USD and EUR/CHF pairs volatile.
### Emerging Market Currencies Under Pressure
Emerging market currencies, such as the Ghanaian cedi, saw depreciation, with the cedi crossing GH¢12 against the USD. This reflects broader economic challenges and fiscal concerns in emerging economies, demonstrating the sensitivity of these currencies to global market dynamics.
### Market Sentiment and Risk Appetite
Global market sentiment remained cautious, with traders closely monitoring central bank decisions, economic indicators, and geopolitical developments. Risk-on and risk-off dynamics continue to influence Forex positions, affecting currency pairs such as AUD/USD, NZD/USD, and USD/JPY.
---
## Major Currency Movements
### USD and Safe-Haven Currencies
While the USD showed some weakness, safe-haven currencies such as the Swiss franc (CHF) and Japanese yen (JPY) gained strength. Investors sought stability amid global uncertainties, resulting in notable shifts in USD/CHF and USD/JPY pairings.
### Euro Trends
The Euro’s performance remained mixed, balancing pressure from economic concerns with short-term gains due to USD weakness. Traders kept a close eye on the EUR/USD and EUR/CHF pairs, given their sensitivity to both economic data and geopolitical developments.
### Commodity-Linked Currencies
Currencies tied to commodities, such as the Australian dollar (AUD) and Canadian dollar (CAD), reacted to global commodity price movements. Oil, gold, and other commodities significantly influenced these currencies over the last 36 hours, creating trading opportunities for market participants.
## How Forex Robots Work and Impact Trading
**Forex robots** are automated trading systems that use algorithms, technical indicators, and historical price patterns to identify potential trading opportunities and execute trades automatically. They help traders reduce human error, maintain discipline, and respond to fast-moving market conditions.
By integrating a Forex robot into trading strategies, traders can analyze multiple currency pairs simultaneously, monitor market sentiment, and execute trades 24/7 without emotional bias. While not foolproof, a well-configured Forex robot can enhance efficiency, especially during volatile periods like the last 36 hours of the Forex market.
---
The **global Forex market 2025** continues to exhibit dynamic movements, driven by central bank actions, economic indicators, and geopolitical events. Staying up-to-date with **Forex news and updates last 36 hours** is crucial for traders aiming to navigate volatility effectively. Monitoring major currencies, market sentiment, and risk factors allows traders to make informed decisions and optimize their strategies in the ever-changing Forex market.
Stay tuned to[ **DF Media**](https://df.media/) for the latest insights on the **global Forex market 2025** and expert analysis to help you navigate currency trends effectively.
**Categories:** Finance, Global News
**Tags:** finance, forex, trends
---
### [US SEC Approves Generic Listing Standards for Crypto ETFs](https://df.media/us-sec-approves-generic-listing-standards-for-crypto-etfs/)
**Published:** September 19, 2025
**Author:** Daily Finance
**Excerpt:** The US SEC has approved generic listing standards for crypto ETFs, a landmark move that will allow exchanges to list multiple tokens beyond Bitcoin and Ethereum. With Solana, XRP, and Dogecoin among pending applications, the decision marks a new era of institutional access to digital assets.
**Content:**
The crypto industry has reached a major turning point. The US Securities and Exchange Commission has approved generic listing standards for crypto ETFs. This decision allows US exchanges to list cryptocurrency-backed exchange-traded products more easily, expanding access beyond Bitcoin and Ethereum.
For years, investors and institutions have been waiting for standardized rules. The change is being hailed as one of the most important developments in the financial history of digital assets.
## From individual approvals to generic standards
Previously, the SEC reviewed each crypto ETF application on a case-by-case basis. This process left hundreds of filings pending and created uncertainty about which tokens would make it to market. The new generic listing standards for crypto ETFs remove these barriers. Exchanges will now be able to list spot commodity-based ETPs linked to cryptocurrencies, provided they meet clear requirements.
According to analysts, this move signals that the SEC is ready to embrace digital assets within a regulated structure. It is expected to fast-track the listing of new crypto ETFs across a wide range of tokens.
## New tokens in the spotlight
Bitcoin and Ethereum ETFs are already active in the US, but several other cryptocurrencies are waiting in line. Solana, XRP, and Dogecoin have pending ETF applications, and with the new standards, more tokens will likely follow.
This shift will not only expand the range of investment options but also attract institutional investors who have been waiting for safer, regulated pathways to enter the crypto market.
## Multi-crypto funds enter Wall Street
The SEC has also approved the Grayscale Digital Large Cap Fund, one of the first regulated multi-crypto exchange-traded products. The fund provides exposure to Bitcoin, Ether, XRP, Solana, and Cardano within a single portfolio.
This development allows investors to diversify into multiple cryptocurrencies without managing separate holdings. It highlights how the market is evolving toward broader access and lower barriers for mainstream investors.
## The global regulatory race
The United States is leading the charge, but other countries are close behind. Japan, Australia, Canada, and Switzerland are also shaping frameworks to regulate crypto ETFs. The US continues to set the tone after introducing the Genius Act in July 2025, which established a legal structure for stablecoins.
The combination of the stablecoin law and the approval of generic listing standards for crypto ETFs signals a long-term commitment to integrating digital assets into mainstream finance.
## Impact on markets and investors
The crypto market reacted quickly to the news. Leading tokens surged overnight as traders anticipated fresh inflows from institutional investors. The precedent is clear. When the first spot Bitcoin ETF launched in January 2024, it attracted billions of dollars in inflows, ranking among the most successful ETF launches in US history.
Portfolio managers now expect the new rules to replicate that success across a broader set of tokens. Investors will have safer entry points into digital assets, while institutions gain a regulated structure to allocate capital.
## India’s position on crypto
India has taken a different approach. Cryptocurrencies are legal to buy, hold, and sell under the Income Tax Act, but gains are subject to a 30 percent tax at the time of sale. This provides clarity while limiting speculative activity.
## The road ahead
The approval of generic listing standards for crypto ETFs is a breakthrough moment. With Bitcoin and Ethereum ETFs already live, multi-crypto funds gaining traction, and tokens like Solana and XRP on the horizon, the ETF era for digital assets is set to expand rapidly.
For the first time, Wall Street and Main Street have a clear path into crypto through regulated financial products. The only question left is how quickly the momentum will build.
For more details, you can read the official [SEC announcement on exchange-traded products.](https://www.sec.gov/news/press-releases)
The SEC’s approval of generic listing standards for crypto ETFs marks a turning point in the global adoption of digital assets. By moving beyond case-by-case approvals, the US has opened the door for tokens like Solana, XRP, and Dogecoin to join Bitcoin and Ethereum in regulated investment products. This move not only reduces barriers for institutional investors but also signals a new era of mainstream access to crypto through ETFs.
**[At DF Media,](https://df.media/) we continue to cover the stories that define the future of finance around the world . Follow us for more insights and updates.**
**Categories:** Bitcoin (BTC), Cryptocurrency, Ethereum (ETH), Global News
**Tags:** Bitcoin, ETFs
---
### [Federal Reserve Rate Cut 2025 Sparks Global Market Shifts Across Bonds, Crypto ETFs, and Real Assets](https://df.media/federal-reserve-rate-cut-2025/)
**Published:** September 18, 2025
**Author:** Vishnu Priya
**Excerpt:** Federal Reserve Rate Cut 2025 triggers shifts in bonds, equities, crypto ETFs & real assets, driving BlackRock and institutional strategies.
**Content:**
When did the Federal Reserve make its move? On September 17, 2025, the U.S. central bank **cut interest rates by 25 bps** (that is, **0.25%**) — the first rate cut since December 2024 — setting the target Federal Funds rate to a range of **4.00%–4.25%**. This **rate cut by 25 bps** marks the official start of a monetary easing cycle, amid growing signs of slowing employment and economic growth.
---
### Why “Federal Reserve Rate Cut 2025” Matters
The term **Federal Reserve rate cut 2025** is quickly trending because markets are repositioning: bond yields are adjusting downward, equities are hunting for catalysts, and crypto ETFs are again being discussed as viable institutional vehicles. The **25 bps cut** doesn’t just lower borrowing costs — it signals a shift in policy stance. Chair Jerome Powell remained cautious, emphasizing that inflation remains sticky and that future cuts will be data-dependent.
Analysts are pointing out that one Federal Reserve member, Stephen Miran, dissented, preferring a larger 50 bps setback. That dissent underscores tension over how aggressively monetary policy should ease. [Reuters+1](https://www.reuters.com/business/doubleline-capital-ceo-gundlach-says-feds-25-bps-rate-cut-is-the-right-move-2025-09-17/?utm_source=chatgpt.com)
---
### Market Reactions: Bonds, Equities & Crypto
- **Bonds**: U.S. Treasury yields fell on short maturities, while longer-rates partially rose, flattening yield curves. Investors are trying to price in two or more future rate cuts by end-of-year.
- **Equities**: Initial gains post-announcement were muted. Markets seemed to have expected a cut, so the surprise element was low. Some sectors — like growth tech and infrastructure — showed stronger performance.
- **Crypto & ETFs**: With the Federal Reserve rate cut 2025, investors are reigniting interest in **crypto ETF 2025** approvals. Bitcoin, XRP and other major altcoins saw upward momentum, as regulatory paths for spot ETFs look more likely. Stablecoin liquidity also increased on expectations of more accommodative policy.
---
### Global & Institutional Flow Effects
Outside the U.S., the ripple effects are immediate:
- The **Hong Kong Monetary Authority** mirrored the rate cut with its own 25 bps cut to its base rate, aligning given the HK dollar’s peg to USD. [Reuters](https://www.reuters.com/world/asia-pacific/hong-kong-central-bank-cuts-interest-rate-tracking-fed-banks-follow-2025-09-17/?utm_source=chatgpt.com)
- In India, the rupee weakened to below 88/USD, despite domestic equities ending modestly higher. Bond yields in India rose slightly.
- Institutional investors are now looking more seriously at real assets — infrastructure, renewable energy, private credit — as fixed income returns shrink. Programs by BlackRock and asset managers to redirect flows into long-duration, inflation-protected assets are accelerating.
---
### Risks & What to Watch
- **Inflation Persistence**: Though the Fed cut rates, inflation remains above target (~2–3%), especially in food, housing. If inflation doesn’t fall, tighter policy may need to return.
- **Labor Market Weakening**: Job growth has slowed, unemployment edging up. The Fed flagged this as a key reason for the ease. But too much weakness could trigger negative sentiment.
- **Global Spillovers**: Currency volatility, capital flows into emerging markets may strain some economies. Debt servicing costs could rise for companies with dollar exposure.
---
The **Federal Reserve rate cut 2025 by 25 bps** is not just a statistical shift it’s a trigger. Markets have long awaited this signal. With bonds, equities, crypto ETFs, and institutional investors all adjusting to a new rate environment, the financial landscape is being reshaped. This cut lays the groundwork for future easing, but with caution; inflation and labour data will determine how aggressive that easing will be.
---
[Stay tuned with DF Media](https://df.media/) for daily insights as we trace how the **rate cut by 25 bps** unfolds from markets to macro decisions, and where capital moves next.
**Categories:** Banking, Finance, Global News
**Tags:** Ratecut
---
### [BlackRock GIP Buyout: $12.5B Deal Reshaping Global Infrastructure Investing](https://df.media/blackrock-gip-buyout-12-5b-deal/)
**Published:** September 17, 2025
**Author:** Vishnu Priya
**Excerpt:** BlackRock GIP Buyout marks a $12.5B leap into infrastructure. Discover how this deal is changing global investment strategies in 2025.
**Content:**
The **BlackRock GIP Buyout** has become one of the most talked-about finance stories of 2025. With a $12.5 billion acquisition of Global Infrastructure Partners (GIP), BlackRock is making a decisive push into infrastructure, alternative assets, and long-term investment strategies. This deal is more than a corporate transaction—it’s a statement on where the future of global investing is headed.
---
## Why BlackRock Targeted GIP
Global Infrastructure Partners (GIP) manages more than **$100 billion in infrastructure assets** across airports, energy networks, pipelines, and digital infrastructure. For BlackRock, the GIP acquisition was a natural extension of its strategy to diversify beyond traditional equities and bonds.
Larry Fink, BlackRock’s CEO, has long argued that **infrastructure is the asset class of the future** stable, inflation-protected, and capable of generating strong returns in both developed and emerging markets. The **BlackRock GIP Buyout** delivers on that vision by placing the firm at the center of one of the fastest-growing investment categories.
---
## What the BlackRock GIP Buyout Means for Investors
1. **Stable Cash Flows:** Infrastructure assets typically generate steady, predictable income. This appeals to pension funds and sovereign wealth funds seeking long-term stability.
2. **Inflation Hedge:** Infrastructure investments often include inflation-linked revenues, offering a natural protection for investors.
3. **Energy Transition Leadership:** With GIP’s assets, BlackRock now has a stronger role in **renewable energy, green infrastructure, and digital transformation projects.**
4. **Competitive Edge:** Rivals like Brookfield and KKR must now contend with a BlackRock that is significantly stronger in private markets.
---
## Global Impact of the BlackRock GIP Buyout
The acquisition is more than a corporate move—it is **reshaping global finance**. Here’s how:
- **For Emerging Markets:** BlackRock can now finance major infrastructure projects, from airports in Asia to renewable energy parks in Africa.
- **For Developed Economies:** The U.S. and Europe will see increased funding for modernization of outdated infrastructure, aligning with government priorities.
- **For Global Capital Flows:** Institutional investors worldwide may now channel funds through BlackRock to gain access to this diverse infrastructure portfolio.
---
## Market Analysts React
Analysts see the **BlackRock GIP Buyout** as a turning point. It reflects a **paradigm shift in asset allocation**: investors are increasingly moving away from public markets toward **private alternatives and real assets**.
According to market reports, alternatives including private equity, infrastructure, and private credit could represent **50% of BlackRock’s total revenues within the next decade**. This deal accelerates that trend and positions BlackRock as a global leader in alternative investments.
---
## The Bigger Picture
The **BlackRock GIP Buyout** demonstrates how asset managers are re-positioning in an era of economic uncertainty. Traditional stock and bond markets remain volatile, while infrastructure offers stability and long-term growth.
By making this $12.5 billion leap, BlackRock is betting that **infrastructure is the new frontier for alpha**—the strategy for outperforming in the decade ahead.
---
The **[BlackRock GIP Buyout](https://www.reuters.com/markets/deals/blackrock-buy-global-infrastructure-partners-125-bln-deal-2024-01-12/)** is more than a financial deal—it’s a signpost for where global investing is going. For institutional investors, retail investors, and policy makers, the message is clear: the future is in **infrastructure and alternatives**.
[ *Follow DFMedia* ](https://df.media/)*for more insights, analysis, and updates on global finance and business management.*
**Categories:** Banking
---
### [Shocking Reality- Who Controls Bitcoin’s Price in 2025 ? Whales, Devs, or Governments?](https://df.media/who-controls-bitcoin-price-in-2025/)
**Published:** September 16, 2025
**Author:** Ethan Brooks
**Excerpt:** Discover who controls Bitcoin’s price in 2025 whales, developers, or governments. Explore whale flows, protocol upgrades and regulations
**Content:**
## The Tug-of-War Behind Bitcoin’s Price
Who really controls Bitcoin price in 2025?
Is it the massive whale investors, the core developers shaping upgrades, or governments that set the regulatory tone?
Bitcoin is decentralized, but that doesn’t mean it’s immune to influence. In fact, its price moves reflect a constant battle between supply, demand, sentiment, and policy.
---
## Whale Power: How Large Holders Move Markets
The biggest impact still comes from whales — investors or institutions holding thousands of BTC. In 2025, the number of wallets with over 1,000 BTC rose past 1,450, signaling strong accumulation.
- **Institutional Whales:** Firms like BlackRock and MicroStrategy together now control nearly 6% of Bitcoin’s supply. Their [ETF flows](https://farside.co.uk/) alone can push the market in either direction.
- **Trading Behavior:** When whales send BTC to exchanges, it often signals incoming sell pressure. In early 2025, multiple pullbacks were traced to whale inflows, while periods of dormancy aligned with Bitcoin’s rally to $110,000.
- **Cause and Effect:** Long-term whales tend to hold, stabilizing supply, while newer entrants often cash out billions during rallies, adding volatility.
Put simply, whales don’t just invest — they set the tone for liquidity and short-term market sentiment.
---
## Developers: The Quiet Architects of Value
Developers may not trade billions in BTC, but their upgrades shape Bitcoin’s long-term utility and, in turn, its price.
- **Past Examples:** SegWit in 2017 and Taproot in 2021 laid the groundwork for scalability, privacy, and innovation. Each coincided with new waves of adoption and price growth.
- **New Upgrades in 2025:** Talk of covenants, OP\_CAT, and programmable spending has created optimism about Bitcoin’s future use cases. With over 3,200 developer commits in the past year, activity is at its highest since 2021.
- **Impact:** Whenever the network becomes more functional, investors price in new potential. That optimism fuels demand.
Developers don’t directly move the market daily, but their long-term influence often sparks entire bull cycles.
---
## Governments: Not in Control, but Still in Command
Bitcoin may be borderless, but governments still set the stage.
- **ETF Approvals:** The 2024 U.S. approval of spot Bitcoin ETFs sent the price above $73,000, unlocking billions in institutional flows.
- **Regulatory Uncertainty:** The EU’s proposals around self-custodial wallets and surveillance temporarily shook investor confidence, causing brief sell-offs.
- **Macroeconomic Levers:** From Federal Reserve rate cuts to China’s mining crackdowns, policy shifts ripple through BTC markets globally.
Governments can’t ban Bitcoin out of existence, but they can slow adoption or accelerate demand with one policy stroke.
---
## Investor Sentiment: The Invisible Force
Beyond whales, devs, and regulators, sentiment plays a decisive role. Bitcoin often trades like a “belief asset.”
- Retail euphoria in early 2025 led to parabolic runs.
- Institutional caution triggered sharp retreats.
- Even narratives around AI, global instability, or inflation shaped portfolio flows into Bitcoin.
This psychological layer makes Bitcoin both volatile and resilient, adding another dimension of influence.
---
## Predictions for 2025 and Beyond
Looking forward, Bitcoin’s price action will likely remain a **tug-of-war**:
1. **Whales** will dominate liquidity during high-volatility phases.
2. **Developers** will quietly add value through network upgrades.
3. **Governments** will control the regulatory environment that determines institutional flows.
4. **Investors** — retail and institutional — will continue to drive sentiment, the final spark for every rally.
The reality? No one fully controls Bitcoin. It is shaped by many forces acting at once.
---
## FAQs
**1. Do whales still dominate Bitcoin in 2025?**
Yes. The top institutions and whales hold close to 6% of supply and remain the biggest movers during short-term volatility.
**2. Can governments ban Bitcoin completely?**
Not effectively. Even in countries with restrictions, demand survives through OTC markets, VPNs, and offshore exchanges.
**3. Do developer upgrades directly impact price?**
Yes, but usually indirectly. Upgrades like Taproot boosted optimism, driving long-term adoption and higher valuations.
---
## Conclusion: Shared Control, Decentralized Power
So, who controls Bitcoin price in 2025? The truth is that no single player does. Whales move liquidity, developers shape adoption, and governments create the rules of the game. Together, they form a cycle of influence that keeps Bitcoin both unpredictable and powerful.
---
For deeper insights on finance, crypto, and global markets, **[follow DF](https://df.media/) Media** for daily updates.
Curious how stablecoins are reshaping global finance?
Don’t miss our article:
[Why Stablecoins Are Becoming the Backbone of the Global Economy.](https://df.media/stablecoins-in-global-payments-2025-banking-2-0/)
**Categories:** Bitcoin (BTC), Global News
**Tags:** Bitcoin
---
### [Tether USAT Launch: America’s First Fully Regulated Stablecoin 2025](https://df.media/tether-usat-launch-regulated-stablecoin-2025/)
**Published:** September 14, 2025
**Author:** Vishnu Priya
**Content:**
# **A Turning Point for Crypto and the U.S. Dollar**
For years, Washington has debated whether stablecoins are a **financial innovation or a systemic risk**. The crypto industry has often been painted as the “Wild West,” a space where billions move across borders without clear oversight. That narrative changed dramatically this week with the **Tether USAT Launch**.
In partnership with **Anchorage Digital Bank**, Tether has introduced **USAT**, the **first fully regulated U.S. stablecoin**. Unlike earlier versions of dollar-backed tokens, USAT is designed from the ground up to comply with America’s new **GENIUS Act** — a law that finally sets the rules for how stablecoins can operate in one of the world’s most important markets.
The move isn’t just about technology. It’s about **trust, compliance, and the future of money**. And it signals that digital assets are no longer living in the shadows of regulation — they are becoming part of mainstream finance.
---
## Tether USAT Launch Explained
The **USAT stablecoin** is pegged 1:1 to the U.S. dollar, promising stability in a volatile crypto market. What makes this launch historic is the **legal framework behind it**:
- **GENIUS Act compliance** ensures that reserves and audits are transparent.
- **Anchorage Digital Bank**, a U.S.-chartered crypto bank, is the issuer, giving the token federal credibility.
- **Availability restricted to U.S. residents and institutions**, a move designed to reassure lawmakers and regulators that the coin won’t fuel global shadow banking.
This is a **digital dollar with regulation baked in**.
---
## Why the Tether USAT Launch Matters
The **cause-and-effect chain** of this launch is already visible across Wall Street and Capitol Hill:
1. **Market Legitimacy** – USAT shows that stablecoins can exist within U.S. law, not outside it.
2. **Institutional Adoption** – U.S. banks and corporates may now consider stablecoins as safe, usable instruments for payments and liquidity management.
3. **Competitive Pressure** – Rivals like **Circle (USDC)** and **PayPal’s PYUSD** will face pressure to match USAT’s compliance-driven approach.
4. **Geopolitical Implications** – The U.S. dollar already dominates global trade. By extending that dominance into the digital sphere, the U.S. strengthens its financial reach.
As one crypto policy analyst put it:
> “The Tether USAT Launch is more than a product launch. It’s America’s first attempt to make the digital dollar real — and legal.”
---
## Wall Street and Washington Take Notice
The reaction has been immediate. **Investors** see USAT as a bridge between crypto markets and regulated banking. **Lawmakers** see it as proof that crypto can adapt to legal boundaries.
Anchorage Digital Bank executives described the launch as a “**compliance-first design**,” highlighting that reserves will be independently verified.
Meanwhile, crypto traders are speculating how quickly USAT will be listed on major U.S. exchanges. If adoption scales, **USAT could rival not just other stablecoins but existing payment systems like ACH transfers and even certain bank settlement layers**.
---
## The Bigger Picture: Cause and Effect of USAT Stablecoin 2025
- **Cause:** U.S. government passed the GENIUS Act.
- **Effect:** Tether worked with Anchorage to create the first compliant stablecoin.
- **Cause:** Market uncertainty around unregulated tokens.
- **Effect:** Institutions now have a legally backed option.
- **Cause:** Stablecoins already power billions in transactions.
- **Effect:** USAT could expand their use into payroll, treasury, and cross-border trade — this time under Washington’s blessing.
---
## Industry Outlook: Could USAT Set the Global Standard?
Financial analysts are split. Optimists argue USAT could become the **“gold standard” of stablecoins**, forcing competitors worldwide to raise compliance levels. Skeptics counter that overregulation may limit adoption, making USAT slower to scale compared to global, unregulated peers.
Still, the **symbolism is clear**: for the first time, the U.S. is saying “yes” to stablecoins but only on its terms.
---
## FAQs About the Tether USAT Launch
**1. What is the Tether USAT Launch?**
The Tether USAT Launch is the introduction of **USAT**, America’s first fully regulated stablecoin. Issued by Anchorage Digital Bank, it complies with the GENIUS Act and is pegged 1:1 to the [U.S. dollar](https://www.reuters.com/finance).
**2. How is USAT different from other stablecoins?**
Unlike USDC or USDT, **USAT is legally restricted to U.S. markets**, fully audited, and overseen by a federally chartered crypto bank. It is the first to operate under direct U.S. regulation.
**3. Why does the Tether USAT Launch matter for global finance?**
It could reshape how digital dollars function worldwide. By creating a model of compliance, the U.S. sets the tone for how stablecoins may be regulated in Europe, Asia, and beyond.
---
## Conclusion: A Defining Moment in Digital Finance
The **Tether USAT Launch** is more than a corporate milestone. It is a **statement about the future of money**. By introducing a fully regulated stablecoin tied to the U.S. dollar, Tether and Anchorage Digital Bank have taken a concept once criticized as risky and made it compliant, credible, and potentially transformative.
This launch could pave the way for **wider institutional adoption** of stablecoins and reshape America’s role in the global digital economy. If successful, it won’t just be remembered as another crypto token — it will be remembered as the moment the **digital dollar went legit**.
👉 Follow [DFmedia](https://df.media) for the latest insights on **stablecoins, global finance, and digital innovation**.
**Categories:** Banking
---
### [Nasdaq’s SEC Proposal to Trade Tokenized Securities: What Investors Must Know](https://df.media/nasdaq-tokenized-securities-sec-proposal/)
**Published:** September 11, 2025
**Author:** Vishnu Priya
**Excerpt:** Nasdaq has filed with the SEC to enable trading of tokenized securities alongside traditional stocks.
**Content:**
Nasdaq, one of the world’s most recognized stock exchanges, has officially filed with the U.S. Securities and Exchange Commission (SEC) to allow trading of **tokenized securities**. This move, which comes at a time when blockchain adoption is reshaping financial markets, has sparked global attention. If approved, it could pave the way for a new era of investing where traditional stocks and tokenized assets are listed side by side.
But what exactly are tokenized securities, why is Nasdaq taking this step now, and what does it mean for investors and regulators? Let’s break down everything you need to know.
---
### What Are Tokenized Securities?
Tokenized securities are traditional financial assets such as stocks, bonds, or real estate interests that are converted into digital tokens on a blockchain. Each token represents ownership in the underlying asset, but trading takes place in a digital ecosystem.
Unlike cryptocurrencies such as Bitcoin or Ethereum, tokenized securities are **regulated investment products** tied directly to real-world value. This makes them attractive to institutions looking for efficiency without losing compliance.
---
### Details of Nasdaq’s SEC Proposal
According to filings reported by [Reuters](https://www.reuters.com/business/finance/nasdaq-makes-push-launch-trading-tokenized-securities-2025-09-08/?utm_source=chatgpt.com), Nasdaq is seeking regulatory approval to launch tokenized securities trading on its main exchange.
The proposal suggests:
- Listing of tokenized versions of publicly traded stocks.
- Integration with existing trading infrastructure to ensure investor protection.
- A hybrid system where traditional brokers and digital wallets could coexist.
If approved, this would mark one of the first instances of a major U.S. exchange bridging traditional equities with blockchain-based assets.
---
### Why Now? The Global Context
Nasdaq’s timing is not accidental. Several factors are driving this decision:
1. **Institutional Demand:** Global investors are increasingly exploring blockchain-based products.
2. **Efficiency:** Tokenized securities promise faster settlement times compared to traditional T+2 systems.
3. **Competition:** With European and Asian markets experimenting with tokenization, Nasdaq is moving to stay ahead.
4. **Regulatory Clarity:** The SEC has recently signaled more openness to digital asset structures, paving the way for innovation.
---
### Benefits for Investors
If the SEC approves Nasdaq’s proposal, investors could experience:
- **24/7 Trading Access:** Tokenized assets can be traded beyond standard market hours.
- **Fractional Ownership:** Investors can buy smaller portions of expensive stocks, improving accessibility.
- **Global Reach:** Digital platforms make it easier for cross-border investors to participate.
- **Increased Liquidity:** Tokenized markets could unlock liquidity in traditionally illiquid asset classes.
---
### Risks & Challenges
Despite the excitement, there are significant risks:
- **Regulatory Uncertainty:** The SEC and other regulators still need to define rules clearly.
- **Technology Risks:** Cybersecurity and blockchain integrity remain concerns.
- **Market Volatility:** As with all innovations, early markets can be highly volatile.
- **Adoption Curve:** It may take years before institutional investors and retail traders adopt tokenized securities at scale.
---
### The Bigger Picture: Future of Markets
Tokenization is not just about Nasdaq. It signals a larger transformation in finance, sometimes called **Banking 2.0**, where assets from equities to real estate could be digitized and traded globally.
Other exchanges in Europe and Asia have already started pilot projects. If Nasdaq succeeds, it will accelerate the adoption of tokenization worldwide, potentially reducing settlement costs and opening financial markets to billions of new participants.
For a deeper dive into how tokenization is reshaping financial markets, see our guide to blockchain in finance .
---
Nasdaq’s SEC proposal to trade tokenized securities is more than just a headline — it’s a sign of how quickly financial markets are evolving. For investors, this could mean new opportunities, new risks, and a future where digital and traditional finance blend seamlessly.
The coming months will be crucial as regulators review the filing. Whether tokenized securities become a core part of mainstream investing will depend on how well Nasdaq can balance innovation with compliance.
[*Follow DF Media*](https://df.media/) *for the latest insights on digital finance, innovation, and the future of money.*
**Categories:** Finance
**Tags:** securities
---
### [How Global Finance Consortiums Are Revolutionizing Emerging Markets: Asia, Africa & Latin America in 2025](https://df.media/top-5-finance-consortiums-market-innovation/)
**Published:** September 10, 2025
**Author:** Maya Pise
**Excerpt:** Discover how finance consortiums in Asia, Africa, and Latin America are transforming investment, technology, and financial inclusion in emerging markets.
**Content:**
Emerging markets are shaping the future of global finance. From Asia’s tech-driven hubs to Africa’s rapidly growing economies and Latin America’s investment potential, these regions are attracting massive attention. At the center of this transformation are **finance consortiums** collaborative networks of banks, investors, and tech firms pooling resources to drive large-scale projects. In 2025, these consortiums are not just funding businesses; they are enabling technological growth, financial inclusion, and new opportunities for global investors.
- [What is a Finance Consortium?](#what-is-a-finance-consortium)
- [Top 5 Finance Consortiums in Emerging Markets](#top-5-finance-consortiums-in-emerging-markets)
- [1. Asia Finance Consortium (AFC)](#1-asia-finance-consortium-afc)
- [2. Africa Development Consortium (ADC)](#2-africa-development-consortium-adc)
- [3. Latin America Investment Network (LAIN)](#3-latin-america-investment-network-lain)
- [4. Pan-Asian Sustainable Fund (PASF)](#4-pan-asian-sustainable-fund-pasf)
- [5. Africa-Asia Strategic Finance Alliance (AASFA)](#5-africa-asia-strategic-finance-alliance-aasfa)
- [Comparisons & Trends 2024–2025](#comparisons-trends-2024-2025)
- [Key Benefits for Investors & Entrepreneurs](#key-benefits-for-investors-entrepreneurs)
- [Case Studies](#case-studies)
- [FAQs](#fa-qs)
---
## **What is a Finance Consortium?**
A **finance consortium** is a structured partnership where multiple financial institutions collaborate to fund large projects or investments. Unlike a single investor approach, consortiums reduce risk, share resources, and bring together diverse expertise.
**Key Features:**
- **Governance:** Typically managed by a board representing all consortium members.
- **Investment Strategy:** Pooling capital to finance large-scale projects in sectors like fintech, infrastructure, and renewable energy.
- **Risk Mitigation:** Shared investments minimize exposure for individual participants.
- **Technology Integration:** Use of AI, blockchain, and digital finance platforms to streamline operations.
In simple terms, think of a consortium as a “team investment” where multiple players work together to make high-impact investments possible.
---
## **Top 5 Finance Consortiums in Emerging Markets**
### **1. Asia Finance Consortium (AFC)**
- **Focus:** Fintech, green energy, and infrastructure
- **Members:** Major banks from Singapore, India, and Japan
- **Impact:** Supported over $5B in investments in 2024 alone, including solar energy and digital payment platforms.
- **Strategy:** Leverages AI for risk assessment and investment tracking
### **2. Africa Development Consortium (ADC)**
- **Focus:** Agriculture, tech startups, and mobile finance
- **Members:** South African, Nigerian, and Kenyan banks + private investors
- **Impact:** Enabled 10,000+ small businesses to access funding in 2024
- **Strategy:** Mobile-first financial solutions to increase inclusion
### **3. Latin America Investment Network (LAIN)**
- **Focus:** Infrastructure, logistics, and fintech
- **Members:** Brazil, Mexico, and Chile banks with international partners
- **Impact:** Boosted cross-border trade and digital banking adoption in emerging cities
- **Strategy:** Public-private partnerships to scale projects faster
### **4. Pan-Asian Sustainable Fund (PASF)**
- **Focus:** Renewable energy, smart cities, and AI tech
- **Impact:** Funded $3B in green projects across Southeast Asia
- **Strategy:** Collaborates with government agencies to ensure regulatory compliance
### **5. Africa-Asia Strategic Finance Alliance (AASFA)**
- **Focus:** Tech transfer, industrial projects, and e-commerce platforms
- **Impact:** Created over 50,000 jobs in 2024 in cross-continental ventures
- **Strategy:** Blends private capital with international grants for maximum leverage
---
## **[Comparisons & Trends 2024–2025](http://World%20Bank’s%20financial%20sector%20insights)**
- **Technology Adoption:** Use of AI, blockchain, and digital finance platforms is rising 30% YoY.
- **ROI Trends:** **ROI Trends:** Emerging market consortiums report 12–18% average ROI, outperforming many traditional funds. According to the [World Bank’s financial sector insights](https://www.worldbank.org/en/topic/financialsector), access to global capital and inclusive finance policies are accelerating growth in Asia, Africa, and Latin America.
- **Cross-Regional Collaboration:** Asia-Africa-Latin America partnerships are increasing, driven by shared infrastructure projects.
- **Sector Focus:** Renewable energy, fintech, and logistics dominate consortium investments.
---
## **Key Benefits for Investors & Entrepreneurs**
- **High-Impact Investment:** Access large projects otherwise unattainable individually
- **Risk Diversification:** Shared capital reduces financial exposure
- **Global Networks:** Collaboration with international banks and investors
- **Innovation & Inclusion:** Supports tech adoption and financial inclusion in emerging markets
---
## **Case Studies**
- **Solar Energy in India (AFC):** Funded a $1B solar project providing electricity to 5M homes.
- **Mobile Banking in Kenya (ADC):** Enabled microloans for 200,000 small businesses.
- **Cross-Border Logistics in Brazil (LAIN):** Streamlined e-commerce supply chains across Latin America.
---
## **FAQs**
**1. Are finance consortiums safe for individual investors?**
Yes, pooling resources reduces risk while enabling exposure to large-scale projects.
**2. How can entrepreneurs access consortium funding?**
By pitching projects to consortium members or joining innovation programs they sponsor.
**3. Do consortiums focus only on big corporations?**
No, many target SMEs, startups, and local businesses in emerging markets.
**4. How is technology used in consortium investments?**
AI, blockchain, and fintech platforms streamline risk assessment and funding allocation.
**5. Can cross-continental investments work?**
Yes, partnerships like AASFA illustrate successful Africa-Asia collaborations.
---
Global finance consortiums are transforming emerging markets in Asia, Africa, and Latin America. For investors and entrepreneurs, they offer unmatched opportunities, technological leverage, and shared expertise. To stay ahead in this dynamic landscape, follow the latest trends and insights at **[DF Media](https://df.media/)** your hub for finance, innovation, and emerging market growth
**Categories:** Finance
**Tags:** Consortium, Emerging Markets
---
### [Eurozone Investor Confidence Plunges: 5 Shocking Signals for September 2025](https://df.media/eurozone-sentiment-plunge-lowest-since-april/)
**Published:** September 9, 2025
**Author:** Vishnu Priya
**Excerpt:** Eurozone sentiment hits its lowest level since April, signaling rising recession fears in 2025. Discover why confidence is collapsing across Europe
**Content:**
Eurozone investor confidence has plunged in September 2025, dropping to its lowest level since April. This sudden fall in **Eurozone investor confidence** highlights renewed concerns about slowing growth, trade tensions, and the overall health of the Eurozone economy.
According to the latest Sentix survey, investor morale declined sharply from –3.7 in August to **–9.2 in September**. Analysts say the data paints a worrying picture, especially as both current conditions and future expectations deteriorated at the same time.
---
## Germany’s Deepening Crisis
Germany, the largest economy in the eurozone, has emerged as the weakest link. Confidence levels there sank to **–22.1**, underscoring how heavily exposed the country is to industrial weakness and international trade pressures. With new **U.S. tariffs** hitting German exports, manufacturers face reduced demand just as energy costs remain unstable.
For years, Germany’s industrial strength has been the engine behind European growth. But now, falling factory orders and weak consumer demand are dragging down **Eurozone investor confidence** across the region. If Berlin cannot stabilize its economy, the eurozone as a whole may struggle to regain momentum.
---
## ECB’s Tightrope on Inflation
The European Central Bank (ECB) now faces a tough balancing act. Inflation in the eurozone remains above target, leaving limited space for interest rate cuts. At the same time, falling **Eurozone investor confidence** calls for supportive measures to prevent a deeper downturn.
ECB policymakers have signaled caution, emphasizing stability over aggressive stimulus. Yet many economists argue that without swift action, weaker confidence could spread from financial markets into real economic activity. Businesses may slow investment, households could cut back on spending, and growth could stall further.
👉 [Read the ECB’s latest policy statement here](https://www.ecb.europa.eu/home/html/index.en.html)
---
## Investor Sentiment and Market Reaction
Markets reacted quickly to the slump in **Eurozone investor confidence**. The euro lost ground against the U.S. dollar, reflecting investor fears of weaker returns in Europe. Stock exchanges across the region opened with mixed results, with banks and industrial companies suffering the sharpest declines.
Bond yields also dipped as investors moved into safer assets. Analysts noted that the shift signals caution about Europe’s near-term economic outlook. With sentiment now firmly in negative territory, traders expect more volatility in the weeks ahead.
---
## Global Spillover Effects
Weakness in **Eurozone investor confidence** has implications far beyond Europe. Asian economies such as South Korea and Japan, which rely on exports to the eurozone, could face reduced demand. Meanwhile, investors are increasingly turning their attention to China’s bond market, where yields remain relatively stable.
In North America, analysts warn that prolonged European weakness could weigh on multinational companies that depend on the eurozone for a significant portion of their revenues. This makes the eurozone’s confidence crisis a truly global concern.
---
## Structural Challenges Ahead
Beyond immediate concerns, the eurozone continues to grapple with long-term challenges. Aging populations, reliance on imported energy, and uneven growth between northern and southern states all contribute to fragile sentiment.
Falling **Eurozone investor confidence** may be a symptom of these deeper issues. Unless structural reforms are introduced, temporary rebounds in sentiment could prove short-lived.
---
## What to Expect Next
The months ahead will be decisive for Europe. If confidence fails to recover, businesses may delay investment decisions, and consumers could rein in spending. This combination risks tipping the eurozone into recession during the winter months.
Policymakers face growing calls for targeted fiscal support, especially in Germany and France. However, political divisions across the eurozone may complicate the rollout of coordinated measures. For now, investors remain cautious.
“Sentiment is often the first signal,” one Frankfurt-based strategist explained. “If **Eurozone investor confidence** doesn’t stabilize, it could drag the real economy down with it.
**Categories:** Finance, Global News
---
### [Stablecoins in Global Payments: The Powerful 2025 Breakthrough-Banking 2.0](https://df.media/stablecoins-in-global-payments-2025-banking-2-0/)
**Published:** September 5, 2025
**Author:** Daily Finance
**Content:**
## Stablecoins in Global Payments: The 2025 Modernization Shift
**Stablecoins in global payments are transforming the financial world in 2025.** They are faster, cheaper, and more transparent than traditional systems, making them a powerful driver of Banking 2.0. Backed by adoption from PayPal, JPMorgan, and new regulations, stablecoins are moving beyond crypto hype into mainstream finance.
---
## What Are Stablecoins in Global Payments and Why They Matter
Stablecoins in global payments are digital currencies pegged to stable assets like the US dollar or euro. Unlike volatile cryptocurrencies, their value doesn’t swing wildly, making them suitable for real-world use.
For international transactions, stablecoins cut through the slow and expensive systems of banks. Sending money across borders often takes days and costs up to 7% in fees, but stablecoins settle instantly with minimal costs. This makes them ideal for trade, remittances, and financial inclusion.
- [Stablecoins in Global Payments: The 2025 Modernization Shift](#what-are-stablecoins-and-why-do-they-matter-in-2025)
- [What Are Stablecoins in Global Payments and Why They Matter](#what-are-stablecoins-in-global-payments-and-why-they-matter)
- [How Stablecoins in Global Payments Drive Modernization](#how-stablecoins-in-global-payments-drive-modernization)
- [Stablecoins Driving Global Payment Modernization](#stablecoins-driving-global-payment-modernization)
- [PayPal, JPMorgan, and Institutional Adoption](#pay-pal-jp-morgan-and-institutional-adoption)
- [The Role of Global Regulations in Stablecoin Growth](#the-role-of-global-regulations-in-stablecoin-growth)
- [Will Stablecoins Replace or Bridge Traditional Banking?](#will-stablecoins-replace-or-bridge-traditional-banking)
- [Final Thoughts](#final-thoughts)
---
## How Stablecoins in Global Payments Drive Modernization
The modernization of payments is clear. Stablecoins allow:
- **Speed**: Instant settlement in seconds.
- **Transparency**: Blockchain records are visible and verifiable.
- **Cost-efficiency**: Lower fees compared to SWIFT or credit card networks.
- **Inclusion**: Billions of unbanked people can join the financial system with just a mobile phone.
According to the [Bank for International Settlements](https://www.bis.org?utm_source=chatgpt.com), digital currencies like stablecoins could reduce remittance costs by up to 50%, benefiting millions of families worldwide.
In 2025, stablecoins are emerging as a cornerstone of **Banking 2.0** a system where finance becomes faster, borderless, and accessible to more people worldwide. Their promise of **low-cost cross-border payments, real-time settlement, and transparency** makes them a major driver in the modernization of global payments.
---
## Stablecoins Driving Global Payment Modernization
Today’s international payment system is expensive and slow. Sending money across borders can take days and involve high transaction fees. Stablecoins solve this problem by allowing instant transfers that settle in seconds with minimal costs.
For businesses, this means cheaper global trade. For individuals, especially migrant workers sending remittances home, it means keeping more of their hard-earned money. In fact, analysts from the [Bank for International Settlements](https://www.bis.org?utm_source=chatgpt.com) suggest that digital currencies, including stablecoins, could cut cross-border remittance fees by up to 50%.
The benefits extend beyond speed and cost. Because stablecoins operate on public blockchains, every transaction is **transparent, traceable, and verifiable** — improving trust in the system.
---
## PayPal, JPMorgan, and Institutional Adoption
Institutional adoption is pushing stablecoins into the mainstream. PayPal launched its own stablecoin in 2023, becoming the first major financial giant to do so. JPMorgan, one of the world’s largest banks, has also developed its **JPM Coin** for instant settlement between clients.
These moves signal that stablecoins are no longer niche crypto tools — they are being woven directly into the world’s financial infrastructure. When companies of this scale adopt new technology, it accelerates trust, regulation, and global use cases.
---
## The Role of Global Regulations in Stablecoin Growth
One of the biggest challenges for stablecoins has been regulation. Governments have been cautious, worried about risks such as money laundering, financial instability, or lack of consumer protection.
But in 2025, the picture is shifting. The European Union has rolled out its **MiCA (Markets in Crypto-Assets) framework**, the United States is debating its **Stablecoin Act**, and Asian financial hubs like Singapore are creating clear pathways for licensed issuers.
Clear rules are essential because they build trust for both consumers and institutions. With regulatory green lights, stablecoins can scale safely and securely, enabling them to become a critical part of the global payment ecosystem.
---
## Will Stablecoins Replace or Bridge Traditional Banking?
The big question is whether stablecoins will **replace banks entirely** or act as a bridge between traditional finance and Web3.
- **Replacement argument:** Stablecoins can handle global transfers faster and cheaper than legacy rails like SWIFT. In theory, they could bypass banks altogether.
- **Bridge argument:** Banks and fintechs may use stablecoins as the underlying technology for payments, while consumers continue using familiar apps and accounts.
The likely outcome is a **hybrid model**: stablecoins will become the invisible infrastructure powering payments, while traditional banking interfaces adapt to use them in the background.
---
## Final Thoughts
Stablecoins are no longer a crypto experiment — they are reshaping the global financial system. By 2025, they are:
- **Faster** than bank wires
- **Borderless** compared to legacy systems
- **Inclusive** for billions of unbanked people
With PayPal, JPMorgan, and regulators backing adoption, stablecoins are moving from fringe innovation to **mainstream payment infrastructure**. Whether they replace or complement banks, one thing is certain: they are the backbone of modern finance.
👉[ *Follow DF Media*](https://df.media/) *for the latest insights on digital finance, innovation, and the future of money.*
- [Bitcoin Holds Above $82K as Big Tech Earnings Rock Wall Street This Week](https://df.media/bitcoin-price-this-week-big-tech-earnings/)
- [CPI October 14 2026 Goldman Sachs Beats JPMorgan Misses Revenue](https://df.media/cpi-october-14-2026-goldman-sachs-jpmorgan-earnings/)
- [Markets Today October 12 2026 Bank Earnings Oil and CPI Week](https://df.media/markets-today-october-12-2026/)
- [How Geopolitics Drives Oil and Energy Prices Higher: The Investor’s Essential Guide](https://df.media/how-geopolitics-affects-oil-energy-prices/)
- [OpenAI Raises 30 Billion at 1.4 Trillion Valuation: Why AI Stocks Just Crashed](https://df.media/openai-30-billion-valuation-ai-stocks-crash-october-2026/)
**Categories:** Banking, Global News
**Tags:** Stablecoins
---
### [U.S. Dollar Holds Firm Above 98 as Traders Brace for ISM Services PMI](https://df.media/u-s-dollar-index-holds-above-98-global-forex-news/)
**Published:** September 4, 2025
**Author:** Daily Finance
**Content:**
The **U.S. Dollar Index (DXY)** remained steady on Thursday, holding above the 98.00 mark, as traders and investors worldwide waited for the release of the **ISM Services Purchasing Managers’ Index (PMI)**. The report, a key barometer of U.S. economic health, is expected to provide fresh clues on whether the Federal Reserve will maintain its current interest rate stance or shift toward a more accommodative policy.
---
## Why the ISM Services PMI Matters
The **ISM Services PMI** is widely followed because it reflects business activity in the services sector, which makes up nearly **80% of the U.S. economy**. From retail and transportation to healthcare and finance, the services sector drives U.S. growth.
- A **reading above 50** indicates expansion, while anything below signals contraction.
- A **strong print** would suggest economic resilience, reinforcing expectations that the Fed can hold interest rates higher for longer.
- A **weaker-than-expected print** could reignite speculation that policymakers may soon pivot toward rate cuts to sustain growth.
Economists expect the August PMI to show continued resilience but at a slower pace, reflecting lingering inflation pressures and cautious consumer spending.
---
## Dollar Strength in Global Context
The dollar has maintained its dominance against most major currencies in recent sessions, thanks to:
1. **Safe-Haven Appeal**: Rising geopolitical tensions in Asia and the Middle East have driven investors toward the greenback as a safe-haven asset.
2. **Higher Treasury Yields**: The 10-year U.S. Treasury yield has edged above 4.3%, attracting capital inflows and adding support to the dollar.
3. **Fed’s Policy Outlook**: With inflation still above the Fed’s 2% target, markets expect the central bank to keep rates elevated well into 2026.
As a result, the **euro** slipped closer to 1.07 against the dollar, while the **Japanese yen** hovered near the sensitive 150 level. The yen’s weakness has sparked renewed speculation that Japanese authorities may intervene to stabilize their currency.
---
## What Analysts Are Saying
Market strategists emphasize that the dollar’s stability is a sign of strong underlying demand for U.S. assets, but warn that volatility could spike once the ISM data is released.
“Investors are in a holding pattern,” said one senior FX strategist. “A stronger-than-expected PMI could push the dollar index toward the 99.00 level, while a disappointing print may trigger profit-taking and revive dovish Fed bets.”
This cautious tone is reflected in thin trading volumes across global forex markets, as traders avoid taking large positions ahead of the report.
---
## Global Implications of a Strong Dollar
A dollar that stays strong or strengthens further has ripple effects across global markets:
- **Emerging Markets**: Many developing economies rely on dollar-denominated borrowing. A firmer greenback increases their repayment burden, squeezing fiscal balances.
- **Commodities**: Assets like gold and oil, priced in dollars, often face downward pressure when the U.S. currency appreciates. Gold has retreated slightly in recent sessions, while crude oil has struggled to break higher despite supply concerns.
- **Global Corporations**: Multinational companies listed in the U.S. face currency headwinds when translating overseas revenues back into dollars, potentially impacting earnings growth.
For global investors, the dollar’s trajectory is not just a U.S. story but a **worldwide market driver**.
---
## Looking Ahead: PMI as a Turning Point
The ISM Services PMI is one of the final pieces of critical data before the Federal Reserve’s next policy meeting. Together with recent labor market figures and inflation reports, it could tilt the Fed’s decision-making in either direction.
- **If PMI surprises to the upside** → the Fed may feel emboldened to maintain or even tighten policy, extending dollar strength.
- **If PMI misses expectations** → the market may lean toward earlier rate cuts, weakening the dollar in the near term.
Either way, today’s release will likely set the tone for global markets in the coming weeks.
The U.S. dollar’s firm grip above the **98.00 threshold** highlights investor caution ahead of the ISM Services PMI report. With the Federal Reserve’s next steps still uncertain, this data point could determine not only the dollar’s short-term trajectory but also broader global financial trends.
For businesses, traders, and policymakers alike, the takeaway is clear: **all eyes are on the PMI numbers.** Whether the data strengthens or undermines the case for a higher-for-longer Fed, the dollar’s moves in the hours ahead could ripple across currencies, commodities, and capital markets worldwide.
**Categories:** Finance, Global News
**Tags:** U.S. Dollar
---
### [5 Ways the World Gold Council’s Digital Gold Initiative Will Transform Gold Trading](https://df.media/digital-gold-initiative-2025/)
**Published:** September 3, 2025
**Author:** Daily Finance
**Content:**
The **Digital Gold Initiative** by the World Gold Council (WGC) is poised to revolutionize the gold market in 2025. As global inflation concerns rise, this initiative introduces digital gold assets that enhance transparency, liquidity, and efficiency for investors and financial institutions. By leveraging blockchain technology, the initiative promises to modernize one of the world’s most traditional financial markets, offering new opportunities for institutional investors, banks, and fintech innovators.
---
## What is the Digital Gold Initiative?
The **Digital Gold Initiative** also referred to as **Gold247™** aims to digitize gold ownership and trading. At its core, the project introduces **Pooled Gold Interests (PGIs)**, a digital representation of physical gold stored in segregated accounts under a trust structure.
PGIs allow for **fractional ownership** of gold, enabling smaller investors and financial institutions to access and transfer gold digitally for collateral and margin purposes. This system not only increases liquidity but also strengthens market transparency, making gold a more functional financial asset in the digital age.
---
## How the Initiative Will Transform Gold Trading
### 1. Fractional Ownership Through PGIs
Traditionally, gold trading has required large, indivisible holdings, limiting participation. PGIs allow investors to own fractions of gold digitally, unlocking access for a broader range of market participants.
### 2. Enhanced Transparency in Gold Transfers
Blockchain technology underpins the initiative, enabling **real-time tracking of digital gold transfers**. This improves the integrity of trades and reduces settlement risks, a major step forward in a market often criticized for opacity.
### 3. Efficiency for Banks and Financial Institutions
Digitizing gold enables banks to leverage it more effectively on balance sheets. Digital gold can be transferred seamlessly between counterparties, reducing reliance on physical settlement and enabling **faster, safer collateralization**.
### 4. Market Adoption Across Major Financial Hubs
The initiative will be piloted in London’s $900 billion bullion market in 2026, involving major banks and trading houses. While adoption may face resistance from the traditionally conservative over-the-counter (OTC) market, its success could set a global precedent.
### 5. A New Era of Investor Opportunities
The **Digital Gold Initiative** offers investors a chance to participate in gold markets with **lower barriers to entry**, greater flexibility, and increased transparency. Financial institutions can create innovative investment products, including gold-backed digital instruments for retail and institutional clients.
---
## Potential Challenges and Market Adoption
While promising, the initiative faces challenges:
- **Regulatory scrutiny:** Digital gold assets may require new frameworks for taxation, compliance, and reporting.
- **Conservative market culture:** London’s OTC gold market is historically resistant to rapid change.
- **Technology adoption:** Full-scale implementation requires robust digital infrastructure and trust in blockchain security.
Despite these hurdles, the benefits of efficiency, transparency, and accessibility make adoption likely in the medium to long term.
---
## Impact on Global Finance and Investment
The **Digital Gold Initiative** has far-reaching implications:
- **Institutional investors** gain access to fractional gold ownership and efficient collateral management.
- **Banks and fintechs** can leverage digital gold for innovative financial products.
- **Global finance** benefits from a more transparent, liquid, and integrated market.
As central banks and financial institutions explore digital assets, gold remains a key hedge against inflation, making this initiative strategically significant.
The [**Digital Gold Initiative** ](http://World%20Gold%20Council%20Press%20Release)marks a transformative moment for the gold market. By digitizing gold through PGIs and blockchain technology, the World Gold Council is creating a **more transparent, efficient, and accessible market**. Investors, banks, and fintech innovators stand to benefit from these innovations, shaping a new era of gold trading in 2025 and beyond.
For more insights on finance, digital assets, and market innovations, **follow [DFMedia](https://df.media/)** for the latest updates and in-depth analysis.
**Categories:** Global News
**Tags:** digital gold initiative
---
### [Revolut- Groundbreaking $75 Billion Secondary Share Sale](https://df.media/revolut-groundbreaking-75-billion-secondary-share-sale/)
**Published:** September 1, 2025
**Author:** Vishnu Priya
**Content:**
In a landmark moment for the **fintech industry**, **Revolut** has achieved a staggering **$75 billion valuation** through a secondary share sale, cementing its position as Europe’s most valuable financial technology company. This **September 2025 milestone** represents a remarkable 67% increase from its previous $45 billion valuation, positioning Revolut among the world’s largest traditional banks by market capitalization.
## Understanding Revolut’s Secondary Share Sale Structure
## What is a Secondary Share Sale?
A **secondary share sale** allows existing shareholders, including employees and early investors, to sell their holdings without the company issuing new stock. This **employee liquidity event** provides crucial financial opportunities while the company remains privately held.
## Key Details of Revolut’s $75 Billion Deal
- **Share price**: $1,381.06 per share
- **Valuation increase**: 67% from $45 billion in 2024
- **Primary beneficiaries**: Current and former Revolut employees
- **Market positioning**: Among Europe’s largest financial institutions by value
## Financial Performance Driving Revolut’s Massive Valuation
## Record-Breaking Revenue Growth
Revolut’s impressive **financial performance** justifies its historic valuation:
- **Annual profit**: Over $1 billion in 2024 (doubled from previous year)
- **Revenue growth**: 72% increase to $4 billion in 2024
- **Customer base**: Over 60 million global customers
- **Profitability streak**: Four consecutive years of positive earnings
## Competitive Market Position
This **$75 billion fintech valuation** surpasses many traditional banks’ market capitalizations, including Barclays, demonstrating the transformative power of **digital banking innovation**.
## Digital Banking Market Revolution: Trends Shaping 2025
## Global Digital Banking Growth Statistics
The **digital banking market** is experiencing unprecedented expansion:
- **Market size**: $1.61 trillion projected net interest income in 2025
- **Growth rate**: 6.80% CAGR through 2029
- **Processing volume**: $1.4 trillion annually across 1.75 billion accounts
- **Cost reduction**: 20-40% operational savings for digitally-transformed banks
## Key Digital Banking Trends 2025
1. **Mobile-first banking experiences**
2. **AI-powered personalization**
3. **Embedded finance solutions**
4. **Enhanced cybersecurity measures**
5. **Sustainable banking practices**
## Revolut’s Global Expansion Strategy
## International Market Penetration
Revolut’s **$75 billion valuation** supports aggressive **global expansion**:
**European Markets**:
- €1.1 billion commitment to France
- UK banking license mobilization phase
- Expanded services across 40+ countries
**Asia-Pacific Growth**:
- India market entry planned for 2025
- Premium customer segment targeting
- Strategic partnerships with local fintech companies
**Middle East Expansion**:
- UAE e-money institution license secured
- Digital banking competition intensification
## Revolut vs Traditional Banks: Market Disruption Analysis
## Competitive Advantages
| **Metric** | **Revolut** | **Traditional Banks** |
|---|---|---|
| **Customer Growth** | +38% (2024) | -10% to -27% average |
| **Operational Costs** | Lower (no physical branches) | Higher (branch maintenance) |
| **Service Innovation** | Rapid deployment | Slower implementation |
| **Digital Adoption** | Native digital | Legacy system constraints |
## Product Diversification Strategy
Revolut’s **fintech innovation** spans multiple sectors:
- **Currency exchange** and international transfers
- **Cryptocurrency trading** platforms
- **Stock trading** and investment services
- **AI-powered budgeting** tools
- **Digital mortgage** products (planned 2025)
## Secondary Market Trends: The New Liquidity Landscape
## Rising Secondary Share Sale Activity
The **secondary market** is experiencing significant growth:
- **Investor interest**: 60% of founders report increased secondary deal interest
- **Market activity**: 40% bid-to-ask ratio in November 2024
- **Popular companies**: Revolut, Klarna, SpaceX, Stripe lead activity
## Benefits of Secondary Transactions
1. **Employee liquidity**: Wealth creation without IPO dependency
2. **Early investor exits**: Return realization opportunities
3. **Strategic partnerships**: New investor relationships
4. **Capital table optimization**: Ownership restructuring flexibility
## Revolut’s IPO Prospects and Timeline
## Public Listing Considerations
While no official **IPO announcement** exists, market indicators suggest:
- **Expected timeline**: Potential 2026 public listing
- **Preferred exchange**: Nasdaq over London Stock Exchange
- **Valuation benchmark**: $75 billion private valuation sets IPO baseline
- **Market conditions**: Dependent on global economic stability
## Regulatory Milestones
**UK Banking License Progress**:
- License approved July 2024
- 12-month mobilization phase ongoing
- £50,000 deposit limit during transition
- Full operations expected 2025
## Industry Recognition and Awards
## Digital Banking Leadership
Revolut’s achievements include:
- **Euromoney’s “World’s Best Digital Bank 2025”** – First neobank winner
- **Industry transformation** recognition
- **Customer satisfaction** leadership
- **Innovation excellence** awards
## Investment Implications and Market Analysis
## Fintech Valuation Trends
Revolut’s **$75 billion secondary share sale** signals:
1. **Mature fintech market** validation
2. **Sustainable growth** models proven
3. **Traditional banking** disruption confirmed
4. **Digital transformation** acceleration
## Risk Factors and Considerations
**Potential challenges**:
- **Regulatory compliance** complexity
- **Market saturation** in key regions
- **Competition intensification** from traditional banks
- **Economic volatility** impact on growth
## Future Outlook: Revolut’s 2025-2026 Roadmap
## Technology Innovation Pipeline
**Planned developments**:
- **Advanced AI integration** across all services
- **Blockchain technology** enhancement
- **Quantum-resistant security** implementation
- **Sustainable finance** product launches
## Market Expansion Goals
- **US market penetration** through strategic acquisitions
- **Asian market consolidation** via local partnerships
- **African market exploration** for emerging opportunities
- **Latin American expansion** considerations
## Conclusion: Revolut’s $75 Billion Valuation Impact on Fintech Industry
Revolut’s historic **$75 billion secondary share sale** represents more than a financial milestone—it validates the **digital banking revolution** and demonstrates the viability of **fintech companies** as legitimate alternatives to traditional banking institutions. This achievement signals the maturation of the fintech sector and provides a blueprint for other digital financial services companies pursuing similar growth trajectories.
As the **global fintech market** continues evolving, Revolut’s success story illustrates the importance of **customer-centric innovation**, **regulatory compliance**, and **strategic international expansion**. The company’s journey from startup to $75 billion valuation serves as a testament to the transformative power of digital financial services in reshaping the global banking landscape.
The **secondary share sale** structure also highlights evolving approaches to **employee compensation** and **investor liquidity** in the modern startup ecosystem, potentially influencing how other high-growth fintech companies structure their pre-IPO financing strategies.
**Categories:** Global News
---
### [Singapore and UAE are launching a new trade partnership in 2025](https://df.media/singapore-uae-launch-trade-partnership-in-2025/)
**Published:** August 29, 2025
**Author:** Vishnu Priya
**Content:**
In a major move signaling economic resilience, **Singapore and the United Arab Emirates (UAE)**, along with several other smaller nations, have announced a strategic trade partnership in 2025. This alliance aims to boost trade flows, simplify regulations, and strengthen economic cooperation amid growing protectionist policies worldwide.
As global trade dynamics shift, particularly under the influence of countries adopting more inward-looking policies, smaller nations are increasingly taking proactive steps to secure market access, attract investments, and maintain economic growth. The **Singapore UAE trade partnership 2025** is a prime example of this trend.
---
## Why the Partnership Matters
The partnership comes at a time when global markets face uncertainty. Trade barriers and tariffs, especially in major economies, have challenged international commerce. By joining forces, Singapore, UAE, and other small but influential nations are sending a clear message: open markets and cooperation remain key to sustainable economic development.
Experts say this collaboration will:
- Strengthen trade relations between member nations
- Facilitate technology transfer and innovation
- Promote financial and logistic services integration
- Counterbalance global protectionist trends
“Smaller nations have the agility to respond to economic disruptions more effectively than larger economies,” said a senior trade analyst. “The **Singapore UAE trade partnership 2025** demonstrates a commitment to collaboration and market openness.”
---
## Sectors Benefiting from the Trade Alliance
The partnership is not limited to a single industry. Key sectors expected to benefit include:
1. **Technology and Innovation** – Reducing barriers for tech startups and cross-border digital services
2. **Financial Services** – Promoting investment flows and streamlined regulations
3. **Logistics and Supply Chains** – Enhancing efficiency in transportation and customs processes
4. **Trade in Goods** – Lowering tariffs and simplifying export-import procedures
By focusing on these sectors, the alliance aims to create a business-friendly environment that encourages both domestic and foreign investment.
---
## WTO and Trade Openness
The partnership aligns closely with ongoing discussions at the World Trade Organization (WTO), where members advocate for “trade openness” and collaboration. In the era of rising protectionism, especially in larger economies, smaller nations are increasingly uniting to safeguard free trade principles.
The WTO emphasizes that open trade contributes not only to economic growth but also to global stability, innovation, and employment. The [**Singapore UAE trade partnership 2025** ](https://oec.world/en/profile/bilateral-country/are/partner/sgp)is in line with these objectives, demonstrating how smaller economies can act decisively to shape global trade agendas.
---
## Implications for Global Trade
The new alliance is expected to:
- Strengthen smaller economies’ influence in international trade
- Encourage cross-border investments and partnerships
- Offer alternative trade routes and opportunities outside major power blocs
- Set a model for other nations looking to counter protectionist policies
Analysts suggest that these measures could redefine trade networks, encouraging more agile and strategic collaboration between smaller nations worldwide.
---
The **Singapore UAE trade partnership 2025** marks a strategic step for small nations seeking resilience in an unpredictable global economy. By prioritizing open markets, regulatory simplification, and sector-specific collaboration, the alliance is set to become a blueprint for similar initiatives worldwide.
As global trade policies continue to evolve, this partnership highlights the role of smaller, agile economies in shaping a future of sustainable growth, investment, and cooperation.
**Follow [DFmedia ](https://df.media/)for the latest in global trade news and insights. Stay informed on key developments that shape finance and commerce worldwide.**
**Categories:** Global News
---
### [Japan’s Cryptocurrency Market Sees Strong Growth and Institutional Potential](https://df.media/japans-cryptocurrency-market-sees-strong-growth/)
**Published:** August 28, 2025
**Author:** Vishnu Priya
**Excerpt:** Japan emerges as a global hub for crypto investments as market adoption and regulatory clarity expand in 2025
**Content:**
Japan’s cryptocurrency market continues to show significant growth, driven by increasing adoption among retail and institutional investors. The country currently maintains over **12 million active crypto accounts**, collectively holding more than **¥5 trillion** in digital assets, underscoring the market’s expanding scale and influence.
In recent months, Japanese exchanges have reported higher trading volumes, reflecting both renewed retail enthusiasm and growing participation from institutional investors. Analysts say this trend is being fueled by enhanced regulatory clarity and the implementation of standardized frameworks that facilitate safer investment in digital assets.
### Regulatory Developments
Japan has been steadily advancing regulations to support cryptocurrency growth while managing risks. The **Financial Services Agency (FSA)** is proposing reforms to classify cryptocurrency gains under the **Financial Instruments and Exchange Act**, potentially introducing a flat tax rate of **20.315%**, aligning crypto taxation with traditional financial instruments like stocks and bonds.
Experts say these reforms could reduce uncertainty and encourage broader market participation, particularly among institutional investors who require clear regulatory guidance before committing significant capital. By standardizing taxation and compliance, Japan is signaling that digital assets can coexist alongside traditional investments within regulated financial ecosystems.
---
### Market Trends
The Japanese crypto market is notable for its sophistication and scale. With a population that is highly tech-savvy and financial institutions increasingly exploring digital asset offerings, Japan has become a testing ground for new financial products, including tokenized securities and blockchain-based payment solutions.
Recent data shows that major Japanese exchanges have recorded a marked increase in trading activity over the past quarter, especially in assets like Bitcoin, Ethereum, and selected stablecoins. Analysts attribute this growth to enhanced public awareness, improved exchange infrastructure, and growing investor confidence in market transparency.
---
### Institutional Interest
Institutional investors are showing rising interest in Japan’s cryptocurrency ecosystem. Many investment funds and corporate treasuries are considering digital assets as part of diversified portfolios, recognizing their potential as long-term stores of value and hedges against inflation.
Financial experts suggest that Japan’s regulatory clarity, combined with the country’s strong technological infrastructure and security standards, makes it an attractive destination for global crypto capital. The nation’s approach demonstrates how a balanced regulatory environment can foster both innovation and investor protection.
---
### Implications for the Global Market
Japan’s progress in cryptocurrency adoption and regulation is being closely watched internationally. As one of the world’s leading economies, Japan’s policies can influence market sentiment and set precedents for other nations exploring regulated crypto frameworks.
Observers note that Japan’s focus on clear compliance rules and integration with existing financial markets may provide a blueprint for countries seeking to harness digital assets without compromising financial stability. By combining market growth with regulatory oversight, Japan could solidify its position as a global hub for crypto investment.
---
### Future Outlook
Market analysts expect Japan’s cryptocurrency market to continue expanding over the next several years. Factors contributing to growth include increased retail adoption, ongoing development of crypto-related financial products, and broader international interest from institutional investors.
Emerging trends, such as blockchain-based financial services, tokenized assets, and decentralized finance (DeFi) applications, are likely to gain traction in Japan’s ecosystem. This growth is expected to attract global investment and reinforce Japan’s position as a major player in the digital asset economy.
---
Japan’s cryptocurrency market demonstrates remarkable resilience and growth potential. With over 12 million accounts holding ¥5 trillion in assets, coupled with improved regulatory clarity and increasing institutional participation, the country is emerging as a leader in global digital finance.
As the market continues to evolve, Japan’s approach may serve as a model for other nations balancing innovation, investor protection, and financial stability. The trajectory of Japan’s crypto ecosystem in 2025 underscores the transformative impact of digital assets on traditional investment landscapes and positions the country as a key player in shaping the future of global finance.
#### **Sources**
- [AInvest](https://www.ainvest.com/news/japan-finance-minister-backs-crypto-signals-regulatory-shift-2508?utm_source=chatgpt.com)
- [Cointelegraph](https://cointelegraph.com/news/japanese-regulator-halves-taxes-on-crypto?utm_source=chatgpt.com)
- [Defi Planet](https://defi-planet.com/2025/08/japans-finance-minister-endorses-crypto-as-part-of-diversified-portfolios/?utm_source=chatgpt.com)
Follow [DFmedia](https://df.media/) for the best news on finance worldwide and the latest updates on cryptocurrency markets.
**Categories:** Cryptocurrency, Global News
---
### [TabiChain Captures 600 Million Users in Crypto Wallet Race](https://df.media/tabichain-captures-600-million-users-in-crypto-wallet-race/)
**Published:** August 26, 2025
**Author:** Vishnu Priya
**Content:**
When a single fintech platform crosses the **600 million user mark**, it is more than a milestone – it’s a signal of how fast the world of money is changing. **TabiChain captures 600 million users** across Southeast Asia, rewriting the rules of digital finance and showing how blockchain has moved from niche speculation into everyday life.
In just a few years, this Singapore-based startup has gone from an ambitious idea to becoming the most widely adopted **crypto wallet ecosystem in Southeast Asia**. The story of TabiChain is not only about user numbers – it’s about how **innovation, regulation, and timing** came together to transform the way millions handle their money.
---
### A Region Ready for Change
Southeast Asia is one of the fastest-growing hubs for fintech adoption. With over **680 million people** and a mobile-first economy, the region has long been seen as a fertile ground for digital payments. What makes it unique is the combination of a **young, tech-driven population** and a large percentage of people who are **unbanked or underbanked**.
This created the perfect storm for crypto wallets. For millions, they aren’t just speculative tools for digital assets – they are gateways to participate in the financial system. And in this race, TabiChain has pulled far ahead.
---
### How TabiChain Captures 600 Million Users
So how exactly did TabiChain become a household name across the region? The company’s rise rests on three pillars: **local adaptability, security, and strategic partnerships.**
- **Local adaptability** meant building features for each market – supporting local currencies, payment gateways, and regulations instead of taking a one-size-fits-all approach.
- **Security and trust** were critical. In a world where crypto scams have left scars, TabiChain invested in advanced **blockchain verification** and **encrypted identity systems**, making it one of the safest wallets on the market.
- **Partnerships** with banks, e-commerce platforms, and fintech players gave TabiChain reach far beyond standalone apps. Users could pay for goods, send remittances, or access loans through one ecosystem.
This **ecosystem-first strategy** is why **TabiChain captures 600 million users** while competitors are still struggling with fragmented growth.
---
### The Bigger Picture – What It Means for Southeast Asia
The fact that **TabiChain captures 600 million users** is not just a company milestone. It reflects a broader shift in how people in Southeast Asia interact with money.
Instead of waiting in line at banks, people are opening wallets with a tap. Instead of dealing with expensive remittance services, workers abroad can send funds instantly to their families. Instead of worrying about inflation in local currencies, users can now hold **stablecoins and digital assets** backed by blockchain.
For investors, this is a strong sign that blockchain is moving into **mainstream infrastructure**. For governments, it highlights the need for balanced regulation that fosters innovation while protecting consumers. And for competitors, it sets a new benchmark that will be hard to beat.
---
### Investors and the Global Stage
Naturally, a fintech story of this scale doesn’t go unnoticed. Global venture capital firms and tech investors are watching TabiChain closely. Some analysts believe it could become a **merger or acquisition target** for larger global payment platforms.
But TabiChain has its own ambitions. The company is already exploring **cross-border remittances, stablecoin-powered transactions, and decentralized finance features** that could expand its services far beyond Southeast Asia. With such momentum, it’s no longer just a regional success story – it’s a potential global disruptor.
---
### A Future Shaped by Digital Trust
The achievement that **TabiChain captures 600 million users** is ultimately about one thing: trust. Trust in technology, trust in compliance, and trust that digital wallets can become more than just a place to store tokens.
As more people in Southeast Asia adopt blockchain-powered finance, the role of platforms like TabiChain will only grow. This is not the end of the race – it’s just the beginning.
---
### Conclusion
In a world where innovation moves at lightning speed, **TabiChain’s 600 million users** remind us that adoption follows trust and usability. The platform didn’t just capture users – it captured a region’s imagination of what financial freedom can look like in the digital era.
For Southeast Asia, the journey of TabiChain is more than a fintech success – it’s a glimpse into the future of money itself.
👉 If you enjoyed this update, check out our previous feature on **crypto adoption trends in Asia**.
**Categories:** Finance, Global News
---
### [Trump Again Raises Prospect of Firing Fed Chair Powell, Stirring Market Jitters](https://df.media/trump-again-raises-prospect-of-firing-fed-chair-powell-stirring-market-jitters/)
**Published:** July 17, 2025
**Author:** Vishnu Priya
**Content:**
**New York, July 17, 2025** ,President Donald Trump has once again suggested that he might dismiss Federal Reserve Chair Jerome Powell. This renewed call has triggered short‑lived market volatility, adding to growing unease over U.S. monetary policy, trade tariffs, and the impact on industries from crypto to equities.
---
### Political Signals vs Economic Policy
According to Reuters, Trump said he is not planning to fire Powell at the moment but left the door open to the possibility. He claimed he had discussed the idea with Republican lawmakers, reflecting his frustration with the Fed’s reluctance to lower interest rates sharply [Yahoo Finance+15Reuters+15tribtoday.com+15](https://www.reuters.com/world/us/trump-indicated-republican-lawmakers-he-will-fire-feds-powell-cbs-reports-2025-07-16/?utm_source=chatgpt.com)[Reuters+1Reuters+1](https://www.reuters.com/world/india/rupee-contends-with-weak-asia-fed-leadership-speculation-2025-07-17/?utm_source=chatgpt.com).
Earlier in the week, a Bloomberg report described Trump’s remarks as “highly unlikely” but still able to unsettle markets [The Times of India](https://timesofindia.indiatimes.com/world/us/highly-unlikely-is-donald-trump-not-firing-jerome-powell-president-sends-mixed-signals-amid-speculation/articleshow/122607664.cms?utm_source=chatgpt.com). That report sparked a brief drop in the U.S. dollar and Treasury yields, which later recovered once Trump denied any immediate firings [Reuters+4Reuters+4Reuters+4](https://www.reuters.com/world/us/trump-indicated-republican-lawmakers-he-will-fire-feds-powell-cbs-reports-2025-07-16/?utm_source=chatgpt.com).
---
### Markets Show Caution, But Growing Resilience
Market reaction was measured. The S&P 500 dropped by about 0.7 percent after the report but later stabilized . Analysts explained that investors are becoming used to Trump’s “trial balloon” statements. Still, they urged caution since any real threat to Fed independence could have serious consequences [Reuters+6Reuters+6AP News+6](https://www.reuters.com/business/finance/investors-become-inured-policy-whiplash-powell-headlines-cause-limited-reaction-2025-07-16/?utm_source=chatgpt.com).
Short‑term yields fell briefly when markets believed Powell would be replaced. Long‑term yields were steadier, reflecting mixed expectations [Wikipedia+7Reuters+7Reuters+7](https://www.reuters.com/business/finance/investors-become-inured-policy-whiplash-powell-headlines-cause-limited-reaction-2025-07-16/?utm_source=chatgpt.com).
---
### Federal Reserve Independence at Stake
Republican senators like Thom Tillis and Mike Rounds have warned Trump against political interference with the Fed. Senator Tillis said the independence of the central bank is critical to maintain market confidence, while Senator Rounds called a potential Powell dismissal a potential blow to U.S. credibility [The Washington Post+4AP News+4Reuters+4](https://apnews.com/article/2b6f104028489d8051d7ac27492298eb?utm_source=chatgpt.com).
New York Fed President John Williams emphasized that the effects of Trump’s tariff policies are just starting and that any politicization of the Fed could worsen economic volatility [Reuters](https://www.reuters.com/business/feds-williams-says-tariff-economic-impact-is-only-just-starting-2025-07-16/?utm_source=chatgpt.com).
---
### Tariff Pressures Add Fuel to the Fire
This uncertainty comes as the White House is preparing more tariffs on allies. Federal Reserve leaders have warned that added tariffs would push inflation higher, intensifying pressure on monetary policy . Trump has called for steep rate cuts of as much as three percent, which could risk fueling inflation at a time when tariffs are already acting as a rising cost for manufacturers and consumers .
---
### Ripple Effects in Global Markets and Crypto
In Asia, the Indian rupee weakened due to the currency tone set by U.S. uncertainty [Reuters](https://www.reuters.com/world/india/rupee-contends-with-weak-asia-fed-leadership-speculation-2025-07-17/?utm_source=chatgpt.com). The Japanese yen also fell as trade worries grew amid global election uncertainty .
Markets from equities to crypto are sensitive to these developments. Latest data show investors are hedging against sudden policy moves. Crypto markets could benefit if the U.S. dollar weakens further .
---
### What Comes Next
The odds that Trump will actually remove Powell remain low, according to analysts [The Guardian+15Reuters+15The Times of India+15](https://www.reuters.com/business/finance/investors-become-inured-policy-whiplash-powell-headlines-cause-limited-reaction-2025-07-16/?utm_source=chatgpt.com). Legal experts agree that firing a Fed chair on a whim would face constitutional barriers [Reuters+15AP News+15Reuters+15](https://apnews.com/article/2b6f104028489d8051d7ac27492298eb?utm_source=chatgpt.com).
Still, the episode highlights the underlying tension between political forces, monetary independence, and global investor sentiment. The focus will now turn to the Fed meeting later this month and the scale of tariffs that may follow.
### Trump’s suggestion that he might fire Powell is more than mere political theater. It shows how fragile sentiment around central bank autonomy has become. When combined with rising tariff pressure it could threaten economic stability, impact currency values, and affect markets across the globe.
As the 2024 election dust continues to settle, Trump’s comments are once again sending ripples through financial and political circles.
With the Federal Reserve’s future direction now under closer watch, investors and policymakers alike are bracing for more turbulence in the months ahead.
Stay tuned to [DF Media](https://df.media) for real-time updates on U.S. politics, global finance, and everything in between.
Read our previous update on market trends: [Nvidia Becomes the First $4 Trillion Tech Powerhouse in 2025](https://df.media/nvidia-becomes-the-first-4-trillion-tech-powerhouse-in-2025/)
**Categories:** Banking
---
### [Powerful Global Market Momentum Builds as Investors Shift Toward Safe Assets](https://df.media/powerful-global-market-momentum-builds-as-investors-shift-toward-safe-assets/)
**Published:** July 1, 2025
**Author:** Vishnu Priya
**Content:**
## A Confident Start to the Financial Quarter
The global markets opened July with a clear sign of strength. Despite uncertainty around U.S. trade policy and weakening dollar signals, investors worldwide demonstrated resilience. A noticeable move toward gold, silver, and other steady-value assets reinforced market confidence across all regions.
The week’s trading trend is not driven by panic but rather a calculated shift. Market participants are adapting strategies around stability, preparing portfolios for tariff outcomes and policy signals from central banks.
---
## Safe Assets Lead the Charge
Gold prices rose by 0.6 percent, reflecting an investor preference for traditional safe assets. Silver and platinum also gained modest ground. This movement shows a strategic rebalance across commodities as global markets move into a new fiscal quarter.
The weakening of the U.S. dollar has accelerated this shift, especially for international traders leveraging favorable currency exchange conditions to increase commodity positions.
---
## U.S. Trade Decision Looms Large
Investors are now watching for a major announcement on U.S. import tariffs, expected by July 9. This decision is anticipated to influence multiple global sectors including manufacturing, technology, and logistics.
While exact policy details remain uncertain, the market response is proactive rather than reactive. Traders are balancing equity holdings with commodities and adjusting currency strategies to prepare for possible supply chain impacts.
---
## Global Indices Reflect Measured Response
European markets opened cautiously, but late-day recoveries were observed in France and Germany. In Asia, the Hang Seng Index saw slight gains led by export-focused tech firms. Japan’s Nikkei remained stable, while India’s benchmark indices held firm thanks to strength in consumer and energy sectors.
This measured global response reflects a mindset of preparation, with investors using the current period to fine-tune risk exposure.
---
## Emerging Markets Gain New Traction
In emerging economies, capital inflow has seen a temporary boost. The Reserve Bank of India highlighted the short-term advantage of dollar softness, helping exporters with improved profit margins.
Southeast Asian economies have also signaled opportunity, particularly for commodity-rich nations with export flexibility. Financial ministries across these regions are keeping a close eye on U.S. tariff policy while reinforcing local trading infrastructure.
---
## Corporates Adjust Without Alarm
Multinational corporations have started reviewing quarterly forecasts. Logistics and shipping companies have issued early guidance, while technology manufacturers are closely assessing trade exposure.
However, sentiment remains stable. Many firms have diversified global sourcing over the past year, which cushions against policy-driven supply disruption. Corporate strategy now favors adaptability and cost control over expansion until more clarity arrives.
---
## Currency Strategy Supports Resilience
With the U.S. dollar hitting a three-year low, financial institutions are adjusting currency exposure. Bond markets remained flat, reflecting cautious optimism as central banks around the world prepare upcoming interest rate statements.
A diversified approach is becoming the norm, with global funds allocating capital across bonds, commodities, and regional equity baskets to capture safe returns.
---
## Looking Forward: Cautious Optimism Continues
As markets wait for critical announcements from Washington and the Federal Reserve, momentum remains positive. Gold continues to act as a stabilizing asset while global currencies shift into a period of correction.
Across regions, the story is one of thoughtful planning. Investors are not just reacting to headlines,they are shaping resilient strategies that support long-term growth in an evolving financial environment.
**Categories:** Capital Markets, Finance, Investing
**Tags:** finance, FinancialFuture, investment
---
### [Trump’s Comments on U.S.-Russia Imports Spark Backlash Amid India Tariff Dispute](https://df.media/trump-comments-us-russia-imports-india-tariffs-2025/)
**Published:** August 6, 2025
**Author:** Vishnu Priya
**Content:**
In a surprise statement on August 5, 2025, U.S. President Donald Trump claimed he was unaware that the United States has been importing Russian uranium, fertilizers, and chemicals — even as he continues to pressure India with fresh tariffs over its Russian oil imports. The comments have drawn scrutiny from both domestic critics and international trade analysts, adding complexity to already tense **India-U.S. trade relations**.
### **The Contradiction in Focus**
The statement came during a press interaction where Trump was questioned about India’s alignment with Russia, particularly its energy ties. “I didn’t know we were importing that much from Russia,” he said, referring to the official figures which reveal that the U.S. has imported over **$24.5 billion** worth of goods from Russia since 2022.
This includes sensitive materials such as:
- **Uranium** for nuclear reactors
- **Fertilizers** critical for U.S. agriculture
- **Chemicals** used across industrial sectors
Despite these significant imports, Trump has maintained a tough stance against India’s ongoing energy transactions with Russia, accusing New Delhi of undermining Western sanctions and aligning too closely with BRICS interests.
### **Tariffs on India Raise Concerns**
Earlier this week, Trump announced a **25% tariff on Indian exports**, along with an **unspecified penalty**—a move that could seriously impact sectors like textiles, pharmaceuticals, and auto parts.
The Indian Ministry of Commerce responded cautiously, stating that it is “studying the implications” of the U.S. move. Meanwhile, analysts warn that the tariffs may damage diplomatic and economic ties that have taken years to strengthen.
### **U.S.-India Trade: A Growing Concern**
India and the U.S. have steadily increased trade partnerships in the last decade, especially in defense, technology, and services. However, the new **Trump India tariffs 2025** could derail talks for a long-anticipated bilateral trade agreement.
“Imposing tariffs while ignoring similar behavior at home makes it difficult to take these sanctions seriously,” said a former U.S. trade official, highlighting the double standards in Trump’s policy.
### **Reactions and Backlash**
Critics in both India and the U.S. have pointed out the inconsistency in Trump’s trade logic. While India’s imports from Russia are mostly oil-related, the U.S.’s Russian imports are tied to critical infrastructure. Yet only India faces penalties.
Social media also reacted swiftly:
- Policy analysts called it “economic hypocrisy”
- Indian business leaders urged New Delhi to reduce dependency on U.S. markets
- Several U.S. lawmakers are demanding transparency on Russian imports
### **What’s Next for Global Trade?**
As geopolitical alliances shift in 2025, the **Trump India tariffs 2025** issue underscores how politics, trade, and global energy security are increasingly interlinked. The coming weeks will likely see escalations unless both countries return to the negotiation table.
With BRICS expanding its global influence and the U.S. tightening its economic policies, emerging markets like India are caught in a delicate balancing act.
US President Donald Trump stated during a press interaction on August 5, 2025, that he was unaware of US imports of Russian uranium, fertilizers, and chemicals. This response came amid his threats to impose tariffs on India for its continued purchases of Russian oil. However, official data reveals that the US has imported over **$24.5 billion worth of goods from Russia** since 2022, including critical materials for the **nuclear and agricultural sectors**.
👉 [New Tariffs Cloud India-U.S. Trade Prospects as Tensions Rise in 2025](https://df.media/new-tariffs-cloud-india-u-s-trade-prospects-as-tensions-rise-in-2025/) – Read more on the escalating trade concerns.
Stay updated with [DF Media](https://df.media/) for more global business headlines and trade insights. You can also read related coverage like [Nvidia’s latest China chip order](https://df.media/nvidia-h20-chips-china-2025/) and [EU-U.S. trade deal developments](https://df.media/us-eu-trade-deal-2025/).
**Categories:** Banking
---
### [TSMC Uncovers Possible Trade Secret Leak in 2nm Chip Development](https://df.media/tsmc-uncovers-possible-trade-secret-leak/)
**Published:** August 5, 2025
**Author:** Vishnu Priya
**Content:**
### **Taiwan’s leading chipmaker takes legal action after internal breach**
**Taipei, August 5, 2025** — Taiwan Semiconductor Manufacturing Company (TSMC), the world’s largest semiconductor manufacturer, has revealed it is investigating a possible leak of trade secrets after detecting unauthorized internal activities.
The company confirmed that it has already taken strict disciplinary action against the employees involved and initiated legal proceedings.
> **“TSMC maintains a zero-tolerance policy toward any actions that compromise the protection of trade secrets or harm the company’s interests,”** the firm said in a public statement.
# Internal Monitoring Flags Suspicious Activity
According to TSMC, the breach was discovered through its in-house monitoring mechanisms, which helped identify unusual behavior. A swift internal investigation followed, leading to the conclusion that there may have been an attempt to leak sensitive corporate information.
Due to the sensitive nature of the situation and ongoing judicial review, the company has said it cannot disclose additional details at this time.
# Former Employees Suspected in 2nm Data Leak
On the same day, **Nikkei Asia** reported—citing sources familiar with the matter—that several former TSMC employees are suspected of trying to access proprietary information related to the company’s **2-nanometer chip** development. The alleged activity reportedly took place while these individuals were still employed at the company.
The 2nm chip represents one of the most advanced nodes in semiconductor manufacturing and is seen as a major step forward in chip performance and energy efficiency. Protecting this technology is critical, as it gives TSMC a competitive edge over global rivals.
When asked about the Nikkei report, TSMC declined to provide further comment.
# TSMC Holds Vast Intellectual Property
TSMC is well-known for its extensive intellectual property portfolio. The company has previously disclosed that it holds over **200,000 trade secrets** within its internal system.
As a major chip supplier to global tech giants such as **Apple** and **Nvidia**, any breach of its proprietary technology could have a ripple effect across the entire tech ecosystem.
# Similar Incidents in the Past
This incident is not the first time TSMC has had to deal with insider threats. In **2018**, a Taiwanese court indicted a former TSMC employee for allegedly copying secrets related to the **28-nanometer fabrication process** and attempting to transfer them to a Chinese competitor.
In **2023**, Dutch semiconductor equipment maker **ASML** also faced a similar challenge. A former employee in China was found to have misappropriated data related to its advanced chip manufacturing equipment.
# Industry Impact and Growing Cybersecurity Concerns
With the increasing demand for advanced semiconductors and growing geopolitical focus on chip sovereignty, safeguarding trade secrets has become a top priority for leading chipmakers.
TSMC’s proactive approach—through constant monitoring and strict policy enforcement—highlights the challenges tech companies face in preventing insider threats.
> “We remain committed to safeguarding our core competitiveness and the shared interests of all our employees,” the company added.
>
>
>
>
>
>
>
>
>
> **[Published by DF Media](https://df.media/) – Delivering Clarity, Speed, and Depth in Every Tech Update.**
**Categories:** Banking, Finance
---
### [Hidden Brain Activity May Shape How We Store Human Memory](https://df.media/hidden-brain-activity-may-shape-how-we-store-human-memory/)
**Published:** June 26, 2025
**Author:** Vishnu Priya
**Content:**
A team of neuroscientists has discovered that **hidden brain activity**, once overlooked by traditional brain models, may play a crucial role in how we form and store memories. This breakthrough could change how we approach memory loss, brain health, and even artificial intelligence.
Published in the journal *Science*, the research focused on **astrocytes** ,a type of brain cell that until recently was thought to function mainly as a support system for neurons. Now, scientists believe that astrocytes are actually key players in **shaping memory**, marking one of the most important discoveries in neuroscience in recent years.
### **What Is Hidden Brain Activity?**
When we think about how the brain works, we often picture neurons firing electrical signals. These spiky messages help us think, move, and remember. But what if there’s more to memory than just neuron activity?
That’s where **hidden brain activity** comes in. This term refers to the **non-electrical, chemical signaling** happening in other types of brain cells especially astrocytes. These cells don’t fire like neurons, but they react to signals, adjust connections between neurons, and influence how information is stored.
In short, hidden brain activity is the **silent control system of the mind**, and it has just stepped into the spotlight.
### **The Breakthrough Study**
Researchers at the Allen Institute for Brain Science and the University of Lausanne used advanced live imaging to watch how brain cells reacted when mice were given memory tasks. To their surprise, they noticed that **astrocytes were highly active**, even before neurons fired.
It was found that these astrocytes were helping neurons form stronger connections during learning moments. Their actions seemed to **set the stage for memory**, almost like lighting technicians preparing a theater before the actors arrive.
“**This type of coordination has been ignored for too long**,” said lead researcher **Dr. Marta Keller.** “N**ow we’re seeing that these ‘quiet’ cells are essential to how the brain actually works.**”
### **Why This Matters for Everyone**
The discovery that **hidden brain activity** supports memory could have huge real-world applications:
- **Alzheimer’s and dementia treatment**: Current drugs focus mostly on neurons. Targeting astrocytes might lead to more effective therapies.
- **Improved learning strategies**: If astrocytes help determine how we retain information, new learning tools could be designed to engage this part of the brain.
- **Smarter AI**: Artificial intelligence could become more efficient if it mimics the balance between fast signals (neurons) and chemical support (astrocytes).
---
### **How the Brain Stores Memory: A New Understanding**
The brain stores memory through a process called synaptic plasticity—strengthening the connection between neurons. What this new research shows is that astrocytes are not just sitting nearby. They are **actively shaping those connections**, adjusting chemical environments, and even influencing which memories are saved and which are discarded.
These cells manage **calcium signals**, which in turn affect how neurons fire. It’s a complex dance, and until now, science had only been watching half the performance.
### **Future Applications: Non-Invasive Memory Boosting**
One of the most exciting parts of this research is how **astrocytes respond to natural inputs** like light, sound, and breathing. This means that, unlike neurons, they might be activated by simple non-invasive therapies.
Researchers are already experimenting with **sleep-based sound therapy**, using soft sound patterns to enhance memory formation during deep sleep. In mice, it worked. Human trials could begin within a year.
### **Expert Insight**
This discovery has been widely praised across the neuroscience community.
It was suggested by ***Dr. Lila Mendez of Harvard University*** that **“the memory process appears to be far more dynamic than previously believed, and this newly identified role of astrocytes fills in a major gap in our understanding.”**
### **What Comes Next?**
The research team is now applying these findings to **human brain organoids** small lab-grown models that mimic the structure of the brain. If astrocytes behave the same way in human tissue, it could lead to major breakthroughs in how we treat learning disorders, memory loss, and even brain injuries.
Researchers are also studying how **stress, diet, and sleep** influence this hidden brain activity. The goal is to find ways to naturally support these silent memory helpers in everyday life.
#### **The discovery of hidden brain activity led by astrocytes represents a new chapter in neuroscience. It challenges long-held assumptions and invites us to see the brain not just as a series of electric flashes, but as a complex system of silent cooperation. Whether it leads to better treatments for disease or smarter technologies, one thing is clear memory is more than a spark, it’s a symphony, and we’re just beginning to hear the full performance.**
For more news, [click here](https://df.media/ "click here")
**Categories:** Global News, Science
**Tags:** Astocytes, hidden brain activity
---
### [Asia Markets Remain Calm Ahead of Earnings and Trade Data in July 2025](https://df.media/asia-markets-trade-data-in-july-2025/)
**Published:** July 21, 2025
**Author:** Vishnu Priya
**Content:**
While global financial headlines continue to focus on political tension and inflation uncertainty, Asia’s major markets are showing quiet strength. As of this week, both **Japan and India** have seen stable trading patterns, signaling investor confidence ahead of key earnings and trade data expected in the coming days.
### Investor Sentiment Holds Steady in Asia
In Japan, the **Nikkei 225** continues to trade within a healthy range, supported by gains in tech, robotics, and semiconductor stocks. Investors are particularly focused on upcoming earnings reports from major firms like Sony and Mitsubishi. These reports are expected to shed light on how Japan’s export-driven sectors are faring amid slower global demand.
Meanwhile, in India, the **Sensex and Nifty 50** have held firm, with minor gains driven by foreign institutional investments (FII) and optimism in the IT and banking sectors. India’s domestic consumption story continues to act as a buffer against global headwinds.
### Why Markets Are Watching This Week Closely
This week is critical for Asia’s financial outlook. A series of corporate earnings announcements, coupled with fresh **trade data releases** from Japan, South Korea, and India, will offer insights into how regional economies are performing in mid-2025.
Some key points investors are watching:
- **Q2 Earnings Reports** from large-cap companies in the tech and automotive sectors.
- **Export and Import Trends** in Japan and India, which signal global demand health.
- **Currency Movement**, especially the yen and rupee, in reaction to U.S. rate forecasts.
Analysts say the calmness across Asia is not apathy it’s **calculated patience**. “There’s a quiet expectation that Asia, especially India and Japan, could outperform other regions in the second half of 2025,” says Reena Malhotra, senior strategist at EastBridge Capital.
### Global Comparison: Asia vs. the West
Unlike the U.S. and European markets, where political uncertainties (including talk of Fed chair changes and upcoming elections) are creating volatility, Asian markets are seeing more structured optimism.
Japan’s **moderate inflation** and India’s **strong service exports** are giving investors reasons to stay put or even increase exposure in the region.
### What’s Next?
If earnings meet or beat forecasts and trade data shows stability, markets could trend upwards. However, any negative surprises could test investor nerves quickly.
### What It Means for Global Investors
The stability in Asia’s markets could act as a **safe harbor** for global investors looking for consistent returns. Many portfolio managers are already considering increased allocations to Asia-focused funds due to lower volatility and higher consumer demand potential in the region.
---
While global noise continues to make headlines, Asia’s calm market approach stands out. With earnings and trade data set to roll in over the next few days, all eyes will be on whether Japan and India can continue to lead with quiet confidence.
**Want more updates like this?
Follow [DF Media](https://df.media) for in-depth economic coverage and daily business insights.**
Japan’s 2025 tariff threat is shaking up global trade.
Will markets react or resist?
Catch the full analysis <https://welpmagazine.com/japan-tariff-threat-2025/>
**Categories:** Banking
---
### [U.S. - China Close In on New Trade Pact as Tariff Deadline Looms](https://df.media/us-china-trade-deal-2025-tariff-negotiations-update/)
**Published:** July 31, 2025
**Author:** Vishnu Priya
**Content:**
As the clock ticks down to a crucial tariff deadline, Treasury Secretary **Scott Bessent** revealed on Thursday that the **United States and China** are nearing the final stages of a new **U.S.-China trade deal**.
Speaking on CNBC’s *Squawk Box*, Bessent said, “I believe that we have the makings of a deal.” He added that only a few technical issues on the Chinese side remain unresolved. “I’m confident it will be done, but it’s not 100% done yet,” he clarified.
### Tough Talks in Stockholm
The comments come after two intense days of negotiations between American and Chinese delegates in Stockholm. Bessent described the discussions as “tough,” adding, “The Chinese are tough negotiators. We’re tough, too.” However, no specifics were provided regarding the structure or terms of the potential deal.
While **President Donald Trump** has yet to be briefed on the outcome, Bessent confirmed that the President would need to approve any final agreement personally. “It’s not done until Trump signs off,” Bessent said.
### Truce on Tariffs Under Pressure
The current truce between the two economic superpowers has been tentative. After a bitter back-and-forth of tariff hikes, the U.S. had imposed **145% tariffs** on Chinese imports, while **China retaliated with 125% tariffs**. In recent months, both nations have de-escalated slightly, reducing U.S. tariffs to **30%** and China’s to **10%**.
Despite progress, time is running short. The countries face an **August 12 deadline** to reach a full agreement before tariffs are re-evaluated or potentially reintroduced.
### Political Tensions and Strategic Concerns
Beyond trade, political and strategic tensions complicate the process. The U.S. has raised concerns over **China’s purchase of Iranian oil** and its **tech transfers to Russia**, citing potential battlefield implications.
While these issues are not central to the trade deal itself, they have influenced the overall tone of negotiations and could impact the final terms.
---
**Implications**
If successful, the U.S.-China trade pact could stabilize global markets and reduce tensions in key sectors such as manufacturing, semiconductors, and energy. Analysts say it would also serve as a symbolic victory for both governments amid growing global uncertainty.
However, the fragile nature of talks and ongoing geopolitical frictions suggest that even with a deal, enforcement and compliance could remain major hurdles in the months ahead.
Stay updated with [DF Media](https://df.media) for more global business headlines and trade insights. You can also read related coverage like [Nvidia’s latest China chip order](https://df.media/nvidia-h20-chips-china-2025/) and [EU-U.S. trade deal developments](https://df.media/us-eu-trade-deal-2025/).
**Categories:** Banking
---
### [Asian Markets Surge on U.S. Japan Trade Optimism 2025](https://df.media/asian-markets-surge-on-u-s-japan-trade-optimism-2025/)
**Published:** July 24, 2025
**Author:** Vishnu Priya
**Content:**
The Asian markets 2025 outlook turned bullish today as major indices across the continent soared following renewed optimism over a potential U.S.–Japan trade agreement. This surge is being closely watched by investors worldwide, with Tokyo’s Nikkei 225 climbing 2.3% and other Asian financial markets echoing the uptrend.
### **Trade Talks Spark Rally Across Asia**
Investor sentiment was lifted after both Japanese Prime Minister Ishiba and former U.S. President Donald Trump hinted at a “massive” bilateral deal aimed at lowering tariffs and improving cross-border economic cooperation. The Asian Markets 2025 rally reflects growing investor confidence in a more stable geopolitical environment for trade.
Tokyo’s stock exchange saw the Nikkei reach its highest level since early May, while Seoul’s KOSPI rose 1.8%, and Hong Kong’s Hang Seng gained 1.5%. These market movements indicate strong investor appetite for risk amid a backdrop of easing trade tensions.
### **Sectors Leading the Gains**
The electronics, auto, and energy sectors led the surge. Japanese auto stocks like Toyota and Nissan soared after Trump hinted that the U.S. may lower tariffs on Japanese vehicles. Semiconductor companies also experienced gains as the deal is expected to ease supply chain restrictions.
Asian Markets 2025 have seen fluctuations over the past quarter, but today’s rally marks one of the largest single-day gains in recent months.
### **Currency and Bond Market Response**
The Japanese Yen weakened slightly to 159.20 against the dollar, a sign that global investors are shifting funds back into equities from safe-haven assets. Meanwhile, government bond yields across Asia also edged higher, reflecting growing risk-on sentiment.
Economists from DBS Bank and Nomura stated that the Asian Markets 2025 rally could continue through Q3 if progress on trade negotiations is sustained.
### **Global Ripple Effects**
Wall Street responded positively during pre-market trading, with futures on the S&P 500 and Nasdaq pointing to another day of gains. U.S. tech and industrial stocks with exposure to Asian supply chains are also expected to benefit.
The trade optimism is not just limited to Asia. European markets opened higher, and gold prices fell as investors moved away from defensive positions.
The Asian Markets 2025 rally shows how deeply integrated global economies remain, even in a shifting political landscape. As talks between the U.S. and Japan move forward, eyes will remain on whether the optimism translates into signed agreements.
**Follow [DF Media](https://df.media)** and **[Welp Magazine](https://welpmagazine.com)** for more real-time updates on global markets, trade policies, and business intelligence.
**Categories:** Banking
---
### [Nvidia Becomes the First $4 Trillion Tech Powerhouse in 2025](https://df.media/nvidia-becomes-the-first-4-trillion-tech-powerhouse-in-2025/)
**Published:** July 15, 2025
**Author:** Vishnu Priya
**Content:**
## **Nvidia Makes History in Global Stock Markets**
On July 9, 2025, Nvidia reached a major milestone by briefly crossing a market value of 4 trillion US dollars. This made it the most valuable company in the world for a short time. Nvidia moved ahead of Microsoft, Apple, and other global tech leaders.
The reason behind this rise is the company’s strong position in the field of artificial intelligence. Nvidia makes the powerful chips that help run AI software and tools used around the world.
---
### **Why Did Nvidia’s Value Grow So Fast**
Nvidia’s growth is linked to how much companies now depend on artificial intelligence. Many big names like Google, Meta, Amazon, and even government agencies use Nvidia’s chips to support their AI systems.
The company’s most popular products, including its H100 chips and newer models, are in high demand. These chips are used in data centers, cloud services, and research labs.
Nvidia also works with other industries such as car manufacturing and defense, which has helped it grow even more in the past year.
---
### **How It Overtook Apple and Microsoft**
Nvidia reached one trillion in value just a year ago. In 2025, it quickly moved to two trillion, then three, and now briefly touched four trillion.
Here is how other companies compare:
- Apple is around 3.7 trillion
- Microsoft is about 3.5 trillion
- Amazon and Google are lower in the list
This shows how important AI technology has become in global business. Nvidia’s role in building the tools for AI is what makes it stand out.
---
### **Global Investors Show Strong Confidence**
The rise in Nvidia’s value also shows how investors feel about the future. Around the world, countries like the United States, Germany, India, and the United Arab Emirates are spending more on AI development. This helps Nvidia grow further.
Jensen Huang, the CEO of Nvidia, recently said that artificial intelligence is one of the most powerful forces in technology today. His company is proud to be leading this change.
---
### **What Comes Next for Nvidia**
Experts believe Nvidia will continue to grow, but there are a few things to watch:
- The company needs to stay ahead of its rivals like AMD and Intel
- It must follow export rules, especially when dealing with China
- It is also exploring new markets in medicine, robotics, and education
Even though Nvidia’s stock may go up and down, many believe it will remain a top player in the tech world.
---
### Nvidia’s rise to 4 trillion shows a big change in what matters most in business today. The world is moving towards smarter technology, and companies like Nvidia are helping to build that future. As AI becomes part of daily life, this may only be the beginning of even bigger changes.
---
👉 Read more financial trends at [DFmedia](https://df.media/)
👉 See how Bitcoin ETFs are also making headlines in our latest [crypto finance report](https://df.media/bitcoin-etf-inflows-hit-record-high/)
---
**Categories:** Banking
---
### [Nvidia Bets Big on China with 300,000 H20 AI Chips Despite Policy Shift](https://df.media/nvidia-h20-chips-china-2025/)
**Published:** July 29, 2025
**Author:** Vishnu Priya
**Content:**
Nvidia Orders 300,000 H20 AI Chips for China Amid US Policy Reversal
**Amid a fluctuating landscape of US export controls, Nvidia has placed a significant order with TSMC for 300,000 H20 AI chips, according to sources reported by Reuters**. This move signals a strong bet on the Chinese market after a recent reversal of US policy that had effectively banned the sale of these chips, notes Mitrade.
**Background:** The H20 chip, designed specifically for the Chinese market after earlier restrictions, represents a less powerful alternative to Nvidia’s top-tier processors like the H100, says Mitrade.
**Production and Inventory:** This order will add to Nvidia’s existing inventory of 600,000 to 700,000 H20 chips. However, concerns remain about the timeline for full-scale production. Nvidia CEO Jensen Huang has indicated that restarting the supply chain could take up to nine months, according to Mitrade.
**Factors Driving Demand in China:** The demand for H20 chips in China is robust, driven by the increasing deployment of AI models, including the cost-effective offerings from DeepSeek, explains Bisinfotech. Chinese tech giants like Tencent, ByteDance, and Alibaba are leveraging these chips to power their AI workloads, notes WinBuzzer.
**Geopolitical Context:** The US government’s decision to allow H20 sales is intertwined with ongoing trade negotiations with China, particularly concerning rare earth magnets, says WinBuzzer. However, this decision has faced criticism from US lawmakers who worry about enabling China’s AI advancements, notes BusinessLine.
**Export License Uncertainty:** Despite assurances from the Trump administration, the necessary export licenses from the US Commerce Department have not yet been formally approved, reports WinBuzzer.
**Implications:** Nvidia’s decision to order these chips underscores the company’s commitment to maintaining its presence in the Chinese market, even amidst political complexities, concludes WinBuzzer. However, the situation remains fluid, with ongoing debates about US-China trade and technology policy.
This developing story reflects how business strategy and geopolitics are now inextricably linked in the AI era. Stay tuned with [DF Media](https://df.media) for more global tech and trade insights. Also, explore related articles like [India-UK FTA 2025: Landmark Deal](https://df.media/india-uk-fta-2025-landmark-deal/) and [OpenAI’s Public Sector Alliance in the UK](https://beststartup.co.uk/openai-partners-with-uk-to-drive-ai-in-public-services/) for more international business updates.
**Categories:** Business, Finance
---
### [DoLand Pro Strengthens Impact Reporting Platform to Meet Rising Demands from Financial Institutions](https://df.media/doland-pro-strengthens-impact-reporting-2025/)
**Published:** August 13, 2025
**Author:** Vishnu Priya
**Content:**
[EINPresswire.com](http://www.einpresswire.com/)/ — [DoLand Pro](http://www.dolandpro.com/), a Denmark-based fintech company specializing in [sustainable finance](http://www.dolandpro.com/) and impact reporting, has announced new advances of its platform with new workflows and automated data aggregation. The enhancement addresses a persistent challenge in the financial industry: **delivering transparent, consistent, and relevant sustainability insights across diversified portfolios**.
The updated platform is designed for use by banks, multi-family offices, wealth managers, and philanthropic foundations seeking to move beyond generic ESG checklists and provide tailored, narrative-driven insights to end-investors.
“There is increasing pressure on financial institutions to demonstrate the real-world effects of their investment products,” said Jakob Lage Hansen, CEO and Founder of DoLand Pro. “Clients are no longer satisfied with high-level ESG scores.They want transparency, personalized insights, and clarity on how their capital is driving measurable impact also beyond ESG. Our updated platform makes that possible at scale.
**From ESG Compliance to Investor Engagemen**t
The shift comes in the context of growing dissatisfaction with traditional ESG reporting. According to a 2024 global survey by Morgan Stanley, 54% of investors expressed interest in increasing their sustainable investments but cited greenwashing concerns and a lack of trustworthy data as key barriers.
DoLand Pro’s upgraded reporting engine responds to this demand by enabling financial institutions to:
Source high-quality impact data automatically across listed equities and bonds while also having solutions for sourcing private companies and alternative assets.
Generate modular, white-labeled reports tailored to specific client values and aligned with global frameworks such as the UN SDGs and EU SFDR. Visualize impact outcomes using intuitive dashboards and accessible storytelling formats
“Our framework helps advisors not only reduce manual reporting burdens but also translate raw data into relatable, human-centered narratives,” said Hansen. “That’s what drives engagement especially among next-generation investors.”
**Positioned for the $68 Trillion Intergenerational Wealth Transfer**
As the financial industry prepares for the massive intergenerational wealth transfer estimated at$68 trillion globally by 2030 many institutions are facing urgent demands to modernize their approach to investment communication and impact measurement.
This generational shift is particularly pronounced in family offices, where younger clients are demanding values-aligned investing, digital-first experiences, and greater clarity on how their portfolios contribute to climate, social, and governance outcomes.
“Family offices tell us their clients are asking: What is my money actually doing? Our platform enables them to answer that question credibly, consistently, and in a personalized manner,” said Hansen.
**Adoption by Industry Leaders and Strategic Partners**
DoLand Pro has already established strategic partnerships with several leading institutions, including Merkur Cooperative Bank, Denmark’s leading sustainability-focused bank and a member of the Global Alliance for Banking on Values.
“With DoLand’s reporting solution, we are able to demonstrate the true impact of our customers’ entire investment – a significant value add ,” said Charlotte Skovgaard, CEO of Merkur Bank. “DoLand’s interface makes the ongoing administration very efficient and easy to handle.”
In addition to Merkur Bank, DoLand Pro is working closely with B2B partners such as Aleta, Visigon, and Foundgood, integrating its solution within broader investment and reporting infrastructures. The company also reports growing interest from impact-oriented foundations across Northern Europe.
**Scalable Technology, Transparent Business Model**
**DoLand Pro operates on a SaaS-based subscription model that includes:**
A one-time implementation fee (based on system complexity) when applicable, An annual license fee tied to the number of administrative users, and A tiered impact reporting fee based on the number of end-investors and desired reporting depth.
The platform itself is built around a modular impact engine that can scale to accommodate diverse asset types, jurisdictions, and data partners. Importantly, DoLand Pro’s approach integrates recognized global standards, ensuring both regulatory alignment and interpretability for end-users.
The company’s near-term roadmap includes further development of portfolio simulation tools, integration of active ownership data, and expansion of data partnerships to deepen the granularity and coverage of impact metrics.
**About DoLand Pro**
DoLand Pro is a Nordic fintech company headquartered in Copenhagen. The company provides white-labeled impact reporting tools for banks, family offices, and foundations. By combining technology, data, and design, DoLand Pro enables financial institutions to meet evolving regulatory demands, engage their clients with credible narratives, and accelerate capital flows toward sustainable outcomes. The company pivoted from a B2C to a B2B model in 2024 and is currently active across multiple European markets.
**For more information,** visit: [www.dolandpro.com](http://www.dolandpro.com/)
Jakob Lage Hansen Doland **3286668786 ext.**
[Email us here](http://www.einpresswire.com/contact_author/5335077)
**Visit us on social media:**
**[LinkedIn](https://www.linkedin.com/company/doland/) & [Instagram](https://www.instagram.com/thisisdoland)**
---
EIN Presswire’s priority is source transparency. We do not allow opaque clients, and our editors try to be careful about weeding out false and misleading content. As a user, if you see something we have missed, please do bring it to our attention. Your help is welcome. EIN Presswire, Everyone’s Internet News Presswire™, tries to define some of the boundaries that are reasonable in today’s world. Please see our [Editorial Guidelines](https://www.einpresswire.com/editorial-guidelines) for more information. © 1995-2025 Newsmatics Inc. All Right Reserved
**Categories:** Business, Finance
**Tags:** finance
---
### [Breaking News in Finance and Business: Oil Jumps, Gold Climbs, and Inflation Bites Back](https://df.media/breaking-news-brics-currency-bitcoin-surge-oil-gold/)
**Published:** August 12, 2025
**Author:** Vishnu Priya
**Content:**
In the last 24 hours, markets have been shaken by **breaking news in oil jumps, gold climbs, and inflation bites**. From sudden spikes in crude oil prices to gold hitting record highs, global investors are on high alert. Rising inflation pressures, geopolitical tensions, and currency shifts like the BRICS push are driving dramatic moves across commodities and financial markets. Here’s your full market update covering the most important events affecting business and finance today.
## **1. BRICS Currency Push Gains Momentum**
In the past 24 hours, the BRICS alliance Brazil, Russia, India, China, and South Africa — has taken another step towards creating a shared currency for trade. According to recent talks, the move aims to reduce reliance on the US dollar in global transactions. Analysts say this could reshape the world economy by offering an alternative to the traditional reserve currency system.
**Source:** [Reuters](https://www.reuters.com/)
---
### **2. Bitcoin Surges Amid BRICS Shift**
Bitcoin prices jumped sharply after the BRICS currency update sparked investor interest in alternative assets. As of today, Bitcoin is trading above **$63,000**, marking a strong rebound in digital assets. Traders believe the BRICS news has reinforced the long-term potential of cryptocurrencies as a hedge against currency shifts.
**Source:** [CoinDesk](https://www.coindesk.com/)
---
### **3. Oil Prices Spike on Supply Concerns**
Global oil prices have risen by nearly **3% in the last 24 hours** after fresh supply disruptions were reported in the Middle East. Brent crude is now trading at **$88 per barrel**, pushing up fuel and transportation costs worldwide. Economists warn that this could add more pressure to already high inflation rates.
**Source:** [Bloomberg](https://www.bloomberg.com/)
---
### **4. Gold Climbs as Investors Seek Safety**
Gold prices surged to **$2,540 per ounce**, a record high in 2025, as investors turned to safe-haven assets amid market uncertainty. The combination of BRICS currency talks, volatile oil markets, and inflation fears has made gold a top pick for cautious investors.
**Source:** [Kitco](https://www.kitco.com/)
---
### **5. Inflation Concerns Resurface**
Inflation remains a top concern globally, with new data showing higher-than-expected price growth in several major economies. Rising oil prices, combined with food and housing cost increases, have sparked fears that central banks may need to keep interest rates higher for longer.
**Source:** [IMF](https://www.imf.org/)
Stay ahead of the curve with[ **DF Media’s breaking finance and business updates**](https://df.media/) your daily source for global market trends, economic insights, and industry shifts that matter most.
**Categories:** Business, Finance, Global News
---
### [Bitcoin Price Surge Shocks the World: Crypto Chaos as Bitcoin Skyrockets 35% in 24 Hours](https://df.media/bitcoin-price-surge-in-24-hours/)
**Published:** August 11, 2025
**Author:** Vishnu Priya
**Content:**
## **Table of Contents**
1. [Introduction: The Bitcoin Price Surge That Stunned the World](#introduction)
2. [Reasons Behind the Bitcoin Price Surge](#reasons)
3. [Impact on the Cryptocurrency Market](#impact)
4. [What This Means for Bitcoin Investors](#future)
5. [Conclusion: Can the Bitcoin Price Surge Last?](#conclusion)
---
## **Introduction: The Bitcoin Price Surge That Stunned the World**
The **Bitcoin price surge** has sent shockwaves through global financial markets. In an astonishing turn of events, **Bitcoin skyrocketed 35% in just 24 hours**, pushing its value past **$54,000**. This **cryptocurrency market rally** has not only ignited investor excitement but also fueled debates about the long-term stability of digital assets.
For traders, this sudden movement feels like déjà vu reminiscent of previous bull runs where fortunes were made (and lost) overnight. But this time, the **crypto market trends** suggest a mix of institutional interest, macroeconomic shifts, and technological optimism.
---
## **Reasons Behind the Bitcoin Price Surge**
Several factors have contributed to this dramatic **Bitcoin price surge**:
### 1. **Institutional Buying**
Major hedge funds and investment firms have reportedly purchased large amounts of Bitcoin over the past week. According to *CoinDesk*, this bulk buying is likely a strategic move ahead of potential regulatory changes.
### 2. **Bitcoin ETF Approval Hopes**
Rumors of faster approval for a **Bitcoin Exchange-Traded Fund (ETF)** have fueled optimism among retail and institutional investors alike. Analysts at *[CoinTelegraph](https://cointelegraph.com/)* suggest that ETF approval could unlock billions in new investment capital.
### 3. **Altcoin Momentum**
Ethereum, Solana, and Cardano also posted double-digit gains, adding to the perception that the **cryptocurrency market rally** is broader than just Bitcoin.
---
## **Impact on the Cryptocurrency Market**
The ripple effects of this **Bitcoin price surge** have been felt across the entire digital asset space:
- **Trading Volumes Soar** – Crypto exchanges reported record-breaking trading activity.
- **Market Sentiment Turns Bullish** – Social media hashtags like **\#BitcoinBoom** and **\#CryptoChaos** trended globally.
- **Increased Volatility** – While excitement is high, the rapid pace of gains has also sparked caution among seasoned traders.
---
## **What This Means for Bitcoin Investors**
For long-term holders, this **Bitcoin price surge** reinforces confidence in Bitcoin as a store of value. However, history shows that sudden surges are often followed by equally sharp corrections.
**Key Investor Tips:**
- **Avoid FOMO (Fear of Missing Out)** – Enter the market with a clear plan.
- **Diversify** – Don’t put all your capital into a single asset.
- **Watch Key Levels** – Technical analysts are eyeing $55,000 as the next resistance point.
---
The current **Bitcoin price surge** is one of the most dramatic in recent history, but the big question is: **can it last?** While strong fundamentals and investor optimism are driving momentum, the crypto market’s notorious volatility means nothing is guaranteed.
As with any investment, the key is **research, risk management, and patience**. Whether Bitcoin sustains this rally or corrects in the coming weeks, one thing is certain this **cryptocurrency market rally** will be remembered as a pivotal moment in Bitcoin’s ongoing journey.
**RELATED LINKS**
- [CoinDesk Bitcoin News](https://www.coindesk.com/)
- CoinTelegraph Market Updates
**Categories:** Banking, Bitcoin (BTC), Business, Cryptocurrency, FinTech, Global News
**Tags:** Bitcoin
---
### [Elon Musk’s Neuralink Chip Could Transform Business and Learning](https://df.media/neuralink-chip-business-innovation-2025/)
**Published:** July 7, 2025
**Author:** Vishnu Priya
**Content:**
## What Is the Neuralink Chip?
Neuralink is a company founded by Elon Musk in 2016. Its mission is to build a small brain chip that can help people connect directly with computers and devices. The chip is implanted inside the skull and works by reading brain signals. It can help people with disabilities control smartphones, type messages, or move a mouse just by thinking.
In 2023, the United States Food and Drug Administration approved Neuralink to begin testing the chip in humans. The first successful trial showed that a paralyzed person could use the chip to browse the web and play games using only thoughts. Since then, the chip has received attention from both the medical and technology industries.
---
## Recent Updates and Real Impact
In early 2025, Neuralink was given “breakthrough device” status by the FDA. This means the agency sees high potential for helping people with serious conditions such as loss of speech or hearing. Elon Musk shared that the chip may one day restore hearing in people who have been deaf since birth. The chip could also help people who cannot speak to communicate again by translating brain signals into digital speech.
---
## How Could the Chip Help Businesses?
The technology is still developing, but the possibilities for businesses are growing. If the chip continues to show results, it could be used in future workplaces in several ways:
### 1. Faster Learning
Employees may learn new tasks or software quickly using direct brain-to-device training systems.
### 2. Hands-Free Work
In busy workplaces like factories or control rooms, workers could operate machines using thought signals instead of keyboards or touchscreens.
### 3. Accessibility Support
Professionals with disabilities could use the chip to perform office work, attend virtual meetings, and write emails through brain signal control.
---
## Which Industries Might Use It First?
Neuralink’s chip could be useful in:
- Healthcare
- Education
- Engineering
- Military training
- Business analytics
- Logistics and transport
As brain-to-device communication becomes more reliable, companies may start investing in tools that work alongside the chip.
---
## Clear Ethical and Legal Questions
As promising as this technology is, there are serious questions about privacy, safety, and long-term use.
### 1. **Who Controls the Brain Data?**
The chip reads a person’s brain activity. That data is extremely private. Experts say clear laws are needed to protect this kind of information from being shared or sold without permission.
### 2. **Can the Chip Be Misused?**
If hackers get access to the chip’s software, they might try to control what the chip reads or sends. For this reason, developers must use the highest level of security, just like in banking or military systems.
### 3. **Is There Consent and Choice?**
Everyone using the chip must give full consent. No one should be forced to wear it, especially in workplaces. Companies must not pressure employees to use brain-connected tools to increase speed or performance.
### 4. **Will the Chip Work Long-Term?**
Medical experts are still studying how long the chip will last inside the body. Some fear that future repairs or updates may be difficult, or that older chips may stop working safely. These concerns must be tested through careful long-term research.
### 5. **Who Will Benefit First?**
There is concern that only the wealthy or powerful companies may access these tools at first. This could create a new kind of inequality. Some believe government programs or public funding may be needed to make brain-chip tools available to more people over time.
---
## What Comes Next?
Neuralink is expected to expand human testing to more volunteers. The company is also working with regulators to ensure the chip meets high health and safety standards. If early tests continue to go well, the chip may be used beyond medical care and into business use in the next few years.
For now, countries like the United States are leading the way in policy-making and testing. But countries in Europe and Asia are also preparing to follow with their own laws and partnerships.
---
## Final Thoughts
Elon Musk’s Neuralink chip is showing early signs of success in restoring movement and communication. Now, the conversation is shifting toward business, education, and daily use. If developed responsibly, this chip could become one of the most important tools of the next decade.
But it must be handled with care, strong laws, and global cooperation. The future is exciting—but it must also be fair and safe.
### 📬 Follow DFmedia for More Breakthroughs
👉 Visit <https://df.media> for more science and business news that explains complex changes in simple terms.
**Categories:** Science
**Tags:** elon musk, neuralink chip
---
### [BRICS Breaks the Rules: 50% Tariff Shake-Up Disrupts Global Tech Power in 2025](https://df.media/brics-breaks-the-rules-50-tariff-trde-war-2025/)
**Published:** August 8, 2025
**Author:** Vishnu Priya
**Excerpt:** BRICS imposes unprecedented 50% tariff on Western tech imports. Explore the global sectoral impacts, U.S. market fallout, and FAQs on fast-changing trade dynamics.
**Content:**
## Why BRICS Is Turning the Tech Table in 2025
In a bold geopolitical move, **BRICS nations**—Brazil, Russia, India, China, and South Africa—have imposed a **50% tariff on high-value Western tech imports**, targeting semiconductors, AI chips, and cloud infrastructure hardware. The announcement has shocked markets and **triggered a global tech disruption** that’s rewriting the rules of international trade in 2025.
This massive step isn’t just about economics. It’s a **strategic maneuver by BRICS** to weaken Western tech dominance and build independent digital ecosystems. But what does it mean for global supply chains, Western companies, and the future of innovation?
---
## 🚨 What Sparked the BRICS 50% Tariff in 2025?
At the recent BRICS summit, the coalition accused Western nations of creating “algorithmic colonialism” through monopolized access to advanced AI technologies. As a response, the **50% tariff rule was introduced**, effective immediately across member nations.
The goal?
- Push domestic growth in AI and semiconductors
- Reduce tech dependency on the US and EU
- Establish BRICS as a standalone innovation bloc
Western nations, including the **United States, UK, and Germany**, have already responded with concerns filed at the WTO.
---
## 📉 Global Tech Disruption: Immediate Market Impact
The **immediate fallout from the BRICS 50% tariff 2025** was dramatic:
- **NASDAQ tech index dropped by 2.5%**
- **NVIDIA and AMD stocks fell**
- Major cloud infrastructure providers paused shipments to BRICS countries
- AI startups in the West are now facing blocked access to BRICS’ billion-user markets
**Supply chains** are seeing a reroute. China and India are ramping up domestic chip production, while Brazil is incentivizing open-source hardware R&D.
---
## 💥 Why This Tariff Breaks the Rules
What makes the **BRICS tech tariff** so disruptive?
1. **Unilateral Execution**: No prior trade negotiation or consultation with global bodies.
2. **Blanket Enforcement**: Targets all non-BRICS companies dealing in AI, cloud, chips, and even encrypted devices.
3. **Strategic Timing**: Aligns with a weakening Western chip supply chain post-pandemic and AI energy demand surge.
This **breaks traditional WTO norms**, especially those that support gradualist, bilateral tariff agreements.
---
## 🔧 Tech Industries Affected by the 50% BRICS Tariff
**Most affected sectors:**
- Semiconductors and AI chips
- Data center equipment
- IoT and smart device supply
- SaaS providers dependent on BRICS user data
- Cloud gaming, metaverse, and blockchain systems
For example, **Intel’s $1B investment in India** may now face regulatory delays, while **Google Cloud** services are being replaced by **BRICS-native platforms like BaikalNet and BharatCompute**.
---
## 🌎 What This Means for the Future of Global Tech
This isn’t just a tariff it’s a **tectonic shift in tech geopolitics**. Here’s what’s coming:
### 🧭 1. Rise of Parallel Tech Stacks
BRICS is now fast-tracking its own operating systems, AI frameworks, and quantum initiatives.
### 📡 2. Western Firms Forced to Rethink Asia Strategy
Companies may need to **create BRICS-specific subsidiaries** or risk total market exclusion.
### 🔗 3. Increased Decentralization
Expect more investment in **open-source AI** and decentralized data governance.
### 🏗️ 4. Supply Chain Rewiring
India and China will push more private-sector manufacturing to local hubs—disrupting current partnerships with Taiwan, South Korea, and the EU.
---
## 🧠 Expert Opinion: “Tech Sovereignty Has a New Flag”
According to **Dr. Lin Zhou**, a policy analyst at the Global Digital Policy Institute:
> “This is BRICS signaling a new kind of power—**one not just driven by natural resources, but by algorithmic influence and processor independence**. The West needs to evolve quickly.”
>
> #### Q1: **Which countries are in BRICS now?**
>
> **A1:** Original members include Brazil, Russia, India, China, and South Africa. Recent additions (making “BRICS+”) include Egypt, Iran, Indonesia, UAE, and Ethiopia.
> [Tradeimex](https://www.tradeimex.in/blogs/brics-summit-2025-global-trade-flows-tariff-threats-agreements?utm_source=chatgpt.com)
>
> #### Q2: **How long could U.S. markets remain volatile?**
>
> **A2:** While short-term volatility persists, analysts expect stabilization by Q4—depending on Fed direction, consumer resilience, and trade developments.
> [Financial Times](https://www.ft.com/content/6b0dd7d3-479d-4487-8ab4-2d33046f060d?utm_source=chatgpt.com)[Reuters](https://www.reuters.com/business/global-markets-trading-day-graphic-2025-08-07/?utm_source=chatgpt.com)
>
> #### Q3: **Will this tariff spark a trade war?**
>
> **A3:** The risk is significant. U.S. tariff escalation could push BRICS closer, increasing intra-bloc trade and de-dollarized payment systems.
> [Reuters](https://www.reuters.com/markets/could-trump-tariffs-become-bric-building-blocks-2025-08-07/?utm_source=chatgpt.com)[AInvest](https://www.ainvest.com/news/brics-nations-intensify-unity-counter-tariff-pressures-2508/?utm_source=chatgpt.com)
>
> #### Q4: **What sectors are best positioned to win?**
>
> **A4:** Commodity and defence sectors (like mining and rare metals) may benefit. Investors may also hedge with safe-haven assets like gold and U.S. Treasuries.
>
> ## Is Your Business Ready?
>
> If you’re a startup or tech business operating globally, it’s time to **diversify your markets and build BRICS-specific compliance frameworks**. This isn’t just a trade war—it’s the start of a new digital cold war. And **2025 may be the year BRICS breaks the Western tech monopoly** for good.
>
> ---
>
> ## 🔗 Related Articles:
>
> - [AI Energy Wars: Why Data Is the New Oil](https://df.media/)
> - [Smart Glasses in 2025: End of the Smartphone Era?](https://welpmagazine.com/smart-glasses-2025/)
> - [Digital Nomad Visas 2025: Work From Anywhere?](https://welpmagazine.com/)
**Categories:** Banking, Business, Finance, FinTech, Global News
**Tags:** tariff
---
### [New Tariffs Cloud India-U.S. Trade Prospects as Tensions Rise in 2025](https://df.media/new-tariffs-cloud-india-u-s-trade-prospects-as-tensions-rise-in-2025/)
**Published:** August 4, 2025
**Author:** Vishnu Priya
**Content:**
In a move that may significantly impact bilateral relations, former U.S. President Donald Trump announced a **25% tariff on Indian exports**, effective **August 1, 2025**. The declaration, made via his Truth Social platform, sparked immediate concern across key Indian industries and cast a shadow over ongoing efforts to stabilize **India-U.S. trade prospects**.
Trump’s statement accused India of imposing “some of the highest tariffs in the world” and criticized India’s growing strategic proximity to **BRICS nations** and its ongoing **energy and defense engagements with Russia**. While Trump is not in office, his comments are influencing the American political landscape ahead of the 2026 midterm elections, and are causing uncertainty in international trade circles.
---
### **Impact on Key Indian Sectors**
India’s major export sectors, including **textiles**, **pharmaceuticals**, and **automotive components**, are now facing an uncertain future. U.S. markets remain some of the largest for Indian goods in these categories, and the newly proposed tariffs could have ripple effects across supply chains and pricing structures.
Stock markets reacted cautiously, recovering from morning losses but with visible strain in export-linked indices. The **BSE Auto Index** dropped by 1.3%, while pharmaceutical stocks showed mixed trends amid speculation of further trade disruptions.
India’s **Ministry of Commerce and Industry** responded swiftly, stating:
> “We are closely studying the implications of this announcement and will engage with all stakeholders to evaluate an appropriate course of action.”
The ministry further indicated that internal consultations are underway to recalibrate current trade frameworks and avoid escalating tensions.
---
### **Geopolitical Undercurrents: BRICS and Beyond**
Trump’s reference to India’s active role in **BRICS**—which now includes new members like Saudi Arabia and Egypt—highlights growing global divides. India’s stance on maintaining a balanced relationship with both the West and Russia appears to be a key irritant for U.S. policymakers.
Experts believe that while the official Indian position supports multilateral dialogue, strategic decisions like increasing **oil imports from Russia** and **military cooperation through joint ventures** are under the scanner.
This isn’t the first instance of tariff tensions. During Trump’s presidency in 2018, the U.S. also imposed steel and aluminum tariffs globally, including on Indian producers. However, this new round appears more pointed and political.
---
### **What Lies Ahead for India-U.S. Trade Prospects?**
With no formal deal in place and tariff threats looming, the **India-U.S. trade prospects** are now marked by hesitation. Both governments had earlier signaled openness to a mini trade deal, focusing on digital services, clean energy, and manufacturing.
But the current climate suggests that without urgent diplomatic engagement, those talks may freeze.
Trade experts suggest a three-pronged response:
1. **Immediate diplomatic outreach** to clarify tariff intentions.
2. **Support packages** for affected industries.
3. **Diversification of export markets**, especially within ASEAN and Europe.
---
While this episode may not derail India-U.S. ties permanently, it reflects how geopolitics and economic interests are deeply intertwined. With **India poised to be the world’s third-largest economy by 2030**, both countries have much to gain from a stable trade relationship. But for now, the road appears bumpy.
**Stay tuned to** [DF Media](https://df.media) for updates on trade, technology, and innovation shaping global business.
Also check:
- [Microsoft’s $4T Market Cap Milestone](https://df.media/microsoft-fortran-market-cap-surpasses-4-trillion/)
**Categories:** Banking
---
### [Trump Imposes 25% Tariff on India and Warns of Additional Penalty Over Russian Trade Ties](https://df.media/trump-india-tariff-2025-penalty-russia-trade/)
**Published:** July 30, 2025
**Author:** Vishnu Priya
**Content:**
**Washington, D.C., July 30, 2025** – In a significant move that could reshape U.S.-India trade relations, President Donald Trump announced a **25% tariff on India** beginning August 1, citing long-standing grievances about India’s high tariffs, complex trade barriers, and continued economic cooperation with Russia.
Speaking via his social media platform Truth Social, Trump declared that while India is a valued ally, its protectionist trade policies and purchases of military and energy supplies from Russia warranted decisive action.
> “Remember, while India is our friend, we have, over the years, done relatively little business with them because their tariffs are far too high, among the highest in the world, and they have the most strenuous and obnoxious non-monetary trade barriers of any country,” Trump wrote.
This newly imposed **25% tariff on India** is a recalibration from the earlier 26% duty announced during what the administration called “Liberation Day,” but still represents one of the steepest trade measures taken against a U.S. ally in recent years.
---
### Background to the Decision
The U.S. administration’s decision comes amid heightened scrutiny of India’s trade policy, particularly its long-standing reliance on Russia for military equipment and energy resources. India is one of Russia’s largest arms buyers and has maintained consistent energy imports despite Western sanctions following Russia’s invasion of Ukraine.
Trump’s rhetoric has escalated in recent weeks, aligning India’s trade behavior with broader geopolitical concerns. His administration argues that India’s economic support to Russia undermines global efforts to isolate Moscow.
> “They have always bought a vast majority of their military equipment from Russia and are Russia’s largest buyer of energy, along with China,” Trump added. “At a time when everyone wants Russia to stop the killing in Ukraine — all things not good!”
---
### Penalty Warning Raises Global Tensions
In addition to the **25% tariff on India**, Trump has warned of a forthcoming “penalty” for India’s continued partnership with Russia. However, the nature of this penalty remains unspecified.
Economic experts speculate that this penalty could include restrictions on defense cooperation, further tariffs on Indian IT and pharmaceutical exports, or limitations on foreign investment access to U.S. capital markets. The ambiguity surrounding the “penalty” has left Indian policymakers on alert.
The announcement also comes at a time when the global economic climate is already strained by ongoing trade tensions between major economies. Analysts suggest the move could complicate India’s ambitions to position itself as a global manufacturing hub.
---
### Indian Government Response Expected
As of now, the Indian government has not officially responded to the tariff announcement. However, senior officials are expected to hold consultations with business leaders and trade advisors to assess the impact of the **25% tariff on India’s exports**, particularly in key sectors like textiles, pharmaceuticals, and electronics.
India has long defended its tariff policies as essential to protecting local industries and promoting domestic manufacturing under the “Make in India” initiative. Nonetheless, this new escalation could lead to a reassessment of its trade diplomacy with the U.S.
---
### Global Market Reactions
Following the announcement, financial markets across Asia showed signs of volatility, with Indian equities falling slightly in early trading. The Indian rupee also weakened against the U.S. dollar, while analysts predicted possible shifts in global supply chains if the tariffs remain in place long-term.
U.S.-India bilateral trade totaled approximately $191 billion in 2024, making the U.S. one of India’s largest trading partners. The introduction of a 25% tariff could significantly impact the flow of goods, raising costs for American companies relying on Indian manufacturing and outsourcing.
---
### What This Means Going Forward
The imposition of a **25% tariff on India** by President Trump marks a pivotal moment in U.S. foreign and economic policy. The move highlights the growing complexity of balancing strategic partnerships with national trade interests and geopolitical pressures.
With a potential penalty looming, India may soon be forced to reconsider aspects of its economic alignment, particularly its defense and energy engagements with Russia.
As the situation evolves, the global business community will be closely monitoring India’s response and any further actions from the Trump administration
For continued coverage on international trade developments and U.S. foreign policy shifts, follow Welp Magazine for real-time updates and expert analysis.India’s trade dynamics with the U.S. are entering a critical phase, with tariffs and geopolitical pressure mounting fast. As 2025 unfolds, Welp Magazine will continue to track these high-stakes developments. For more insights on global trade and political shifts, check out [DFmedia’s coverage on U.S.-India tensions](https://df.media/) and follow [WelpMagazine.com](https://welpmagazine.com) for real-time updates.
---
**Categories:** Banking, Finance
---
### [U.S.–EU Trade Deal 2025: A Powerful Push for Global Trade Optimism](https://df.media/us-eu-trade-deal-2025/)
**Published:** July 28, 2025
**Author:** Vishnu Priya
**Content:**
The long-anticipated **U.S.–EU Trade Deal 2025** is finally here — and markets across the globe are reacting with a sharp surge in optimism. In a world where geopolitical uncertainty has often left global investors guessing, this agreement marks a major turning point for trade diplomacy and economic momentum.
Over the weekend, U.S. and EU representatives signed a landmark trade pact that **slashes proposed tariffs from 30% to 15%**, particularly on key sectors such as automotive, pharmaceuticals, and green technologies. Investors and political analysts alike have called this a **“high-confidence deal”** likely to set the tone for economic recovery and policy alignment throughout the rest of the year.
---
## Why This Trade Deal Matters in 2025
At the heart of this agreement is a shift toward **open collaboration and supply chain transparency** between two of the world’s largest economic regions. With inflationary pressures easing and AI-led productivity driving output, this deal could not have come at a better time for industries that have weathered years of uncertainty since Brexit and post-pandemic disruptions.
Not only does this agreement improve bilateral relations, but it also **restores investor trust**, signaling a new era of **global trade optimism**. According to the Office of the U.S. Trade Representative, the move will **unlock over $350 billion in two-way trade** over the next five years.
---
## Market Reactions: Indices Rally on News
Following the announcement, major stock indices responded instantly:
- **FTSE 100** surged 2.8%
- **Dow Jones Industrial Average** gained 1.6%
- **DAX (Germany)** up by 2.1%
- **CAC 40 (France)** rose by 1.9%
These gains were driven by high-cap export stocks and tech manufacturers, which now face reduced tariff barriers on both sides of the Atlantic. Sectors like electric vehicles and digital services are expected to be early winners under the new deal framework.
---
## Political Will and Economic Momentum
Unlike previous trade rounds, this agreement reflects **a high level of political will and economic realism**. Both U.S. and EU leaders have acknowledged the need for common ground amidst rising challenges from authoritarian economies and climate threats.
This deal also aligns closely with **India–UK FTA 2025**, which sets a positive precedent for multilateralism. You can [read more about the India–UK FTA 2025 here](https://df.media/india-uk-fta-2025-landmark-deal/).
---
## Trade Deal Strengthens AI and Tech Sector Links
One of the most innovative aspects of the 2025 deal is a shared commitment to **cross-border AI regulation and ethical tech investment**. This is part of a broader trend in global policy-making, where democratic nations are looking to pool resources to manage emerging tech responsibly.
[OpenAI’s partnership with the UK government](https://beststartup.co.uk/openai-partners-with-uk-to-drive-ai-in-public-services/) reflects this shared vision, highlighting how trade and tech are increasingly interlinked in shaping the future of global governance.
---
## Business Voices Support the Agreement
Several major global CEOs, including from Siemens, Ford Europe, and IBM, have already welcomed the deal, calling it a **“clear roadmap for stability and growth.”** Small businesses that depend on import/export are especially optimistic about fewer administrative costs and faster trade clearance.
“This deal reduces the guesswork,” said a trade expert from the London School of Economics. “It’s a pro-business, pro-worker agreement.”
---
## Read More on This
- [Asian Markets Surge on U.S.–Japan Trade Optimism](https://df.media/asian-markets-surge-on-u-s-japan-trade-optimism-2025/)
- [India–UK FTA Deal 2025](https://df.media/india-uk-fta-2025-landmark-deal/)
- [OpenAI–UK AI Partnership](https://beststartup.co.uk/openai-partners-with-uk-to-drive-ai-in-public-services/)
#### The **U.S.–EU Trade Deal 2025** is more than just a tariff agreement it’s a **global signal of confidence** in open economies, digital futures, and transatlantic unity. At DF Media, we believe this is a defining step toward inclusive and innovative global trade.
Stay tuned at [DF Media ](https://df.media/)as we track further developments and sectoral insights across the world’s key markets.
**Categories:** Banking
---
### [Historic India–UK Trade Deal 2025: A Game-Changer for Global Growth](https://df.media/india-uk-fta-2025-landmark-deal/)
**Published:** July 25, 2025
**Author:** Vishnu Priya
**Content:**
The **India UK FTA 2025** has been officially signed, marking a historic breakthrough in bilateral economic relations. Indian Prime Minister Narendra Modi and UK Prime Minister Keir Starmer sealed the **UK India trade agreement** on July 24, 2025 at Chequers, with expectations the pact will add approximately **$34 billion annually** to bilateral commerce and target trade worth **$120 billion by 2030**. [The Economic Times+5India Briefing+5GOV.UK+5](https://www.india-briefing.com/news/india-uk-trade-deal-winners-and-economic-benefits-explained-38824.html/?utm_source=chatgpt.com)[The Times+11Reuters+11Reuters+11](https://www.reuters.com/world/uk/britain-india-sign-free-trade-pact-during-modi-visit-2025-07-23/?utm_source=chatgpt.com)[GOV.UK+1AP News+1](https://www.gov.uk/government/news/business-leaders-welcome-the-uk-india-free-trade-agreement?utm_source=chatgpt.com)
This **India UK FTA 2025** stands out as the UK’s biggest trade deal since Brexit and India’s most significant agreement with a European partner to date. Analysts call it a blueprint for high-standard trade pacts ahead. [Wikipedia](https://en.wikipedia.org/wiki/India%E2%80%93United_Kingdom_Free_Trade_Agreement?utm_source=chatgpt.com)[Reuters](https://www.reuters.com/world/uk/britain-india-sign-free-trade-pact-during-modi-visit-2025-07-23/?utm_source=chatgpt.com)[AP News](https://apnews.com/article/4d258647939f3d71fcbf4b795a059ca5?utm_source=chatgpt.com)
### 🚀 Key Gains from the India UK Trade Agreement
- **Tariff Eliminations:**
UK tariffs on Indian textile, leather, gems & jewellery, automotive and marine exports will drop to zero in most cases. 99% of Indian exports will enjoy duty-free access to the UK. [India Briefing](https://www.india-briefing.com/news/india-uk-trade-deal-winners-and-economic-benefits-explained-38824.html/?utm_source=chatgpt.com)[The Times of India](https://timesofindia.indiatimes.com/business/india-business/india-uk-trade-deal-highlights-from-99-duty-free-access-to-benefits-for-indian-professionals-heres-the-fta-in-10-big-numbers/articleshow/122886021.cms?utm_source=chatgpt.com)
- UK exports such as whisky, gin, salmon, cosmetics, and machinery will benefit from tariff reductions—some slashed from 150% to 30% over ten years. [Financial Times+2Reuters+2AP News+2](https://www.reuters.com/world/uk/britain-india-sign-landmark-free-trade-pact-during-modi-visit-2025-07-23/?utm_source=chatgpt.com)
- **Sector Wins:**
Indian micro and small enterprises in pharma, electronics, footwear, and chemicals will gain stronger market access. For the UK, industries like aerospace, automotive parts, and fintech will benefit. [India Briefing](https://www.india-briefing.com/news/india-uk-trade-deal-winners-and-economic-benefits-explained-38824.html/?utm_source=chatgpt.com)[Press Information Bureau](https://www.pib.gov.in/PressReleasePage.aspx?PRID=2147805&utm_source=chatgpt.com)[GOV.UK](https://www.gov.uk/government/news/business-leaders-welcome-the-uk-india-free-trade-agreement?utm_source=chatgpt.com)
- **Investment Surge:**
The agreement is expected to unlock **£6 billion in new trade and investment commitments**, particularly in AI, aerospace, and dairy. [AP News+1Financial Times+1](https://apnews.com/article/4d258647939f3d71fcbf4b795a059ca5?utm_source=chatgpt.com)
---
### 🏛️ Strategic Impact & Long-Term Outlook
This **India UK FTA 2025** has been endorsed as transformational by business leaders in both countries. Industry associations such as the Confederation of British Industry and UK India Business Council praised the pact as a clear signal that the UK remains open for global business. [The Economic Times+2GOV.UK+2Hindustan Times+2](https://www.gov.uk/government/news/business-leaders-welcome-the-uk-india-free-trade-agreement?utm_source=chatgpt.com)
As the UK’s first large-scale post-Brexit FTA, and India’s most comprehensive deal with a developed nation, the agreement could serve as a model for future trade talks with the EU or Asia-Pacific counterparts. [Reuters](https://www.reuters.com/world/uk/britain-india-sign-free-trade-pact-during-modi-visit-2025-07-23/?utm_source=chatgpt.com)
### 📈 Economic Forecast: Growth, Jobs, and Integration
Projected benefits of this **UK India trade agreement** include:
- Doubling bilateral trade from roughly $55 billion to **$120 billion by 2030**. [The Guardian+2Financial Times+2Wikipedia+2](https://www.ft.com/content/d08628d3-c02a-4541-8a42-de7616c40717?utm_source=chatgpt.com)[Press Information Bureau+1India Briefing+1](https://www.pib.gov.in/PressReleasePage.aspx?PRID=2147805&utm_source=chatgpt.com)
- Creation of jobs across sectors—expected boost to UK economy by **£4.8 billion annually**, and Indian MSMEs gaining scale in export clusters across Tiruppur, Surat, Chennai and elsewhere. [Wikipedia+3India Briefing+3The Guardian+3](https://www.india-briefing.com/news/india-uk-trade-deal-winners-and-economic-benefits-explained-38824.html/?utm_source=chatgpt.com)
- Enhanced professional mobility: The FTA includes limited visas for yoga instructors, artists, and creative professionals as part of cultural exchange and trade facilitation. [Financial Times+1AP News+1](https://www.ft.com/content/d08628d3-c02a-4541-8a42-de7616c40717?utm_source=chatgpt.com)
### ⚖️ Potential Challenges and Criticisms
Though widely hailed, critics have flagged weaker protections in labor, environmental, and health policy chapters. The absence of binding standards in these areas may require adjustments during ratification in both parliaments. [The Guardian](https://www.theguardian.com/politics/2025/jul/24/starmer-modi-uk-india-free-trade-agreement-deal-signed?utm_source=chatgpt.com)
Ongoing talks will also address UK concerns about India’s proposed carbon border tax and potential climate provisions. Negotiations for a separate bilateral investment treaty are still in process. [The Economic Times+15The Guardian+15Reuters+15](https://www.theguardian.com/politics/2025/jul/24/starmer-modi-uk-india-free-trade-agreement-deal-signed?utm_source=chatgpt.com)
---
### ✒️ Expert Insights
UK Trade Policy Head at BCC said: “This pact is a strong milestone for UK exporters and may unlock new growth in automotive and consumer goods.” HSBC UK and Standard Chartered leaders echoed enthusiasm for investment certainty in financial services under the **India UK FTA 2025**. [GOV.UK](https://www.gov.uk/government/news/business-leaders-welcome-the-uk-india-free-trade-agreement?utm_source=chatgpt.com)
In India, business councils called the FTA a `transformational milestone` and highlighted its impact across textile, gem, and pharma clusters.
The **India UK FTA 2025** marks a new era in bilateral trade relations. With ambitious targets, sweeping tariff cuts, and structural alignment in key sectors, the agreement promises elevated trade, investment, and integration for both economies.
For detailed sectoral analysis and trade implications, visit[ **DF Media**](https://df.media/) and follow **[Welp Magazine](https://welpmagazine.com)** for updates
**Categories:** Banking, Business, Finance
---
### [Japan Trade Deal 2025: PM Ishiba Hails Trump’s Massive Global Trade Shift](https://df.media/japan-trade-deal-2025-pm-ishiba-supports-trump/)
**Published:** July 23, 2025
**Author:** Vishnu Priya
**Content:**
**Japan trade deal 2025** took center stage today as Prime Minister Shigeru Ishiba publicly welcomed the announcement by former U.S. President Donald Trump of a new “massive” global trade framework. The deal, unveiled during a packed press conference in Washington, is expected to dramatically alter tariff structures affecting major Asian economies, including Japan.
The development comes just days after the U.S. House passed the GENIUS Act a landmark bill aimed at regulating stablecoins and digital asset trade flows. While the financial world was still reacting to crypto regulations, Trump’s announcement added yet another layer of intrigue to international trade dynamics.
### What Does the New Deal Mean for Japan?
In his statement, PM Ishiba emphasized that this deal could reshape bilateral ties between Tokyo and Washington. “We view this agreement as a foundation for long-term economic stability and fairness,” Ishiba said.
The **Japan trade deal 2025** includes changes to agricultural tariffs, rare earth exports, and digital commerce duties. It also promises reduced trade friction for auto parts and semiconductor supply chains, a move welcomed by Japanese manufacturers.
While the finer details of the deal remain under negotiation, early indicators suggest favorable outcomes for Japan’s export-heavy economy. The yen responded positively, appreciating slightly against the U.S. dollar after the announcement.
### Trump’s Tariff Legacy Revisited
The **Trump tariff announcement** marks a return to the former president’s aggressive trade posture, though this time with a more cooperative tone. Trump, speaking in a more diplomatic style, said the new trade pact “puts America first while respecting allies.”
Analysts believe this renewed engagement with allies such as Japan is an attempt to counterbalance China’s growing influence in the global supply chain.
Asian markets remained stable on the news, with Tokyo’s Nikkei index closing 0.7% higher. The move has fueled optimism in Japan’s business circles, particularly among automotive and tech exporters.
### Regional Implications and Reactions
South Korea and Taiwan have expressed cautious optimism, while China remained quiet on the matter. Experts say the **Japan trade deal 2025** could realign Asia-Pacific trade hierarchies.
“This is a major pivot,” said Noriko Tanaka, a Tokyo-based trade policy analyst. “If it sticks, Japan may see a rebirth in its competitive advantage.”
The **Japan economic outlook** for Q3 is expected to improve if the deal moves forward as planned. Government officials hinted that new tariffs imposed during the 2018–2020 period might be relaxed under this framework.
### Stability in a Volatile Global Economy
As war, inflation, and digital disruption continue to challenge global economies, this new alignment offers a rare glimpse of certainty. Japan’s prime minister seemed optimistic about rebuilding a global order based on predictable trade norms.
Financial experts at DF Media believe this new chapter in U.S.-Japan relations could lead to revived investor confidence and boost Japan’s GDP forecast.
### Stay updated with the latest in global finance and policy by following [DF Media](https://df.media) and [Welp Magazine](https://welpmagazine.com). Read more related coverage:
[Trump Tariff Threats Return in 2025](https://welpmagazine.com/japan-tariff-threat-2025/)
[Asia Markets Calm Before July Earnings](https://df.media/asia-markets-trade-data-in-july-2025)
**Categories:** Finance, Global News
**Tags:** japan, Japan trade deal 2025, us
---
### [U.S. House Approves GENIUS Act: Stablecoin Regulation 2025 Takes Center Stage](https://df.media/stablecoin-regulation-2025-genius-act-passed/)
**Published:** July 22, 2025
**Author:** Vishnu Priya
**Content:**
In a historic moment for digital finance, the U.S. House of Representatives has passed the **GENIUS Act**, a groundbreaking bill focused on **stablecoin regulation 2025**. The legislation, which now awaits final approval from former President Donald Trump, signals a massive shift in how digital currencies tied to fiat money will be governed in the United States.
This move comes at a time when the global economy is increasingly integrating blockchain-based currencies into mainstream systems. The **GENIUS Act** short for *Guidelines for Ensuring National Integrity Using Stablecoins*—aims to bring clarity, structure, and accountability to the rapidly expanding stablecoin market.
And for those following global crypto trends, this bill marks the true beginning of **stablecoinregulation2005** as a tangible, enforceable framework in the U.S.
### What the GENIUS Act Proposes
The GENIUS Act sets a new legal and operational standard for stablecoins, which are digital assets pegged to stable fiat currencies like the U.S. dollar or euro.
Here are the key points included in the bill:
- **Licensing & Registration**: All stablecoin issuers must register with federal agencies such as the U.S. Treasury and SEC.
- **Asset Reserves**: Each issued stablecoin must be backed by equivalent U.S. dollar reserves held in approved financial institutions.
- **Third-Party Audits**: Issuers will be required to undergo quarterly audits to ensure full transparency and reserve backing.
- **Redemption Rights**: Consumers are guaranteed the right to redeem stablecoins for USD at any time without fees.
- **Fraud Protection**: Enhanced measures for cybersecurity and fraud monitoring are built into the law.
These changes are designed to eliminate uncertainty, increase consumer trust, and attract institutional investment into the space.
---
### Why Stablecoin Regulation 2025 Is a Turning Point
The global stablecoin market surpassed $150 billion in circulation in early 2025. However, the lack of regulatory clarity had prevented major banks and investment firms from fully participating.
With the passing of the GENIUS Act, the U.S. sets the tone for how the digital dollar and its equivalents can be integrated into regulated finance systems. Experts believe this will push **bank-backed stablecoin initiatives**, like those from Morgan Stanley and Bank of America, further into development.
According to crypto finance analyst Clara Edmonds:
> “The GENIUS Act marks the start of institutional-grade stablecoin deployment. This will likely push the EU and Asia-Pacific economies to accelerate their own frameworks.”
---
### What Happens Next?
The bill is now with Donald Trump, whose influence in tech finance has remained strong. Insiders suggest he is expected to sign the bill into law within the month, likely championing it as a pillar of American innovation.
Once signed, regulatory enforcement is projected to begin in **Q4 of 2025**, giving companies a 90-day compliance period.From financial stability to consumer protection, **stablecoin regulation 2025** is shaping the next phase of global digital currency adoption. Whether you’re a fintech founder, institutional investor, or crypto enthusiast, the GENIUS Act is a signal: the era of unregulated stablecoins is over.
**Stay Informed with Us**
For more insights like this on global finance, digital currencies, and emerging tech trends, **follow [DFmedia](https://df.media)** and **[Welp Magazine](https://welpmagazine.com)**. We cover the stories shaping tomorrow’s economy before they hit the mainstream.
**Related Reads**:
- [Asia Markets Remain Calm Ahead of Earnings and Trade Data](https://df.media/asia-markets-trade-data-in-july-2025/)
- [Japan’s Tariff Threat Could Spark a Global Trade Shakeup](https://welpmagazine.com/japan-tariff-threat-2025/)
- [NVIDIA Becomes the First $4 Trillion Tech Powerhouse in 2025](https://df.media/nvidia-becomes-the-first-4-trillion-tech-powerhouse-in-2025/)
---
**Categories:** Banking
---
### [Claude AI Is Transforming Finance with Real Time Analyst Support](https://df.media/claude-ai-is-transforming-finance-with-real-time-analyst/)
**Published:** July 16, 2025
**Author:** Vishnu Priya
**Content:**
The future of financial analysis is arriving faster than expected, and at the center of it stands Anthropic’s new Claude AI platform. This powerful AI tool is designed to support financial analysts by pulling real time data, generating reports instantly, and making research workflows significantly faster and more accurate.
Claude AI is already being called a game changer by hedge funds, investment teams, and even tech-forward banks. But what exactly makes this tool so different from traditional systems?
---
### What is Claude AI for Finance?
Claude AI is a conversational platform built by Anthropic, one of the world’s leading AI research companies. Unlike typical financial tools that require dashboards or Excel formulas, Claude allows users to ask complex financial questions using natural language and get structured, accurate responses in seconds.
Claude connects directly with trusted data providers such as PitchBook, Morningstar, and Daloopa, allowing it to access and analyze public and private financial data with speed and precision.
---
### Why This Innovation Matters
Financial research has long been a manual, time-consuming process. Junior analysts typically spend hours combing through earnings reports, comparing valuations, or building decks for investment committees.
Claude removes those bottlenecks.
With Claude, users can:
- Get instant summaries of earnings calls
- Compare company valuations in seconds
- Pull sector-wide data on debt, equity, and M&A activity
- Generate full due diligence outlines automatically
This shift saves hours of repetitive work while giving teams the power to make faster, better-informed decisions.
---
### Who Is Using It?
Right now, Claude AI is being tested by major hedge funds and investment firms. It is also gaining interest among fintech startups and financial data platforms looking to embed AI in their core offerings.
Common use cases include:
- Sell side equity research
- Buy side portfolio screening
- Private market analysis
- ESG and macroeconomic research
Academic researchers are also using Claude to study complex data patterns across sectors and geographies.
---
### How It Impacts the Finance Job Market
One of the most talked about aspects of Claude’s launch is its potential effect on early-career roles in finance. Entry level analysts often spend most of their time on routine tasks such as gathering data or preparing slides. Claude can now do that work in a fraction of the time.
But this doesn’t necessarily mean jobs will be lost. Instead, roles are expected to evolve. Analysts can now focus more on interpretation, strategic thinking, and communication—skills that AI cannot easily replicate.
---
### Key Features of Claude AI
- Natural language interface
- Fast access to private and public company data
- Built-in data sourcing from leading providers
- Contextual explanations with every output
- Modular design for integration into fintech platforms
The platform is currently available through enterprise partnerships, with plans to expand access in the second half of 2025.
---
### Claude AI is more than a tool. It represents the growing intersection between finance and artificial intelligence. By turning static research into interactive, real time intelligence, Claude is setting a new standard for how finance professionals gather and use data.
Just as Bloomberg terminals changed finance in the 1980s, Claude may become the default interface for financial thinking in the AI age.
### **The question for firms now is not if they should adopt Claude AI, but how quickly. As the competition becomes more automated and data driven, tools like Claude are shaping the future of finance one query at a time**
**Stay ahead of the next wave in financial innovation [follow DF Media ](https://df.media/)for more stories shaping the future of business, data, and disruption.**
**Categories:** Banking, Finance
---
### [Legacy Meets Impact: Why Family Offices Are Choosing DoLand Pro in 2025](https://df.media/family-offices-choose-doland-pro-for-impact-reporting/)
**Published:** July 14, 2025
**Author:** Vishnu Priya
**Content:**
**Copenhagen, 11 July 2025** – As younger generations demand clarity, authenticity, and purpose in their wealth decisions, traditional financial institutions face a stark reality: ESG compliance isn’t enough. Leading family offices and foundations are now turning to **DoLand Pro**, the white-labeled impact reporting platform built for engagement, trust, and real outcomes.
### **Family Offices Need a New Kind of Reporting**
DoLand Pro offers a complete B2B solution tailored to the needs of multi-generational clients who expect their portfolios to reflect their values without greenwashing.
**What sets DoLand Pro apart for family offices:**
- Custom-Branded Reports that feel personal and aligned with client identity.
- Narrative-Driven Insights beyond ESG scores showing how capital creates change.
- Automation at Scale No more spreadsheets or compliance-only reports.
- Nuanced Impact Measurement built on recognized global standards.
“Family offices tell us their clients want real answers: What is my money doing? Who is it helping? DoLand Pro gives them the language and tools to answer those questions,” says Jakob Lage Hansen, CEO & Founder.
### **Designed for Legacy and Trust**
With €5,000 billion needed annually to meet the UN SDGs (UN, 2024), the stakes are high. Family offices play a critical role but only if equipped with tools that balance rigor with relatability. That’s where DoLand Pro shines.
Already implemented by values-driven leaders like Merkur Cooperative Bank, DoLand Pro is enabling the next wave of sustainable finance rooted in impact, storytelling, and transparency.
**See how DoLand Pro can help your clients create a lasting legacy at**[ www.dolandpro.com](http://www.dolandpro.com) 📩 Contact: **Jakob Lage Hansen, CEO** \| jakob@thisisdoland.com \| 📞 +45 23811942
---
**Discover how DoLand Pro helps family offices align wealth with purpose at [www.dolandpro.com](https://www.dolandpro.com).**
**For more fintech, sustainability, and business impact stories, visit [DF Media](https://df.media).**
**Categories:** Banking, Finance
---
### [DoLand Pro Expands Capabilities to Boost Credible, Scalable Impact Reporting for Financial Institutions](https://df.media/doland-pro-reinvents-impact-with-scalable-esg-tools/)
**Published:** July 12, 2025
**Author:** Vishnu Priya
**Content:**
**Copenhagen, 11 July 2025** – DoLand Pro, the Nordic fintech reshaping sustainable finance, announces the integration of several data sources and impact insights into its white-labeled reporting platform. This innovation is a pivotal step toward solving one of the industry’s biggest hurdles: delivering credible, actionable, and scalable impact insights across asset classes.
### **Tech + Impact = Scalable Trust**
With over 54% of investors eager to increase their sustainable investments but blocked by greenwashing fears and lack of trustworthy data (Source: Morgan Stanley), financial institutions face an urgent need to upgrade beyond compliance-driven ESG reports.
DoLand Pro’s new features empower clients to:
- Automatically source relevant impact data across listed/unlisted companies and alternative investments.
- Dive into the data for understanding of the drivers of impact
- Deliver dynamic, client-ready reports with personalized impact narratives.
“Our aim is to help institutions move from generic ESG checkboxes to impact reporting that actually builds trust with investors,” says Jakob Lage Hansen, CEO of DoLand Pro. “With our technology, we’ve made this both efficient and scalable.”
### **Meeting Regulatory and Generational Shifts**
With upcoming EU regulations and the ongoing $68 trillion intergenerational wealth transfer, banks and family offices must meet the rising demand for impact transparency, personalization, and digital experience. DoLand Pro’s new features directly support these needs, turning reporting into a strategic asset.
### **Industry Adoption and Growth**
Already trusted by Merkur Bank and leading financial institutions, DoLand Pro is now onboarding new partners across Europe, with a strong focus on family offices and foundations.
**Experience the future of impact reporting at**[ www.dolandpro.com](http://www.dolandpro.com) 📩 Contact: **Jakob Lage Hansen, CEO** \| jakob@thisisdoland.com \| 📞 +45 23811942
**Learn more about DoLand Pro’s next-gen impact platform at [www.dolandpro.com](https://www.dolandpro.com). For ongoing updates on business finance, ESG innovation, and fintech trends, follow [DF Media](https://df.media/).**
**Categories:** Business, Finance
**Tags:** business, FinancialFuture
---
### [Bitcoin ETF Inflows Hit Record High as Global Investors Bet Big on Crypto](https://df.media/bitcoin-etf-inflows-hit-record-high/)
**Published:** July 10, 2025
**Author:** Vishnu Priya
**Content:**
In just three days, **Bitcoin ETFs** have seen record-breaking inflows, marking one of the strongest weeks ever for crypto in traditional finance. Institutional investors, hedge funds, and even pension managers are now viewing **Bitcoin ETFs** as a serious long-term asset.
According to CoinShares and Bloomberg data, over **$1.9 billion** has flowed into Bitcoin ETFs since Monday, making this the **highest three-day inflow in 2025**. Wall Street is taking notice, and the global crypto market is responding with a surge in interest and price action.
---
### 📈 Why Bitcoin ETFs Are Gaining So Much Attention
**Bitcoin ETFs** allow investors to gain exposure to Bitcoin through regulated financial products, without having to buy or store the digital currency themselves. This makes crypto more accessible to large institutions and mainstream investors.
In January, several **spot Bitcoin ETFs** were approved in both the United States and Europe. Since then, adoption has accelerated across global markets, especially in **Singapore, Germany, and the UK**, where financial firms are adding crypto exposure to client portfolios.
---
### 🌍 Institutional Investors Are Changing the Game
This week’s ETF activity shows a **clear shift in investor sentiment**. Funds that once ignored or feared Bitcoin are now embracing it for diversification and long-term growth.
“This is not a retail-driven rally,” said a fund analyst from London. “These are billion-dollar decisions by risk managers and CIOs. Crypto is no longer a side bet.”
Large asset managers like **BlackRock**, **Fidelity**, and **VanEck** are leading the way, with their Bitcoin ETF products ranking in the top 10 for global inflows this week.
---
### 💹 What This Means for Bitcoin Price in 2025
As a result of rising ETF demand, the **Bitcoin price in 2025** is now approaching **$89,000**, marking a 14 percent rise in just seven days. Traders expect further upside if inflows continue and no new regulatory obstacles appear.
Meanwhile, smaller cryptocurrencies like **Ethereum**, **Solana**, and **Avalanche** are also seeing ETF-related products rise in interest, although not yet at Bitcoin’s level.
---
### 🧠 Crypto Finance Is Becoming the New Normal
The rise of **Bitcoin ETFs** is part of a broader trend: the merging of traditional finance and crypto. Banks and financial firms are hiring crypto analysts, building infrastructure, and working on regulated products like **tokenized assets** and **digital bond platforms**.
If ETF momentum continues, 2025 could become the year crypto finally reaches full financial legitimacy.
---
### 🔍 Want to Know More?
👉 [Follow DFmedia for updates on crypto finance](https://df.media/)
**Categories:** Banking
---
### [China’s Big Fund III Plans to Fix Chip Industry Problems](https://df.media/chinas-big-fund-iii-focuses-on-chip-industry/)
**Published:** July 9, 2025
**Author:** Vishnu Priya
**Content:**
### **China’s Big Fund III Plans to Fix Chip Industry Problems**
### **China is putting more money into solving problems in its chip-making industry. The new investment round, called China Big Fund III, will help local companies improve in areas where China is still behind. This includes building better tools for designing chips and machines for printing chips, called lithography systems.**
This move comes at a time when the United States is working to limit China’s access to advanced technology. Because of these restrictions, China wants to become more self-reliant and make its own high-tech equipment.
---
### **What is China Big Fund III**
China Big Fund III is part of the country’s national effort to grow its own chip industry. It follows two earlier rounds of investment. This time, the fund is not only giving money to companies, but also planning to support them for longer periods. This means China wants to help these businesses grow step by step and become stronger over time.
Earlier phases focused on building more factories. But now the focus is shifting to helping develop technology from the ground up.
---
### **Why These Tools Are Important**
Two of the biggest problems for China are in **chip design software** and **lithography machines**.
Chip design software helps engineers create chips that work faster and use less power. Most of these tools are made by companies in the United States. Without them, it is hard to design world-class chips.
Lithography machines are used to print circuits onto silicon wafers. The most advanced machines are made by a Dutch company called ASML. Due to U.S. restrictions, China cannot buy these machines. Without them, it is difficult to produce cutting-edge chips.
China Big Fund III will now put money into local companies trying to build these tools and systems on their own.
---
### **Why This Matters**
The United States has asked its allies not to sell advanced chip-making tools to China. These restrictions are slowing down China’s progress in technology. By focusing on long-term investment in its own companies, China hopes to reduce its dependence on foreign tools.
This could lead to a big shift in the global tech market in the future.
---
### **What Could Happen Next**
Experts say that solving these problems will take time. China may need several years to build good-quality tools and machines. But this new strategy shows that the country is ready to take on the challenge with patience and planning.
For now, the world is watching to see how far China Big Fund III will go in changing the global chip industry.
👉 [Follow DFmedia for more updates](https://df.media/)
**Categories:** Finance, Global News
**Tags:** CHINA, China’s Big Fund III
---
### [U.S. Tariff Hike on Allies Raises Global Trade Tensions](https://df.media/u-s-tariff-hike/)
**Published:** July 8, 2025
**Author:** Vishnu Priya
**Content:**
The latest U.S. tariff hike has sent shockwaves through global markets. On Monday, President Donald Trump announced new tariffs on several long-time U.S. trade partners, including Japan and South Korea. Starting August 1, a 25% import tax will apply to various goods from both countries
The **U.S. tariff hike** also includes:
- 36% tariffs on Thailand and Cambodia
- 32% tariffs on Indonesia
- 30% tariffs on South Africa
These sweeping trade measures mark a significant turn in America’s international trade strategy. The announcement was followed by a sharp drop in U.S. and Asian stock indexes, signaling investor concern over rising trade tensions.
### **Why the U.S. Tariff Hike Was Introduced**
According to the White House, the new **U.S. tariff hike** is meant to protect domestic industries, encourage fairer trade agreements, and reduce the national trade deficit. President Trump also signed an executive order on Monday, extending the original July 9 deadline for key trade negotiations to allow more time for discussion.
While the administration claims these tariffs are aimed at pressuring countries to reach stronger trade deals, critics argue they could damage long-standing alliances and harm U.S. consumers by raising prices on imported goods.
### **Who Will Be Affected**
This **U.S. tariff hike** will affect multiple sectors. Electronics, textiles, and machinery are expected to face immediate price increases. American companies that rely on imported parts or finished goods from South Korea and Japan may also see supply chain disruptions.
Retailers and logistics providers in Southeast Asia are preparing for export slowdowns, while governments across the Asia-Pacific region are reviewing possible responses, including counter-tariffs and trade route adjustments.
### **Global Response and Market Impact**
Early responses to the **U.S. tariff hike** have been cautious. South Korea’s trade ministry expressed “serious concern” and called for urgent dialogue. Japanese officials have yet to comment formally but are expected to meet with U.S. representatives later this week.
In Southeast Asia, officials from Thailand and Indonesia have raised alarms about the impact on manufacturing and exports. Economists warn that if this **U.S. tariff hike** continues to expand, it may trigger new trade disputes or even retaliation from affected countries.
On Wall Street, the reaction was swift. Major indices dipped within hours of the announcement. Analysts say the **U.S. tariff hike** added uncertainty to an already fragile global economy facing inflation, war tensions, and supply shortages.
### **What Happens Next**
The extended negotiation window provides a small chance for revised agreements before the tariffs are fully implemented. However, if no deal is reached, the **U.S. tariff hike** could mark the beginning of a more protectionist phase in global trade policy.
Trade observers are closely watching whether the Biden or Trump campaign will adopt similar positions in the lead-up to the 2026 elections. For now, the world is bracing for higher prices, slower trade, and deeper economic divisions.
**Categories:** Banking
---
### [Rising Oil Prices Put Pressure on Everyday Life in Many Countries](https://df.media/rising-oil-prices-put-pressure-on-everyday-life-in-many-countries/)
**Published:** July 4, 2025
**Author:** Vishnu Priya
**Content:**
## Oil Prices Are Rising Again
In July 2025, global oil prices crossed 95 dollars per barrel. This has become a growing concern for many countries, especially those that depend on oil imports. As the price of oil rises, the cost of living also begins to rise in many parts of the world.
This is not just a market change. It affects real people, real homes, and real families across Asia, Africa, and Latin America.
---
## Why Are Oil Prices Going Up?
There are a few key reasons why oil is becoming more expensive now:
**1. Conflict in the Middle East**
Fighting in parts of the Middle East has made it harder to move oil safely through major shipping routes. This has slowed down the supply.
**2. Lower Oil Production**
Countries like Saudi Arabia and Russia are not increasing oil supply. With fewer barrels of oil available, prices naturally go up.
**3. Global Demand is Growing**
As economies recover from past slowdowns, more people are traveling and industries are producing more goods. This leads to higher demand for oil.
---
## Which Countries Are Feeling the Impact?
Many developing countries are starting to feel the pressure. Here are some of the most affected:
### **India**
India is one of the largest oil importers in the world. Higher fuel costs are now making transport, vegetables, and household products more expensive. Indian farmers and delivery services are especially impacted.
### **Nigeria**
Nigeria is both an oil producer and an importer of refined fuel. Because the country relies on imported petrol, rising oil prices are hurting the budget. The government is trying to reduce fuel subsidies, but this could lead to protests and rising living costs.
### **Brazil**
In Brazil, fuel is a big part of the country’s transport system. Higher prices mean longer supply chains and costlier groceries. The currency is also weakening, which makes imports more expensive.
### **South Africa**
South Africa imports a lot of fuel. The local currency, the rand, has recently dropped in value. As a result, the fuel prices are rising, and people are spending more on basic needs.
### **Indonesia**
Indonesia uses a lot of fuel in public transport and farming. Rising oil prices are putting pressure on food prices and energy bills. The government may have to decide whether to cut spending or increase subsidies.
---
## What Are Governments Doing?
Countries are trying different steps to deal with the rising oil costs.
**Central Banks Raising Rates**
To fight inflation, central banks in countries like India and South Africa may increase interest rates. This helps slow down spending but also makes loans and credit more expensive.
**Cutting Fuel Subsidies**
Some governments are reducing subsidies on fuel. In Nigeria, this has already led to rising pump prices. Other countries may soon follow.
**Currency Support**
Governments are trying to keep their currencies stable by using dollar reserves. This helps manage the cost of imported oil but may not be a long-term solution.
---
## How Does This Affect People?
If oil prices stay high, people around the world could feel it in daily life:
- **More expensive fuel and public transport**
- **Higher food prices** due to transport costs
- **Slower job growth** as businesses face higher bills
- **Less government spending** on other areas like health or education
Families may need to cut back on savings or spend less on non-essential goods.
---
## What Might Happen Next?
If the global oil situation does not improve, countries may face:
- More inflation across Asia, Africa, and Latin America
- Lower currency values in countries that import oil
- Bigger government debts and tougher budget choices
- A slower pace of growth and investment
Experts say that if no new oil supply comes into the market, the price may rise above 100 dollars per barrel soon.
---
## What Can Be Done?
To prepare for the future, many countries are:
- Exploring solar, wind, and alternative energy
- Rethinking trade routes and supply chains
- Asking for help from the World Bank and IMF
- Making public campaigns to save energy
But these steps take time. For now, rising oil prices are already changing how millions of people live and work.
Want quick, clear updates on the global economy, crypto trends, and finance stories that matter?
👉 **Read more daily insights at [DFmedia](https://df.media/)**
**Categories:** Banking
---
### [PayPal’s Stablecoin Adoption Expansion Signals Growing Crypto Confidence](https://df.media/paypal-stablecoin-adoption-crypto-payments-2025/)
**Published:** July 3, 2025
**Author:** Vishnu Priya
**Content:**
## PayPal Expands Stablecoin Use Across the U.S.
PayPal has officially expanded the use of its U.S. dollar-backed stablecoin, PYUSD, across its platform for American users. The move comes after months of testing and regulatory collaboration, positioning PayPal at the forefront of consumer-level crypto adoption.
The stablecoin, launched in 2023 and issued by Paxos Trust Company, is now accessible to users for payments, peer-to-peer transfers, and wallet-to-wallet movement within the PayPal ecosystem. As of July 2025, the integration has been extended to Venmo and select e-commerce partners, further increasing real-world utility.
---
## Turning Crypto into Practical Payments
Unlike volatile cryptocurrencies that serve mainly as investment vehicles, PYUSD maintains a 1:1 peg with the U.S. dollar. This makes it stable enough to be used as a trusted digital cash equivalent. With over 400 million PayPal users worldwide, the company’s stablecoin initiative is one of the largest real-time deployments of tokenized fiat in the market.
PayPal is also integrating the stablecoin into checkout services, allowing users to pay merchants directly using PYUSD. For retailers, the benefit lies in lower transaction fees and faster settlement compared to traditional card processors.
---
## Regulatory-First Approach Wins Market Trust
What sets PayPal apart in the crowded digital asset space is its regulatory-first strategy. The company works closely with U.S. financial regulators and ensures that all stablecoin reserves are fully backed by U.S. dollar deposits and short-term U.S. treasuries.
The stablecoin’s issuer, Paxos, is already a licensed trust company, which strengthens the legitimacy of PayPal’s offering. This attention to compliance has helped avoid the scrutiny faced by many crypto-native platforms and builds trust with mainstream consumers and institutional investors alike.
---
## Competing in a Changing Payments Landscape
The rise of stablecoins is transforming how payments work globally. While central banks explore digital currencies and fintechs innovate around cross-border transactions, stablecoins like PYUSD offer a practical middle ground—familiar to users and easy for merchants to accept.
Competitors such as Stripe and Revolut have announced similar plans to integrate stablecoins, but PayPal’s early-mover advantage and large user base give it a head start in market penetration. The company is also reportedly working on adding multi-chain support for PYUSD, which would increase interoperability with external crypto wallets.
---
## Crypto Integration without the Volatility
One of the biggest challenges for crypto adoption has been volatility. PayPal’s model addresses this by isolating the utility of blockchain technology from the price fluctuations of traditional cryptocurrencies like Bitcoin or Ethereum. Users can enjoy fast, cheap, and secure digital transactions without exposure to unstable markets.
This model appeals especially to younger users, small businesses, and international freelancers seeking frictionless transactions. It also opens the door for stablecoins to replace or complement mobile wallets, prepaid cards, and international remittance tools.
---
## Global Expansion and Innovation
While the current rollout is limited to U.S. users, PayPal has indicated future plans to expand PYUSD internationally, pending regulatory approval. Industry insiders expect regional trials in Latin America and Southeast Asia within the next year.
PayPal’s approach to stablecoin integration could set the tone for other fintech giants, legacy banks, and even central banks looking to modernize their digital payment infrastructure.
The company’s strategy shows that stablecoin adoption is no longer a niche innovation—it is becoming a mainstream reality.
**Categories:** Cryptocurrency
---
### [The 1win Blueprint: Powering a Global Crypto Movement Through Innovation and Trust](https://df.media/the-1win-blueprint/)
**Published:** July 2, 2025
**Author:** Vishnu Priya
**Content:**
## A Vision Beyond Currency
In a landscape where cryptocurrencies are often limited to trading and speculation, 1win is building something different. The platform’s blueprint introduces a decentralised ecosystem that offers real-world utility, transparency, and security. The goal is not just to create another blockchain project, but to establish a sustainable foundation for global participation in the crypto economy.
At the heart of this vision is the idea that digital assets should do more than fluctuate in value. They should empower users, fuel communities, and provide meaningful access to tools that were once restricted by geography or financial status.
---
## Designed for the Everyday User
1win’s architecture is built with the end user in mind. From simplified interfaces to fast, low-cost transactions, every component of the platform is tailored for accessibility. This approach lowers the barriers to crypto engagement, making it easier for newcomers and experienced users alike to adopt blockchain-based solutions.
By prioritising user experience, 1win is taking crypto from the hands of technical experts and placing it firmly in the reach of the global public.
---
## Real-World Utility at Every Layer
One of the defining features of the 1win ecosystem is its focus on real-world impact. Unlike speculative coins or closed-loop systems, 1win offers tangible use cases ranging from global payments to integrated smart contracts that serve industries like gaming, retail, and services.
This practical orientation is attracting a diverse user base. Merchants, developers, and consumers are able to interact in a dynamic environment that supports utility and rewards contribution.
---
## Transparent by Design
1win places a premium on transparency. The system’s open architecture ensures that every transaction, governance action, and community initiative is recorded on-chain and visible to all participants. This model creates a trust-first environment where users feel informed and empowered.
Governance is community-driven, with voting mechanisms built directly into the ecosystem. Token holders play an active role in shaping updates, integrations, and future developments.
---
## Security as the Foundation
In today’s digital environment, platform security is non-negotiable. 1win employs a multi-layered security infrastructure, incorporating advanced encryption, third-party auditing, and automated threat response systems.
Beyond technology, the platform supports user education initiatives to raise awareness around best practices in asset protection, private key management, and scam avoidance. This holistic approach reduces the risk of compromise and strengthens user confidence in the system.
---
## A Truly Global Footprint
The 1win ecosystem is being rolled out across multiple continents, with strong traction in Asia, Eastern Europe, and Latin America. Its modular framework allows regional adaptation, supporting local fiat onramps, regulatory compliance, and cultural preferences.
Strategic partnerships with payment processors, wallet providers, and digital service firms ensure that users can participate in the crypto economy without facing institutional roadblocks.
---
## What Comes Next for 1win
Looking ahead, 1win plans to launch a series of ecosystem expansions that include decentralised finance products, NFT functionality, and cross-chain compatibility. These additions are designed to increase both the utility and scalability of the network.
The company is also exploring education and social impact programs aimed at improving digital literacy and financial inclusion in underbanked regions.
**Categories:** Banking
**Tags:** Bitcoin, crypto, FinancialFuture
---
### [Microchip Innovation 2025: How Tiny Tech Is Reshaping Global Power](https://df.media/microchip-innovation-2025-tiny-tech-revolution/)
**Published:** June 30, 2025
**Author:** Vishnu Priya
**Content:**
In 2025, microchips are no longer just components inside computers. They’ve become the engines of global transformation. From powering personal devices to securing nations, **microchip innovation 2025** is reshaping the foundations of modern life.
And it’s happening on a scale smaller than ever imagined.
---
### The Power Behind the Miniaturization
Microchips are getting smaller, but smarter. At the 3-nanometer level, these chips now house billions of transistors, each operating faster and using less energy. The result? Smartphones that outperform desktops, drones that navigate disaster zones, and medical implants that transmit data directly to hospitals in real time.
This miniaturization allows technology to go where it couldn’t before—into the human body, deep space, or compact wearables. It’s enabling devices to think faster, last longer, and reach farther.
---
### From Silicon Valley to Sovereignty: A Global Chip Race
The innovation wave is not limited to companies. Countries are now competing for chip dominance. With global tensions rising and supply chains under strain, governments are no longer treating microchips as optional infrastructure. They are strategic assets.
The United States, China, South Korea, and India are investing billions in semiconductor self-sufficiency. The U.S. CHIPS Act and India’s Semicon India initiative are examples of aggressive policy moves to secure domestic production and reduce reliance on external suppliers.
Whoever controls chip production could influence everything—from military operations to global finance.
---
### Everyday Life, Elevated
For consumers, this innovation means faster phones, more capable smartwatches, and more accurate health diagnostics. But it also means something deeper—**a shift in how people interact with the digital world**.
- In **healthcare**, microchips enable diagnostics-on-a-chip for real-time results.
- In **transportation**, advanced chips support fully autonomous navigation.
- In **agriculture**, precision farming is now driven by micro-sensor networks.
- In **defense**, edge-processing chips run AI surveillance in low-connectivity zones.
Each breakthrough is backed by shrinking silicon—and expanding ambition.
---
### What’s Holding the Industry Back?
Microchip innovation is moving fast, but not without hurdles. Manufacturing advanced chips requires rare materials, billion-dollar equipment, and extreme precision. Even minor disruptions in the supply chain can delay entire product lines.
Heat dissipation is another critical challenge. Smaller chips generate dense heat, and cooling them efficiently is a race in itself. Innovations like liquid cooling and graphene heat spreaders are being explored to keep progress on track.
---
### The Real Revolution Is Invisible
The world’s most powerful technologies are now measured in nanometers, not inches. **Microchip innovation 2025** is more than a tech trend it’s a new phase of industrial power. As chips shrink, their role grows. They are becoming the brain behind every innovation, visible or not.
And in a world increasingly defined by who leads in technology, the smallest components may determine the biggest futures.
**Categories:** Banking
---
### [Crypto Trap on Telegram – Don’t Fall for It](https://df.media/crypto-trap-on-telegram/)
**Published:** June 25, 2025
**Author:** Vishnu Priya
**Content:**
**It All Starts With a Promise That Sounds Too Good**
> “**They told me I’d make $3,000 overnight. I sent my crypto and by morning, they were gone.”**
Stories like this are becoming far too common. In 2025, Telegram—once seen as a safe space for crypto enthusiasts—is now ground zero for a fast-growing wave of scams. From fake investment groups to impersonated trading firms, scammers are using this platform to steal thousands from unsuspecting investors with promises of quick, guaranteed returns.
---
### How the Scam Begins
It often starts with a simple, friendly message. You’re either invited into a Telegram group or contacted directly by someone who claims to be a professional trader. They may pose as an analyst, a crypto coach, or even a representative from a well-known exchange.
The pitch sounds attractive:
“Invest $500 today and get back $2,000 tomorrow.”
“No risk. Guaranteed profits in 24 hours.”
Once you send your money usually in Bitcoin, Ethereum, or USDT the scam kicks in. Sometimes they ask for more, claiming you need to pay a release fee or unlock your profit. Other times, they vanish immediately. The Telegram account disappears, and so does your crypto.
### Who’s Behind These Scams?
These are not isolated incidents. Most of these frauds are run by organized groups working across borders. They use:
- Stolen photos from real crypto traders
- Fake testimonials and screenshots of fake profits
- Impersonated usernames that mimic real companies or influencers
- AI-style videos or voice clips to add fake credibility
- Simulated trading dashboards to show “live profit growth”
Telegram’s lack of ID verification, encrypted chats, and easy burner account creation make it the perfect tool for scammers to operate and escape undetected.
### Real Losses, Real Victims
This is not just online drama. People are losing real money—sometimes everything they had saved for years.
In the last 12 months alone, over **$2.3 billion in crypto** has been stolen through scams on messaging platforms, according to data from Chainalysis.
A woman in Los Angeles shared her experience. “He showed me videos, charts, and even held a Zoom call. It all felt legitimate. I sent $800 in ETH and minutes later, I was blocked.”
Many victims don’t come forward. Some feel ashamed. Others know there’s no real way to get their money back once it’s gone. Crypto transfers are irreversible, and scammers know this.
### Red Flags to Watch Out For
If you’re active on Telegram and involved in crypto, watch out for these warning signs:
- Promises of guaranteed or very fast profits
- Pressure to act quickly or invest before a deadline
- Requests for crypto payments to unknown wallets
- Profiles with no real history or vague activity
- No official registration, license, or contact details
If someone offers a shortcut to wealth, it’s usually a setup.
### How to Stay Safe in 2025
To protect yourself from these traps, follow a few basic rules:
- Never send crypto to someone you don’t personally know or haven’t verified
- Use regulated crypto exchanges that require identity checks (KYC)
- Don’t trust testimonials, screenshots, or dashboards unless verified independently
- Never share your wallet’s private key or seed phrase—not even with support agents
- Research every offer and look for community feedback or scam alerts
If an opportunity seems exciting but comes through an unsolicited Telegram message, think twice. A little caution now can save you from a major loss later.
### Don’t Let Greed Get Ahead of You
Crypto is a powerful tool but it’s also an easy target for fraud. In 2025, scammers are working smarter, faster, and harder. They know how to build trust quickly, and they know how to vanish just as fast.
If you’re ever pitched on Telegram, treat it as a warning sign. Verified opportunities don’t come through strangers in group chats. Your best asset in crypto isn’t just your wallet it’s your awareness.
---
**Categories:** Cryptocurrency, Finance, Global News
**Tags:** Bitcoin, Crypto Safety, Crypto Scam, Investor Protection, Online Fraud, Telegram
---
### [Global Economy Faces New challenges amidst IRAN & IRAQ WAR](https://df.media/global-economy-faces-new-challenges-amidst-iran-iraq-war/)
**Published:** June 24, 2025
**Author:** Vishnu Priya
**Content:**
**Daily Finance \| Global News \| June 24, 2025**
The escalating conflict between Iran and Iraq has sparked widespread concerns over the stability of the global economy. As tensions in the Middle East intensify, the **Iran-Iraq War Global Economic Impact** is becoming more evident, triggering oil price surges, stock market turmoil, and rising fears over global recession.
---
## What Sparked the Iran-Iraq War?
The dispute began over control of oil-rich regions along the Iran-Iraq border, particularly near the Persian Gulf, one of the world’s most critical energy corridors. Iran accuses Iraq of violating territorial agreements and exploiting disputed oil fields. In retaliation, Iran launched missile strikes on key Iraqi energy facilities near Basra.
This conflict quickly drew global superpowers into the equation. The United States has strengthened its military presence to safeguard energy interests, while China and Russia are backing Iran to challenge Western influence. With world powers now involved, the crisis poses an unprecedented risk to global financial stability.
---
## The Iran-Iraq War Global Economic Impact
### Oil Prices Skyrocket
Global oil prices have surged to over **$120 per barrel**, the highest levels since 2022, as fears grow over disrupted supplies from the Middle East. The surge in fuel prices is set to drive global inflation, affecting transport, manufacturing, and household budgets worldwide.
### Stock Market Volatility
Stock markets reacted with immediate sell-offs. Major indices such as the **Dow Jones**, **FTSE**, and **Nikkei** experienced sharp declines as investors sought safe-haven assets like gold, government bonds, and the US dollar.
### Supply Chains Disrupted
Flight routes over conflict zones have been suspended, causing delays in global cargo shipments. Trade routes through the Middle East, especially key shipping lanes in the Gulf, face significant disruptions, threatening timely delivery of essential goods.
### Rising Economic Uncertainty
The war’s ripple effects are threatening job markets worldwide. Sectors such as energy, exports, logistics, and tourism are bracing for hiring freezes and potential layoffs as the conflict escalates.
---
## What’s Next for the Global Economy?
Global leaders are calling for urgent peace talks to stabilise the region and prevent further damage to the global economy. However, with superpowers like the US, China, and Russia taking opposing sides, the road to peace remains uncertain.
Economists warn that prolonged conflict could lead to a global recession, higher inflation, rising unemployment, and weakened consumer confidence. The world is watching closely as the Iran-Iraq War unfolds, shaping the future of the global economy
The **Iran-Iraq War Global Economic Impact** is already being felt in oil markets, financial exchanges, and supply chains. As uncertainty deepens, businesses, investors, and everyday citizens must brace for challenging times ahead.
**Stay with Daily Finance for trusted updates, economic insights, and breaking global news.**
Stay tuned to [**Daily Finance** ](https://df.media/ "Daily Finance ")for reliable, balanced updates on this developing situation.
**☮️ Peace and stability remain the ultimate goals for global prosperity.**
**Categories:** Banking, Capital Markets, Finance, Global News
**Tags:** FinancialFuture
---
### [Intelligent Document Processing for Banking: Fraud Detection, KYC, and Loan Approvals](https://df.media/intelligent-document-processing-for-banking-fraud-detection-kyc-and-loan-approvals/)
**Published:** April 11, 2025
**Author:** Daily Finance
**Content:**
The banking sector is rapidly adopting new digital innovations, utilising artificial intelligence (AI) and automation to improve operational efficiency, customer experience and security. [Intelligent Document Processing](https://nectain.com/what-is-intelligent-document-processing-overview-benefits-and-use-cases/) (IDP) is a key technology in this transformation, managing vast amounts of documents and ensuring regulatory compliance. By automating document handling, IDP helps banks reduce fraud, improve regulatory compliance and speed up critical processes like loan approvals.
This article will look at how IDP is changing fraud detection, Know Your Customer (KYC) and loan approvals in banking, by examining its benefits, features and future potential.
## **Fraud Detection with IDP**
Fraud detection is a big issue for banks, as these activities can lead to financial losses and reputational damage.Traditional fraud detection methods involve manual verification, which is time-consuming and subject to human error. IDP identifies fraud automatically through:
- **Automated Data Extraction & Analysis**: AI-driven IDP systems scan documents for abnormalities, identifying inconsistencies that could be suggestive of fraud. These systems can flag discrepancies in financial statements, transaction history and identity documents.
- **Pattern Recognition & Machine Learning**: IDP uses machine learning algorithms to detect suspicious behaviour in transaction records and customer documents. Over time, these algorithms improve, so banks can recognise and respond to emerging fraud patterns.
- **Real-time Verification**: IDP cross checks submitted documents with government databases and other trusted sources to verify authenticity. This prevents identity fraud and fake document submissions.
- **Reduced Human Errors**: By minimising manual data entry, IDP reduces the risk of oversight or manipulation. It ensures greater accuracy and reduces the chance of fraudulent applications slipping through.
By using IDP, banks can significantly improve their fraud detection while reducing the resources required for manual fraud reviews.
## **KYC Compliance**
KYC regulations require banks to verify customer identities, which prevents money laundering, terrorist financing and other financial crimes. The traditional KYC process involves handling a huge number of identity documents, utility bills and financial statements—tasks IDP can automate and optimise.
IDP enhances KYC compliance through:
- **Automated Identity Verification**: OCR and NLP extract and validate data from identity documents like passports, driver’s licences and proof of address documents. AI powered IDP systems can detect forged or tampered documents with high accuracy.
- **Document Classification**: AI powered IDP categorises and indexes KYC documents, making compliance audits more efficient. It organises customer records so that all required documents are in place and easily retrievable.
- **Reduced Onboarding Time**: Automated data extraction and verification reduces the time taken for new customer onboarding. Customers can open accounts faster, making for a better user experience.
- **Data Accuracy**: IDP eliminates manual entry errors, and ensures customer records are complete and up to date. Inconsistencies are flagged for review, reducing compliance risk.
Through IDP, banks are able to increase regulatory compliance, reduce onboarding friction and provide a satisfying customer experience.
## **Loan Approvals**
Loan processing is a paper-based and time-consuming activity, which includes the collection and verification of multiple financial documents.Manual processing leads to delays, errors and increased operational costs. IDP optimises loan approvals with:
- **Automated Document Processing**: IDP extracts and structures information from applications, tax documents and financial statements, reducing manual intervention and speeding up processing times.
- **Instant Creditworthiness Assessment**: AI algorithms analyse customer income, credit history and liabilities to assess risk factors efficiently. IDP enables real-time analysis of an applicant’s financial health, leading to faster and more accurate lending decisions.
- **Fraud Prevention**: By cross checking application data with third party sources, IDP can expertly identify fraudulent claims. It flags inconsistencies in reported income, employment history and supporting documents.
- **Faster Decision Making**: IDP reduces manual intervention, so banks can approve loans in hours not days. Automated workflows ensure approved applications move through the lending process seamlessly.
Through IDP, banks can provide customers with a quicker, more standardized loan process and reduce the risks of fraud and errors.
## **IDP for the Next Generation of Banking**
Intelligent Document Processing is transforming banking operations with security, compliance and efficiency in fraud detection, KYC checks and loan disbursements. As banks adopt IDP solutions they can expect cost savings, customer satisfaction and better risk management.IDP is not just a technology upgrade, but a must have for banks to be competitive in the digital world. With AI automation, banks can improve compliance, simplify operations and offer faster, safer services to customers. As IDP gets more advanced it will be even more vital for banking.
**Categories:** Banking, Business, Finance
---
### [DoLand Pro Unveils Automated Impact Reporting to Help Banks Meet ESG and Impact Demands](https://df.media/doland-pro-unveils-automated-impact-reporting-to-help-banks-meet-esg-and-impact-demands/)
**Published:** March 21, 2025
**Author:** Daily Finance
**Content:**
\[Copenhagen, 21/3-2025\] – DoLand Pro, a fintech innovator in impact-driven investing, has launched an automated impact reporting solution designed to help banks, multi-family offices, and foundations meet growing client demands for transparency, sustainability, and meaningful impact insights.
### **The Growing Need for Impact Reporting**
With 54% of global investors planning to increase their sustainable investments within the next year (Source: Morgan Stanley), financial institutions are under pressure to offer more than just ESG compliance—they must provide meaningful impact insights that engage and build trust with investors. Traditional impact reporting is often manual, fragmented, and difficult to interpret, leaving investors frustrated and disengaged.
DoLand Pro solves this challenge by providing automated, up-to-date impact reports that are:
- Beyond ESG – Focuses on real-world impact, not just regulatory compliance.
- Automated & Scalable – Eliminates inefficient, manual reporting processes.
- Customizable & White-Labeled – Banks and family offices can brand the reports as their own.
- Engaging & Transparent – Transforms complex data into relevant insights and stories.
**“Investors today demand more than ESG scores—they want clear, tangible proof of real-world impact. With DoLand Pro, financial institutions can provide the transparency and insights that build long-term trust and engagement,”** says Jakob Lage Hansen, CEO & Founder of DoLand Pro.
### **Real-World Success: A Growing Client Base**
DoLand Pro has already gained traction, not least with Merkur Bank, a European sustainability leader.
**“With DoLand’s reporting solution, we are able to demonstrate the impact of our clients’ entire investment portfolio — a significant value-add,” says Charlotte Skovgaard, CEO of Merkur Cooperative Bank,”**
Financial institutions looking to differentiate, future-proof their offerings, and engage next-gen investors can learn more at www.dolandpro.com.For media inquiries or to request a demo, contact:
📩 Jakob Lage Hansen, CEO \| jakob@thisisdoland.com \| 📞 +45 23811942
**Categories:** FinTech, Global News, Investing
---
### [A Deep Dive into Trading Strategies for Consistent Returns](https://df.media/a-deep-dive-into-trading-strategies-for-consistent-returns/)
**Published:** January 21, 2025
**Author:** Daily Finance
**Content:**
Image by [TheInvestorPost](https://pixabay.com/photos/man-computer-stock-trading-iphone-5782411) from Pixabay
Image alt: Stock trading
Trading in financial markets seems like a high-stakes game where fortunes can be made or lost in the blink of an eye. Many are drawn to its allure, captivated by stories of meteoric gains and the promise of financial independence. But beneath the surface lies a more complex reality: achieving consistent returns requires more than luck or intuition. It demands discipline, strategy, and in-depth knowledge of market dynamics.
Thus, this article delves into the world of trading strategies, breaking down what it takes to navigate the markets successfully.
## Proven Strategies for Consistent Returns
Building a strong foundation is critical for achieving consistent success in trading. One of the key pillars of such a foundation is discipline and emotional control, as markets are inherently unpredictable and can provoke fear, greed, or impulsive decisions. Thus, traders must adhere to their strategies, even in volatile conditions, to avoid costly mistakes like overtrading or abandoning stop-losses.
Equally important is education, which lays the foundation for informed decision-making. Thus, understanding technical and fundamental analysis, market behavior, and economic factors allows traders to develop sound strategies and adapt to changing conditions. Trading education programs can offer sound advice and tips.
Nevertheless, before you commit, read reviews to assess credibility and whether a program aligns with your learning goals. For instance, a [detailed Profit Surge Trader review](https://www.wallstreetzen.com/blog/profit-surge-trader-review/) examines factors like the quality of educational resources, the relevance of strategies taught (e.g., earnings-driven trading), the user experience, and the overall trustworthiness.
Once you have a solid grasp of the foundational concepts, you can now focus on learning specific strategies like the following:
### Trend Following
Trend following is one of the most straightforward yet effective trading strategies, relying on the principle that the trend is your friend. The idea is to identify and align your trades with the prevailing direction of the market. This strategy works because trends—whether bullish (upward) or bearish (downward)—tend to persist for a period, providing ample opportunities to profit.
Traders use tools like moving averages, MACD (Moving Average Convergence Divergence), and trendlines to identify and confirm trends. For example, when a stock price crosses its 200-day moving average, it often signals the beginning of an uptrend. Successful trend followers monitor these indicators, enter trades early, and exit when signs of reversal appear.
While it sounds simple, this strategy requires discipline to avoid prematurely exiting trades or chasing false trends.
### Mean Reversion
Mean reversion relies on the idea that prices, over time, tend to return to their historical averages or fair values. This strategy works well in range-bound markets, where prices oscillate within a predictable range, allowing traders to buy low and sell high.
Indicators like the Relative Strength Index (RSI) and Bollinger Bands are essential for this approach. RSI helps identify overbought or oversold conditions, signaling when prices may reverse. For example, an RSI reading below 30 can indicate an oversold asset ripe for a rebound. Further, Bollinger Bands highlights price extremes relative to recent averages, helping traders spot entry and exit points.
### Swing Trading
Swing trading focuses on capturing price movements over days or weeks, making it an excellent strategy for those who cannot[ monitor the market constantly](https://df.media/the-importance-of-financial-literacy-why-its-crucial-for-your-financial-health). Hence, this approach combines trend following and mean reversion elements, identifying medium-term opportunities in trending or range-bound markets.
Swing traders rely heavily on technical analysis, using chart patterns, candlestick formations, and momentum indicators like the Stochastic Oscillator or Moving Averages. For instance, they might buy when a stock rebounds off a support level and sell near resistance, taking advantage of predictable price swings.
What makes swing trading appealing is its flexibility—it suits traders with limited time and helps them balance frequent trading and long-term investing. However, it requires thorough preparation, as trades can span several days, exposing positions to overnight risks or unexpected market news.
### Breakout Trading
Breakout trading focuses on capitalizing on significant price movements when an asset breaks through established support or resistance levels. These breakouts often signify the beginning of a new trend driven by increased market interest and trading volume.
Traders use horizontal support and resistance lines, pivot points, or chart patterns like triangles and flags to identify breakouts. A classic breakout trade occurs when a stock breaches a resistance level on high volume, signaling strong buyer momentum.
Breakout trading requires vigilance and quick execution. False breakouts—where prices revert to their previous range—are a common risk. To mitigate this, many traders wait for confirmation, such as breakout level retest, before committing fully to the trade.
### Arbitrage
Arbitrage exploits price inefficiencies between markets or assets to generate risk-free or low-risk profits. This approach is most common in highly liquid markets, such as forex or cryptocurrency trading, where slight discrepancies in pricing can occur.
For example, a[ trader might notice](https://df.media/the-future-of-digital-finance-how-cryptocurrencies-are-shaping-the-global-economy) that Bitcoin has a slightly lower price on one exchange than another. By buying low on the cheaper exchange and selling high on the other, they can lock in a small, consistent profit. Advanced forms of arbitrage, like statistical or merger arbitrage, involve more complex setups but can yield significant rewards for those with the expertise.
The main challenge with arbitrage is the need for speed and precision. These opportunities are fleeting, and success often requires specialized trading algorithms or access to high-speed trading platforms.
### Momentum Trading
Momentum trading involves riding the wave of assets that show strong upward or downward price movements. The strategy is rooted in the belief that assets exhibiting high momentum are likely to continue in the same direction due to the inertia of market sentiment.
Momentum[ traders use indicators](https://pages.stern.nyu.edu/adamodar/New_Home_Page/invfables/charting.htm) like the Average Directional Index (ADX) and Volume Weighted Average Price (VWAP) to identify assets with strong directional moves supported by significant trading volume. For instance, a stock breaking out of a consolidation pattern on high volume often signals a momentum trade opportunity.
While momentum trading can lead to substantial profits, it is risky, as trends can reverse suddenly. Therefore, this strategy requires quick decision-making and tight risk controls, such as stop-loss orders, to protect against sharp pullbacks.
## Conclusion
Consistent trading success depends on a strong foundation, proven strategies, and adaptability to changing market conditions. For instance, incorporating effective risk management practices, such as position sizing and diversification, safeguards capital and creates stability for long-term growth.
In addition, mastering technical and fundamental analysis provides the tools to identify opportunities and navigate the complexities of the market. By integrating these elements, traders position themselves to build confidence and thrive in an ever-evolving trading landscape.
**Categories:** Banking
---
### [10 Ways Your Business Can Better Track Its Finances](https://df.media/10-ways-your-business-can-better-track-its-finances/)
**Published:** December 29, 2023
**Author:** Daniel Reynolds
**Content:**
Managing finances is a crucial aspect of running a business. It can be challenging to keep track of all the expenses, especially when you’re dealing with multiple transactions every day. However, with the right tools and strategies, you can streamline your financial management process and ensure that your business stays profitable. Here are ten ways your business can better track its finances:
## 1. Use Accounting Software
Accounting software is an essential tool for any business. It can help you keep track of your expenses, generate invoices, and manage your cash flow. There are many accounting software options available, [such as QuickBooks, Xero, and FreshBooks](https://www.investopedia.com/best-accounting-software-for-small-business-5069679). Choose one that suits your business needs and budget.
## 2. Keep Track of Your Receipts
Keeping track of your receipts is crucial for accurate financial management. Make sure you have a system in place to organize your receipts, such as a digital filing system or a physical folder. This will help you keep track of your expenses and make it easier to file your taxes.
## 3. Monitor Your Cash Flow
Cash flow is the lifeblood of any business. It’s essential to monitor your cash flow regularly to ensure that you have enough money to cover your expenses. Use accounting software to generate cash flow statements and monitor your cash flow in real-time.
## 4. Create a Budget
Creating a budget is an effective way to manage your [finances](https://df.media/category/finance/). It can help you plan your expenses, identify areas where you can cut costs, and ensure that you have enough money to cover your bills. Make sure you create a realistic budget that takes into account all your expenses.
## 5. Use Fuel Cards
The [UK Fuels card](https://www.icompario.com/en-gb/fuel-cards/uk-fuels/) is an excellent way to manage your fuel expenses. They allow you to track your fuel expenses in real-time and provide you with detailed reports on your fuel usage. This can help you identify areas where you can cut costs and ensure that you’re not overspending on fuel.
## 6. Automate Your Invoicing
Automating your invoicing can save you time and reduce errors. Use accounting software to generate invoices automatically and send them to your clients via email. This will help you get paid faster and ensure that your invoices are accurate.
## 7. Keep Your Personal and Business Finances Separate
Keeping your personal and business finances separate is essential for accurate financial management. Use separate bank accounts and credit cards for your personal and business expenses. This will help you keep track of your expenses and make it easier to file your taxes.
## 8. Monitor Your Accounts Receivable
Accounts receivable is the money that your clients owe you. It’s essential to monitor your accounts receivable regularly to ensure that you’re getting paid on time. Use accounting software to generate reports on your accounts receivable and follow up with clients who are behind on their payments.
## 9. Negotiate with Your Vendors
Negotiating with your vendors can help you save money on your expenses. Ask your vendors for discounts or better payment terms. This can help you reduce your expenses and improve your cash flow.
## 10. Hire a Professional
When it comes to securing your financial future, working with a [Financial Planning Advisor](https://www.planetpositiveplanning.com/) can be an invaluable step. They can guide you through the complexities of financial planning, ensuring that your investments, savings, and retirement plans are well-structured and aligned with your long-term goals. By leveraging their expertise, you can make informed decisions that support your overall financial well-being.
If you’re struggling to manage your finances, consider hiring a professional. A financial advisor or accountant can help you develop a financial management strategy that suits your business needs. They can also provide you with valuable advice on how to improve your cash flow and reduce your expenses.
**Categories:** Finance, FinTech
**Tags:** Accounting, Fuel Card, Tracking
---
### [Why Coffee Prices Are Brewing Near Record Highs](https://df.media/why-coffee-prices-are-brewing-near-record-highs/)
**Published:** December 16, 2024
**Author:** Daily Finance
**Content:**
Coffee, one of the world’s most beloved commodities, has recently seen prices soar to near half-century highs. For coffee lovers, this might mean pricier cups of their favorite brew, while for industry players, the surge signals deeper issues in the global coffee supply chain. Let’s explore the factors driving this price spike and what it means for the global market.
### **The Factors Behind the Coffee Price Surge**
1. **Climate Challenges
Coffee production is highly sensitive to weather patterns, and recent climatic disruptions have significantly impacted key growing regions. Brazil, the world’s largest coffee producer, has faced a series of challenges, including erratic rainfall, frost, and droughts. These weather events have reduced crop yields, tightening the supply chain.
2. **Rising Production Costs
From labor to fertilizers, the cost of producing coffee has surged. Global inflation has added to the burden, with higher costs being passed along the supply chain. Farmers, already dealing with the impacts of climate change, are now facing financial strains, further reducing their capacity to meet global demand.
3. **Geopolitical Tensions
Trade disruptions and geopolitical uncertainties have complicated the movement of coffee across borders. Delays in shipping and increased costs for transporting goods have created bottlenecks in the supply chain, further elevating prices.
4. **Increased Global Demand
The global appetite for coffee remains insatiable. Rising demand from emerging markets, combined with a steady increase in consumption in traditional coffee-drinking nations, has exacerbated the supply-demand imbalance.
### **Impact on Consumers and Businesses**
For consumers, this price hike could translate to higher costs at their favorite cafes and grocery stores. Specialty coffee shops and smaller roasters might face the greatest challenges, as they often operate on tighter margins and are more exposed to price fluctuations in raw materials.
For farmers and producers, the situation presents both challenges and opportunities. While higher prices might offer short-term financial relief, the long-term sustainability of coffee farming remains under threat due to rising production costs and environmental pressures.
### **A Need for Sustainable Solutions**
The coffee industry is at a crossroads. To address these challenges, stakeholders must focus on sustainable solutions:
- **Investing in Climate-Resilient Farming:** Supporting farmers with access to climate-resilient crop varieties and farming techniques is crucial to ensuring long-term supply stability.
- **Strengthening the Supply Chain:** Improving infrastructure and reducing inefficiencies in transportation and logistics can help mitigate price spikes caused by delays.
- **Fair Trade Practices:** Ensuring that farmers receive fair compensation for their labor and investment is essential for sustaining coffee production in the years to come.
### **Looking Ahead**
As coffee prices brew near record highs, the world is reminded of the delicate balance between supply, demand, and sustainability. While the current market challenges pose significant hurdles, they also present an opportunity for the industry to innovate and adapt.
For coffee enthusiasts, every cup now tells a richer story—one of resilience, adaptation, and the global interconnections that bring this beloved beverage to life.<https://www.reuters.com/business/why-are-coffee-prices-trading-near-half-century-highs-2024-12-04/>
**Categories:** Global News
---
### [Protectionism and its Risks to Global Growth: Insights from the OECD](https://df.media/protectionism-and-its-risks-to-global-growth-insights-from-the-oecd/)
**Published:** December 16, 2024
**Author:** Daily Finance
**Content:**
The Organisation for Economic Co-operation and Development (OECD) has recently issued a stark warning about the growing risks of protectionism to global economic growth. As nations face escalating geopolitical tensions, supply chain disruptions, and inflationary pressures, a shift toward economic isolationism could hinder the much-needed recovery from recent economic downturns.
### **A Slowdown in Growth Projections**
The OECD projects a modest global economic growth rate of 2.7% for 2024, a slight deceleration compared to the anticipated 3.3% in 2023. While inflation has shown signs of easing, concerns over economic nationalism and trade barriers have the potential to dampen this progress further.
According to the OECD, protectionist measures, including increased tariffs and restrictions on cross-border investments, could disrupt global trade and investment flows. This would be particularly damaging for emerging markets that rely heavily on global integration for economic stability and development.
### **The Return of Trade Barriers**
Over the past decade, globalization has been the engine of growth, lifting millions out of poverty and fostering innovation through interconnected markets. However, the rise of protectionist policies threatens to reverse these gains. The OECD highlights that policies aiming to secure domestic industries often result in inefficiencies, reduced competition, and higher prices for consumers.
Catherine Mann, Chief Economist of the OECD, emphasized the importance of cooperation over isolation: “Global challenges require collective solutions. Protectionism not only isolates economies but also makes them more vulnerable to external shocks.”
### **Implications for Businesses**
For businesses operating across borders, protectionism could lead to higher costs, increased regulatory hurdles, and supply chain bottlenecks. The OECD’s warning serves as a call to action for policymakers to prioritize open trade and investment policies to sustain economic growth.
The report also underlines the role of innovation in overcoming protectionist tendencies. Investing in renewable energy, digital transformation, and resilient supply chains can help mitigate some of the risks associated with economic nationalism.
### **Charting a Path Forward**
The OECD recommends fostering international cooperation to address common challenges such as climate change, digital transformation, and global health crises. While protectionism might offer short-term political gains, the long-term consequences for economic growth and global stability could be severe.
https://www.reuters.com/markets/oecd-warns-protectionism-risk-global-growth-outlook-2024-12-04
**Categories:** Global News
---
### [The Importance of Financial Literacy: Why It’s Crucial for Your Financial Health](https://df.media/the-importance-of-financial-literacy-why-its-crucial-for-your-financial-health/)
**Published:** December 3, 2024
**Author:** Daily Finance
**Content:**
Photo by [micheile henderson](https://unsplash.com/@micheile?utm_content=creditCopyText&utm_medium=referral&utm_source=unsplash) on [Unsplash](https://unsplash.com/photos/green-plant-in-clear-glass-vase-ZVprbBmT8QA?utm_content=creditCopyText&utm_medium=referral&utm_source=unsplash)
**Introduction:** Financial literacy is more than just a buzzword—it’s a critical life skill that empowers individuals to make informed decisions about their money. Whether you’re managing your personal budget, investing in the stock market, or planning for retirement, understanding basic financial concepts is essential to achieving long-term financial health. In this post, we discuss why financial literacy matters and how you can improve your financial knowledge.
**What is Financial Literacy?** At its core, financial literacy is the ability to understand and effectively manage personal finances. This includes knowing how to budget, save, invest, plan for retirement, and make sound financial decisions. It’s about being empowered to take control of your money rather than letting it control you.
**Why Financial Literacy is Crucial**
1. **Better Decision-Making:** Financially literate individuals are more likely to make smart financial decisions, such as budgeting properly, avoiding excessive debt, and saving for future goals. With a strong foundation of knowledge, people can make informed choices about everything from mortgages to investment opportunities.
2. **Avoiding Debt Traps:** Credit cards, payday loans, and high-interest debts can trap individuals in cycles of borrowing. Financial literacy equips people with the tools to avoid falling into debt traps by understanding interest rates, fees, and the long-term impact of borrowing.
3. **Planning for the Future:** Financial literacy is key to securing a stable future. Understanding the importance of saving, investing, and planning for retirement can help individuals achieve their long-term goals. In addition, individuals who are financially literate are better positioned to manage unexpected expenses, such as medical bills or job loss.
4. **Achieving Financial Independence:** By building strong financial habits, individuals can achieve financial independence. This could mean paying off debt, saving a significant portion of their income, or investing wisely to build wealth over time.
**How to Improve Your Financial Literacy** Improving your financial literacy doesn’t require an advanced degree in finance—it simply takes a commitment to learning. Here are some steps you can take to boost your financial knowledge:
1. **Educate Yourself Online:** There are countless free resources online, from blogs (like this one!) to podcasts and video tutorials. Websites like Investopedia and the Financial Literacy and Education Commission offer free educational materials on personal finance.
2. **Read Books and Articles:** Books on personal finance can provide in-depth insights into topics like budgeting, investing, and wealth-building. Popular titles include *Rich Dad Poor Dad* by Robert Kiyosaki, *The Millionaire Next Door* by Thomas Stanley, and *The Intelligent Investor* by Benjamin Graham.
3. **Use Financial Tools and Apps:** Many apps and tools can help you track your spending, manage your savings, and invest wisely. Apps like Mint, YNAB (You Need a Budget), and Personal Capital allow you to manage your finances with ease.
4. **Attend Financial Workshops or Webinars:** Many local organizations, community centers, and online platforms offer free or low-cost financial literacy workshops. These can help you deepen your knowledge on topics such as investing, retirement planning, and tax management.
**Overcoming Financial Illiteracy** Despite its importance, financial illiteracy remains widespread. According to studies, a significant percentage of people lack the basic knowledge to manage their finances effectively. This knowledge gap can lead to poor financial decisions, excessive debt, and inadequate retirement savings. By taking the time to educate yourself, you can avoid the common pitfalls of financial illiteracy and take charge of your financial future.
**Conclusion:** Financial literacy is an essential skill for anyone who wants to secure their financial well-being. By becoming financially literate, you gain the confidence to make better financial decisions, avoid common mistakes, and work toward achieving your financial goals. Whether you’re just starting your financial journey or are looking to improve your existing knowledge, investing in financial literacy is one of the best decisions you can make.
**Categories:** Finance, Investing
---
### [The Future of Digital Finance: How Cryptocurrencies are Shaping the Global Economy](https://df.media/the-future-of-digital-finance-how-cryptocurrencies-are-shaping-the-global-economy/)
**Published:** December 3, 2024
**Author:** Daily Finance
**Content:**
Photo by [rc.xyz NFT gallery](https://unsplash.com/@moneyphotos?utm_content=creditCopyText&utm_medium=referral&utm_source=unsplash) on [Unsplash](https://unsplash.com/photos/a-bit-coin-sitting-on-top-of-a-blue-vase--s3uSyvLxBc?utm_content=creditCopyText&utm_medium=referral&utm_source=unsplash)
**Introduction:** Over the past decade, cryptocurrencies have moved from the fringes of the financial world to the mainstream. What started as a niche digital asset has quickly evolved into a multi-trillion-dollar market, with global implications for investors, businesses, and governments. In this post, we explore the growing influence of cryptocurrencies and what the future of digital finance holds.
**The Rise of Cryptocurrencies** Cryptocurrencies, led by Bitcoin, have challenged traditional financial systems by offering decentralized, borderless alternatives to fiat currencies. Initially, these digital currencies were viewed with skepticism. However, with the rapid rise of decentralized finance (DeFi), non-fungible tokens (NFTs), and the growing institutional adoption of digital assets, cryptocurrencies have become a central part of modern finance.
**Why Cryptos are Gaining Popularity:**
1. **Decentralization and Control:** Unlike traditional banking systems, cryptocurrencies give individuals greater control over their financial transactions, reducing reliance on central authorities.
2. **Lower Transaction Costs:** With fewer intermediaries, crypto transactions can be faster and less expensive, particularly for cross-border payments.
3. **Inflation Hedge:** Amid economic uncertainty, many investors have turned to Bitcoin and other cryptos as a store of value, similar to gold.
**Blockchain Technology: The Backbone of Digital Finance** The backbone of cryptocurrencies is blockchain technology, a decentralized ledger that ensures transparency, security, and immutability of transactions. Blockchain’s applications go far beyond cryptocurrencies—being explored in sectors like supply chain management, healthcare, and real estate. Its decentralized nature can disrupt traditional business models, providing a more efficient and transparent way to manage data and financial records.
**The Challenges Ahead** Despite its growth, the cryptocurrency market still faces several challenges:
- **Regulation:** Governments around the world are grappling with how to regulate crypto markets to ensure consumer protection without stifling innovation.
- **Volatility:** Cryptocurrencies are known for their price volatility, which can be a barrier for some investors and users.
- **Security Risks:** Hacks and scams have made the crypto space a target for malicious actors, despite the security promises of blockchain.
**What Does the Future Hold?** As governments develop more comprehensive regulatory frameworks and institutional adoption grows, cryptocurrencies may become an even more integral part of global finance. Additionally, the rise of Central Bank Digital Currencies (CBDCs) could represent a hybrid model, merging the advantages of digital currencies with government oversight.
**Conclusion:** Cryptocurrencies are undoubtedly shaping the future of finance, with their impact likely to grow even more significant in the coming years. As the market matures and regulations evolve, digital currencies could change the way we think about money, transactions, and financial inclusion.
**Categories:** Bitcoin (BTC), Concordium (CCD), Cryptocurrency, Ethereum (ETH)
---
### [Blackstone to Acquire Jersey Mike's Subs in Landmark Deal](https://df.media/blackstone-to-acquire-jersey-mikes-subs-in-landmark-deal/)
**Published:** November 29, 2024
**Author:** Daily Finance
**Content:**
In a major move within the fast-food industry, private equity giant Blackstone has struck a deal to acquire a majority stake in Jersey Mike’s Subs, the iconic sandwich chain, in a transaction valued at approximately $8 billion, including debt. This acquisition marks another significant investment by Blackstone into the franchise sector, following recent deals involving Tropical Smoothie Cafe and 7Brew.
### **Jersey Mike’s: A Rising Star in Quick-Service Dining**
Founded in 1956 in New Jersey, Jersey Mike’s Subs has grown into one of the leading players in the sub-style sandwich market. With over 3,000 locations nationwide, the brand is known for its fresh ingredients, signature flavors, and commitment to quality. Under the leadership of CEO Peter Cancro, who took ownership of the company in 1975 at just 17 years old, the chain has seen remarkable expansion, carving out a loyal customer base in the competitive quick-service restaurant space.
### **Blackstone’s Strategic Focus**
Blackstone’s acquisition of Jersey Mike’s reflects a growing interest in franchise-based businesses, which offer stable cash flows and consistent growth opportunities. This deal follows a broader trend of private equity investments in the restaurant industry, exemplified by Roark Capital’s $9.6 billion purchase of Subway last year.
Blackstone has previously expressed its focus on businesses with strong consumer loyalty and scalable operational models, making Jersey Mike’s a natural fit for its portfolio. The deal underscores Blackstone’s commitment to diversifying its holdings in consumer-facing industries while capitalizing on the fast-casual dining boom.
### **Leadership and Future Plans**
CEO Peter Cancro will retain a significant equity stake in the company and continue to oversee its operations. His leadership has been pivotal in driving the brand’s growth and ensuring its reputation for quality and innovation.
The acquisition is expected to provide Jersey Mike’s with additional resources and support to fuel its expansion, enhance customer experience, and strengthen its position as a leader in the sandwich market.
### **A Booming Franchise Sector**
The deal highlights the ongoing consolidation within the restaurant industry, as private equity firms increasingly target fast-food and fast-casual chains. Franchise models, known for their recurring revenue streams and low capital investment requirements, are particularly attractive to investors seeking long-term returns.
Jersey Mike’s robust performance, coupled with its ability to adapt to shifting consumer preferences, positions it well for continued success under Blackstone’s ownership.
### **Closing Thoughts**
The acquisition of Jersey Mike’s Subs by Blackstone is a testament to the brand’s legacy and growth potential. As consumer demand for quality, convenience, and innovation continues to shape the dining landscape, this partnership promises to further elevate Jersey Mike’s standing in the fast-food industry.
Stay tuned for updates on this landmark transaction as the two companies move forward to finalize the deal.
<https://www.reuters.com/markets/deals/blackstone-strikes-deal-buy-jersey-mikes-subs-2024-11-19>
**Categories:** Global News
---
### [Sony in Talks to Acquire Kadokawa: A Strategic Expansion in Entertainment](https://df.media/sony-in-talks-to-acquire-kadokawa-a-strategic-expansion-in-entertainment/)
**Published:** November 27, 2024
**Author:** Daily Finance
**Content:**
Sony, the global technology and entertainment leader, is reportedly engaged in discussions to acquire Kadokawa, a prominent Japanese media company known for its diverse entertainment portfolio, including the critically acclaimed video game “Elden Ring.” According to sources familiar with the matter, the talks are progressing, and a potential agreement could be finalized in the coming weeks.
Kadokawa’s stock saw a significant surge, closing up by 23% after reports of the potential acquisition surfaced, elevating its pre-news market valuation of approximately $2.7 billion. Meanwhile, Sony’s stock experienced a modest uptick, closing 0.6% higher. Both companies have declined to comment on the matter.
### **A Strengthening Partnership**
Sony already owns a 2% stake in Kadokawa and has an interest in FromSoftware, the game development studio behind “Elden Ring.” This fantasy action RPG, a collaboration between game director Hidetaka Miyazaki and renowned author George R.R. Martin, has been a phenomenal success, selling 25 million copies globally. The game’s recent expansion, “Shadow of the Erdtree,” achieved remarkable sales of 5 million units within three days of its release in June.
### **Kadokawa: A Legacy of Creative Excellence**
Established in 1945 as a publisher, Kadokawa has grown into a multifaceted entertainment powerhouse. Its offerings span video games, anime, events, and merchandise, with popular franchises such as *Re*
and *Delicious in Dungeon*. These titles showcase Kadokawa’s expertise in creating engaging stories and beloved characters, further cementing its influence in Japanese pop culture.
### **Sony’s Strategic Vision**
Sony’s potential acquisition aligns with its broader strategy to deepen its entertainment portfolio. Transitioning from its origins as an electronics manufacturer, Sony has evolved into a major player in movies, music, games, and technology. CEO Kenichiro Yoshida has emphasized the long-term value of investing in intellectual properties, citing their potential to remain culturally relevant for decades.
Anime, a key growth area for Sony, has seen rising global demand driven by streaming platforms and growing appreciation for Japanese culture. Sony’s ability to extend its existing franchises, such as adapting “The Last of Us” into a highly successful HBO series, highlights its capacity to maximize IP value across mediums.
### **Challenges and Opportunities**
Despite Kadokawa’s successes, the company has faced challenges in recent years. A cyberattack in June disrupted operations and led to a data breach. In 2022, former chairman Tsuguhiko Kadokawa resigned following a bribery indictment linked to the Tokyo Olympics.
For Sony, acquiring Kadokawa could reinforce its position in the entertainment industry, particularly in anime and gaming. With a market capitalization of $114 billion, Sony has ample resources to invest in growth opportunities that align with its vision of sustainable expansion.
This potential deal underscores Sony’s commitment to innovation and its ambition to lead in the global entertainment landscape.
<https://www.reuters.com/markets/deals/sony-talks-buy-media-powerhouse-behind-elden-ring-sources-say-2024-11-19>
**Categories:** Global News
---
### [China Calls for COP29 Talks on Trade Measures Affecting Developing Countries](https://df.media/china-calls-for-cop29-talks-on-trade-measures-affecting-developing-countries/)
**Published:** November 27, 2024
**Author:** Daily Finance
**Content:**
Photo by [Marcin Jozwiak](https://unsplash.com/@marcinjozwiak?utm_content=creditCopyText&utm_medium=referral&utm_source=unsplash) on [Unsplash](https://unsplash.com/photos/white-smoke-coming-out-from-building-uKvPDQop-JA?utm_content=creditCopyText&utm_medium=referral&utm_source=unsplash)
**BRUSSELS, Nov 5** – China has proposed adding discussions on trade policies, like carbon border taxes, to the COP29 climate summit agenda, arguing these measures disproportionately impact developing nations. The request, highlighted in a document reviewed by Reuters, could introduce trade tensions into the summit, which starts November 11 in Baku, Azerbaijan.
Representing the BASIC group – which includes Brazil, India, and South Africa – China submitted a proposal to the U.N. climate body (UNFCCC) to discuss “unilateral restrictive trade measures” linked to climate policy. BASIC countries have been vocal critics of the European Union’s trade-related climate initiatives, including its anti-deforestation law and carbon border levy on high-carbon imports. Both China and India argue that these policies act as protectionist barriers, unfairly targeting developing countries.
The EU, however, defends its stance, arguing that these measures are needed to protect European industries that pay fees for their CO2 emissions from being undercut by cheaper imports from regions with less stringent climate policies.
A UNFCCC spokesperson confirmed receipt of the BASIC submission, which will be reviewed at the start of COP29, where countries will decide on the final agenda by consensus. Any disagreement over the agenda could delay proceedings, cutting into valuable negotiation time intended for addressing key issues like new funding for climate action.
Agenda choices at U.N. climate summits can have a major impact. For instance, the inclusion of a highly debated agenda item on climate damage financing at the 2022 summit led to the creation of a global fund to support those affected by climate-related losses. The EU is expected to oppose the BASIC proposal, arguing that trade matters are best handled by the World Trade Organization.
The BASIC countries’ document also stressed the importance of opposing “trade and investment restrictions and new green trade barriers,” such as unilateral carbon border adjustments and due diligence requirements.
This proposal could spark critical discussions about the balance between climate policy and economic equity at this year’s COP29.
(source: <https://www.reuters.com/world/china/china-wants-talks-trade-measures-cop29-climate-summit-document-shows-2024-11-05/>)
**Categories:** Global News
---
### [7 Kinds of Writing Assignment for Students – A Brief Guide!](https://df.media/7-kinds-of-writing-assignment-for-students-a-brief-guide/)
**Published:** November 14, 2024
**Author:** Daily Finance
**Content:**
Assignments are the most popular tools for evaluating students’ knowledge and understanding of a specific topic. Therefore, students are asked to write various types of assignments during their educational journey. Each assignment type is different. Students can polish their critical thinking skills by writing these assignments and understanding their purposes.
Are you curious to know about these writing assignment types? Then this article is for you. Here, we’ll share seven types of writing assignments for high school and identify which writing style is the best for assignments.
Continue reading to explore the key insights of this article first.
**Key Insights:**
- *During their educational career, students get various kinds of writing assignments.*
- *Each type of assignment has its own structure and writing requirements. The general structure includes an introduction, main body, and conclusion.*
- *The seven common writing assignments are case study responses, essays, analyses, reflective writing, reports, annotated bibliographies, and literature reviews.*
- *To get academic achievements, students need to learn how to write each assignment type by following the requirements given by the teachers.*
**7 Kinds of Writing Assignments for Students**
Assignments and assessments are similar; professors often give assignments to students to assess their mental abilities. These assignments not only stimulate assessment but also help in achieving academic goals. According to Research Gate, ***72% of experts believe that assignments significantly improve academic achievements***. However, there are various kinds of writing assignments that vary by length and purpose.
Read on to learn different types of writing assignments.
1. **Case Studies Responses**
Case studies response is one of the most common kinds of writing assignment, but most students fail to score high grades in the assignment genre.
Below are some key reasons for losing marks in this document.
- Students don’t relate their answers to the case study details.
- Their assignment structure is unclear.
- Lack of using critical thinking.
- They do not use an accurate reference format.
Students can get assistance from their teachers, tutors or [**professional assignment writing services**](https://www.theacademicpapers.co.uk/assignment-writing-services/). They can also follow some tips to earn good grades in case study responses. These tips are the following:
- Structure their answer according to the case study and always refer to the given case study.
- Write their case study response like the essay body, but add examples from the given case study to support their arguments.
1. **Analysis**
Students usually get an assignment to write an analysis on any subject or topic. Below are some common analysis types.
- **Causal Analysis:** In this type of analysis, the writer explores the reasons why something happened or happened in the past.
- **Comparison Analysis:** In comparison analysis, students compare two individuals’ works and explain the significance of the similarities between their works.
- **Literary Analysis:** It is also known as critique, in which a writer reads someone else’s literary work and gives their interpretation.
- **Rhetorical Analysis:** In rhetorical analysis, students review the strategies that writers have used to achieve certain results in their work.
- **Critical Analysis:** In this analysis type, students give reasoning and arguments about the authors’ work.
- **Process Analysis:** Students have to state the steps involved in producing something while writing this analysis.
1. **Reflective Writing**
Reflective writing is a popular assessment tool used generally at the university level. It involves exploring experiences, feelings, opinions, or events to gain a clear understanding of the assigned topic. Furthermore, this writing is not like writing a summary; it requires analysing a certain situation, event, or problem and its impact on one’s thinking.
In simple words, a reflective process involves looking back to past experiences, thinking critically about them, and drawing conclusions for future experiences. Additionally, developing reflective skills enables students to use the feedback for growth and betterment in their professional lives.
There are various reflective writing models which your teacher has predefined in the guidelines. But if the model is not specified, you can use one of them, which we are going to mention below.
- **The Gibbs’ Reflective Cycle**
This reflective cycle requires you to consider your feelings during the reflective writing process. This model is typically popular in health-related assignment writing.
- **The 4 Rs of Reflective Thinking**
The 4 R’s model is specifically designed to encourage students to get involved in experiential learning. These experiential learning and reflective practices are used in Creative Arts, Philosophy, and Sociology.
1. **Essay**
An essay is one of the most popular kinds of writing assignments. It presents the author’s perspective on the topic with the help of evidence. Moreover, an essay assignment has the following key characteristics.
- It allows students to synthesise the ideas that they have learned in the class.
- An essay typically consists of arguments, claims, and [**thesis statements**](https://www.affordable-dissertation.co.uk/blog/2024/09/04/how-to-write-a-thesis-statement/).
- It relies on the evidence that is usually gathered from books, articles, or other authentic resources.
- It requires a good structure, which includes an introduction, a main body, and a conclusion. Generally, an introduction and conclusion cover 10% of the word count, and the remaining word count has to be divided into body paragraphs.
1. **Report**
A report consists of organised information about a problem which is under rigorous investigation. An individual can gather this information from readings, conducting experiments, or experience.
This assessment type is not only used in education but it is a common writing document which is used in business, healthcare, technical, and scientific occupations. In addition, a report can be written in different structures depending on the purpose and discipline.
Below are some of the most common report types that are categorised based on their purposes.
- **Business Report:** Convey information about business decisions.
- **Summary Report:** Give the key information about some event.
- **Technical Report:** Discuss technical problems and solutions.
- **Scientific Report:** Encompass the results of some experiment or laboratory work.
1. **Annotated Bibliography**
An annotated bibliography is an alphabetical list of reliable sources on a subject matter. It also includes a summary, explanation, and evaluation of the topic. The main purpose of the assignment type is to teach students to conduct research, evaluate sources, and present them in an organised way.
To write a good bibliography, you must check the guidelines to learn how many sources are required to annotate and what the word limit is for each reference.
When you write your annotated bibliography, take into account the following factors.
- Determine your topic and any specific question that you need to answer.
- Identify the sources on which you need to focus.
- Check the credibility of the sources.
1. **Literature Review**
Many students easily get confused between literature review and systematic literature review. Although both terms are more or less similar there is a key difference between them.
- **Literature Review:** This review analyses the literature related to your topic clearly and logically. This review should be organised conceptually, methodologically, and chronologically.
- **Systematic Literature Review** is a complex research process that requires clear research protocols to avoid reviewer bias.
Therefore, when your teacher assigns this kind of writing assignment, identify which type of literature he expects to write. Additionally, a literature review doesn’t need to summarise each source related to your topic, but it aims to identify any gap in research.
You have to analyse and synthesise the common ideas from past research and present them in a key theme which is related to your topic. As you have learned the different kinds of writing assignments, now explore which writing style is best for assignments to secure high grades.
**Which Writing Style is Best for Assignment?**
When students are asked to write an assignment, the first thought that comes to their mind is writing an essay assignment. They instantly think about the writing style that they can use; it is likely a discursive style. However, there are various kinds of assignments, including essays, reports, annotated bibliographies, analyses, and literature reviews. For all these types, you cannot use a discursive style.
There are three main writing styles that you can use in writing these assignments, depending on the requirements and purpose of each assignment.
These styles are the following:
- Analytical
- Descriptive
- Reflective
**Conclusion**
To conclude, students encounter a variety of assignment types throughout their educational journey, and understanding each type is crucial for academic success. This article has highlighted the seven most common writing assignments students often receive, along with practical tips and strategies to help tackle each one effectively.
If you need support while working on your academic papers, [**custom assignment writing platforms in the UK**](https://www.linkedin.com/pulse/5-best-assignment-writing-services-uk-2024-manzoor-fatima-pjtrf/) can provide valuable assistance. We hope these guidelines offer you a clearer understanding of different assignment types and help you approach each one with confidence.
**Categories:** Business, Consulting
---
### [How to Build an Emergency Fund: A Step-by-Step Guide](https://df.media/how-to-build-an-emergency-fund-a-step-by-step-guide/)
**Published:** November 6, 2024
**Author:** Daily Finance
**Content:**
In today’s unpredictable world, having an emergency fund isn’t just a good idea—it’s essential. Whether it’s a sudden medical expense, a job loss, or an unexpected car repair, life has a way of throwing curveballs when we least expect it. That’s why having a financial safety net in place is crucial for maintaining peace of mind and financial security.
Building an emergency fund can seem overwhelming at first, but with a solid strategy and commitment, anyone can do it. In this step-by-step guide, we’ll walk you through how to create and grow your emergency fund, so you’re prepared for whatever life brings your way.
### **Step 1: Set a Realistic Goal**
The first step in building an emergency fund is determining how much money you’ll need. Financial experts generally recommend saving enough to cover three to six months’ worth of living expenses. This amount will depend on your lifestyle, living situation, and personal comfort level.
Start by calculating your monthly expenses. Consider everything you regularly spend money on: rent/mortgage, utilities, groceries, transportation, insurance, childcare, etc. Once you have a clear picture of your monthly spending, multiply that by 3 to 6 to get your emergency fund goal.
For example:
- Monthly expenses: $3,000
- Emergency fund goal (3 months): $9,000
- Emergency fund goal (6 months): $18,000
It’s important to set a goal that feels achievable to you. If saving 6 months of expenses feels daunting, start with 3 months and work your way up over time.
### **Step 2: Open a Separate Savings Account**
When you’re building an emergency fund, it’s crucial to keep your savings separate from your everyday spending money. Opening a dedicated savings account—preferably one with no fees or low fees—helps ensure that you don’t dip into your emergency fund for non-emergencies.
Many online banks offer high-yield savings accounts that allow you to earn interest on your savings. While the rates are typically low, this can help your fund grow more quickly over time. Look for accounts with easy access but avoid accounts that tempt you with excessive withdrawal options. You want to keep your emergency fund untouched unless you really need it.
### **Step 3: Set a Monthly Contribution Amount**
Once you know your target amount and have a separate account in place, the next step is to set a monthly contribution goal. Depending on how quickly you want to reach your emergency fund target, you may need to adjust your monthly savings amount.
Start by assessing how much disposable income you have after covering all your essential expenses. Be realistic about your ability to save. For example, if you can comfortably set aside $200 per month, that’s a great start. If $100 a month is more feasible for your budget, that’s okay too. The key is to be consistent.
If your budget is tight, consider starting smaller. You can always increase your contributions as your financial situation improves, such as after paying off a debt or getting a raise.
### **Step 4: Cut Unnecessary Expenses**
To boost your emergency fund contributions, consider trimming unnecessary expenses. This doesn’t mean you have to cut out all fun or stop spending on things you enjoy, but small adjustments can make a big difference over time.
Look for areas where you can reduce spending, such as:
- Subscribing to fewer streaming services
- Cooking meals at home instead of dining out
- Canceling unused memberships or subscriptions (like gym memberships, magazine subscriptions, etc.)
- Limiting impulse purchases, especially online shopping
Every dollar you save from reducing non-essential expenses can go straight into your emergency fund. While the cuts might seem small at first, they’ll add up over time and help you reach your goal faster.
### **Step 5: Automate Your Savings**
One of the easiest ways to build your emergency fund is to set up automatic transfers from your checking account to your savings account. This helps ensure you save regularly without thinking about it, and it prevents the temptation to spend the money elsewhere.
Set up an automated transfer to happen immediately after you receive your paycheck. Treat it as a non-negotiable expense, just like paying rent or utilities. Automating your savings also helps you stick to your goal, even if your budget changes or you have unexpected expenses in a given month.
### **Step 6: Start Small, But Stay Consistent**
Building an emergency fund doesn’t have to happen overnight. The key is consistency. Even if you can only save $50 or $100 a month, as long as you are making progress toward your goal, you’re moving in the right direction.
Start small if you need to—just get started. Over time, as you gain better control over your finances or increase your income, you’ll be able to increase your savings contributions. The more consistent you are, the closer you’ll get to your emergency fund target.
### **Step 7: Resist the Temptation to Dip Into the Fund**
Your emergency fund is meant for true emergencies only, not for planned expenses or everyday purchases. When you do encounter a true financial emergency, it can be tempting to tap into your fund for other purposes—such as taking a vacation, buying a new phone, or covering non-urgent medical bills.
Before you withdraw any money, ask yourself: “Is this an emergency?” If the answer is no, it’s important to leave the fund untouched. Building a solid emergency fund is about preparing for the unexpected. Once you tap into it for non-emergencies, it can be difficult to rebuild, and you may find yourself in the same financial bind when an actual emergency arises.
### **Step 8: Replenish the Fund After Use**
If you do need to dip into your emergency fund, make a plan to replenish it as soon as possible. The purpose of the emergency fund is to ensure that you’re never caught off guard by unexpected costs, so once it’s been used, prioritize refilling it.
Increase your monthly contributions temporarily, or use any windfalls—like tax refunds or bonuses—to help replenish your fund faster.
---
### **Conclusion: The Road to Financial Security**
Building an emergency fund is one of the most important steps you can take toward achieving financial security. It provides you with the safety net you need to weather life’s inevitable surprises without falling into debt or financial stress. By setting a clear goal, automating your savings, and resisting the temptation to dip into your fund for non-emergencies, you’ll be well on your way to a more stable financial future.
Remember, every small step counts. Start today, and with time and consistency, you’ll be able to create an emergency fund that protects you from life’s unexpected financial challenges.
**Categories:** Finance, Investing
---
### [HubSpot Expands Capabilities with Acquisition of Cacheflow, Strengthening B2B Billing and CPQ Solutions](https://df.media/hubspot-expands-capabilities-with-acquisition-of-cacheflow-strengthening-b2b-billing-and-cpq-solutions/)
**Published:** November 4, 2024
**Author:** Ethan Brooks
**Content:**
*CAMBRIDGE, Mass.–(BUSINESS WIRE)–* HubSpot, Inc. (NYSE: HUBS), the widely adopted customer platform for scaling businesses, announced the successful acquisition of Cacheflow, a leading provider of B2B billing management and configure, price, quote (CPQ) solutions. This move brings Cacheflow under HubSpot’s ownership, allowing for its integration into HubSpot’s Commerce Hub and enhancing the platform’s billing and CPQ capabilities.
With this acquisition, HubSpot stands to deepen its expertise in critical billing and CPQ processes, empowering its Commerce Hub to streamline revenue management and accelerate the sales cycle for customers. By embedding Cacheflow’s specialized capabilities, HubSpot aims to simplify billing processes, giving businesses the tools to manage complex pricing structures and automate their sales workflows.
HubSpot’s CEO expressed enthusiasm for the integration, noting that Cacheflow’s advanced billing technology will enable them to better serve growing businesses with tools that optimize revenue management and reduce time to close. This integration marks another step in HubSpot’s ongoing expansion of tools that drive seamless customer management and facilitate growth for its users.
To learn more about the initial announcement regarding HubSpot’s agreement to acquire Cacheflow, readers can view the initial press release here.
**Forward-looking Statements**
HubSpot’s press release also includes forward-looking statements as defined under the Private Securities Litigation Reform Act of 1995. These statements, which may use terms like “expects,” “anticipates,” “intends,” and “plans,” reflect HubSpot’s current views on the expected benefits of the Cacheflow acquisition. Actual outcomes could vary significantly due to factors outside the company’s control, including various risks detailed in HubSpot’s annual SEC filings.
**About HubSpot**
HubSpot (NYSE: HUBS) is a comprehensive customer platform designed to support business growth. Powered by AI, the platform includes engagement hubs, a Smart CRM, and over 1,700 integrations available through its App Marketplace, fostering an ecosystem that supports customer-facing teams and business scalability. For more information, visit[ www.hubspot.com](http://www.hubspot.com).
**Categories:** Global News
---
### [U.S. Economy Defies Forecasts with Strong Q3 Growth Ahead of Election, Driven by Consumer Spending and Investment](https://df.media/u-s-economy-defies-forecasts-with-strong-q3-growth-ahead-of-election-driven-by-consumer-spending-and-investment/)
**Published:** November 4, 2024
**Author:** Daniel Reynolds
**Content:**
The U.S. economy demonstrated robust performance in the third quarter, growing at an annualized rate of 2.8%, according to the Commerce Department’s advance estimate. This solid growth comes less than a week before the upcoming election, where economic health is expected to be a key issue for voters. Driven by the fastest rise in consumer spending since early 2023 and significant business investment in equipment, the economy continues to defy forecasts of a downturn, showing resilience despite aggressive interest rate hikes from the Federal Reserve.
Consumer spending, which makes up more than two-thirds of U.S. economic activity, increased at a 3.7% pace, marking the most rapid growth since the first quarter of 2021. This uptick is fueled by a stable labor market, steady wage growth, and easing inflation, all of which have bolstered household finances. The cooling inflation rate was reflected in the personal consumption expenditures price index, excluding food and energy, which rose at a 2.2% rate—nearing the Federal Reserve’s 2% target and down from 2.8% in the previous quarter. This moderation in inflation has prompted the Fed to ease its policy, initiating a substantial half-percentage-point rate cut last month, reducing its policy rate to the 4.75%-5.00% range.
Additionally, business investment in equipment surged at an 11.1% rate, marking the fastest growth in this category since the second quarter of 2023, while government spending provided further support. However, inventory accumulation decelerated, and the trade deficit widened, resulting in both factors detracting from overall GDP growth. Residential investment, encompassing homebuilding and real estate sales, contracted for the second consecutive quarter.
Despite these factors, the economy’s growth rate remains well above the Fed’s estimate of a non-inflationary growth rate of about 1.8%, underscoring strong underlying momentum. Recent revisions also suggest the U.S. economy may have been underestimated in earlier reports, with the gap between GDP and gross domestic income (GDI) narrowing significantly.
The Bureau of Economic Analysis (BEA) noted that while it could not quantify the full impact of Hurricane Helene on third-quarter GDP, losses were estimated at $39.0 billion in privately-owned assets and $2.0 billion in state and local government assets. Nonetheless, this natural disaster had no direct effect on GDP or personal income calculations.
As Vice President Kamala Harris and former President Donald Trump enter the final stretch of their campaigns, both will likely address the mixed economic signals, particularly as voters express concerns over high living costs despite recent economic gains.
<https://www.reuters.com/markets/us/us-economy-posts-solid-growth-election-eve-2024-10-30>
**Categories:** Global News
---
### [2024 Consumer Spending Insights: Key Trends from the Klaviyo Report](https://df.media/2024-consumer-spending-insights-key-trends-from-the-klaviyo-report/)
**Published:** October 17, 2024
**Author:** Daniel Reynolds
**Content:**
As we approach the bustling holiday season, understanding consumer behavior and spending trends is more crucial than ever for brands and businesses. The *Klaviyo 2024 Consumer Spending Report* offers valuable insights into how global shoppers are feeling and behaving in response to economic challenges, as well as their plans for holiday spending. Based on feedback from over 8,500 consumers worldwide, this report provides actionable strategies for brands to thrive during peak shopping periods like Black Friday, Cyber Monday (BFCM), and beyond. Here are the key takeaways from the report and what businesses can learn from them.
### **1. Cautious Economic Outlook Doesn’t Mean Less Spending**
Despite a cautious outlook due to inflation and economic uncertainty, consumers are still planning to spend this holiday season. According to the *Klaviyo report*, while inflation is top-of-mind for 97% of shoppers, 88% of consumers indicated that inflation is either currently affecting or will affect their spending habits. Interestingly, this financial vigilance doesn’t translate to less holiday shopping—61% of respondents plan to spend the same amount as last year, while 19% plan to increase their spending.
This insight suggests that while shoppers are being more mindful of their spending throughout the year, the holiday season remains a priority for many. To capture these cautious but committed buyers, brands should focus on offering value-driven deals and discounts that meet their price sensitivity, particularly on essentials.
### **2. Early Birds Get the Sale**
Timing is everything when it comes to holiday promotions. While traditionally, most holiday shopping occurs between October and December, the *Klaviyo report* shows that over half of consumers (51%) are open to starting their shopping earlier if the right promotions are offered. Additionally, 64% of shoppers who spread their spending throughout the year do so to take advantage of deals.
For brands, this presents an opportunity to start holiday campaigns before the typical November rush. By offering early access to deals and creating pre-holiday excitement through promotions, businesses can encourage shoppers to buy earlier, helping smooth out sales volumes across the season.
### **3. The Role of Inflation and Price Sensitivity**
One of the most striking findings from the *Klaviyo report* is how inflation continues to impact consumer behavior. The vast majority of respondents (88%) indicated that inflation would affect their current or future spending. Additionally, 69% of consumers are focused on finding sales, and 67% are hunting for discounts when purchasing holiday gifts. Price is the number one factor in deciding where to shop, followed closely by product quality.
Brands should respond to this trend by aligning their promotional strategies to emphasize value without compromising on quality. Targeted promotions, tiered discounts, and creative bundles can help businesses appeal to the price-conscious shopper while maintaining profit margins.
### **4. Omnichannel Shopping is Here to Stay**
The way people shop has shifted dramatically in recent years, and the *Klaviyo 2024 Consumer Spending Report* reinforces the importance of an omnichannel approach. Shoppers are splitting their purchases between online and in-store options, with nearly half of the respondents indicating that both are equally influential when deciding what to buy. Window shopping—both in-person and online—was cited as the top source of inspiration for gift ideas across all demographics.
To meet consumers where they are, brands must ensure a seamless shopping experience across multiple platforms. This means optimizing mobile and desktop experiences, improving in-store browsing opportunities, and ensuring that email, SMS, and social media campaigns work together to drive traffic to both online stores and physical locations.
### **5. Younger Generations and Holiday Spending**
Generational differences play a significant role in holiday shopping behaviors. According to the *Klaviyo report*, Gen Z and Millennials are more likely to increase their holiday spending compared to older generations like Gen X and Boomers. Social media is a key influence for younger shoppers, with Gen Z citing it as the most important source of holiday gift inspiration (61%). On the other hand, Boomers and Gen Xers are more influenced by traditional channels such as in-store browsing and television.
For brands targeting younger shoppers, this highlights the importance of building a strong presence on social media platforms like Instagram, TikTok, and YouTube. Engaging, authentic content—especially influencer-driven campaigns—can help capture the attention of Gen Z and Millennials. Meanwhile, for older consumers, businesses should focus on enhancing the in-store experience and using traditional media channels to drive sales.
### **6. Demographic and Income Insights**
Consumers’ spending habits differ not only by age but also by income and relationship status. According to *Klaviyo*, higher-income consumers, particularly those earning over $200,000, are more likely to increase their spending this holiday season, particularly on luxury goods like jewelry and watches. In contrast, lower-income consumers are focusing more on essentials and spreading their spending throughout the year to manage costs.
Additionally, partnered and married consumers plan to spend more than their single counterparts, and parents tend to spend more on gifts than non-parents. These findings suggest that brands should tailor their messaging and promotions to specific demographic groups, offering high-value deals for budget-conscious shoppers and luxury products for higher-income consumers.
### **7. Strategic Sale Approaches**
The *Klaviyo 2024 Consumer Spending Report* highlights the importance of adapting sales strategies to different consumer behaviors. For example, “buy now, pay later” (BNPL) options are becoming increasingly popular, with 59% of respondents saying they have either used or are interested in using BNPL. Offering flexible payment plans can help brands cater to budget-conscious consumers who might otherwise be hesitant to spend on discretionary goods.
Moreover, the report suggests that businesses should avoid blanket discounts and instead focus on targeted promotions that offer value without eroding profits. Offering deeper discounts on less popular items or older stock while maintaining pricing integrity on bestsellers is a strategy that can help brands protect margins while still appealing to deal-seeking shoppers.
### **Conclusion: Applying These Insights to Your Holiday Strategy**
The *Klaviyo 2024 Consumer Spending Report* paints a picture of a cautious but determined consumer base, eager to make the most of the holiday season despite economic challenges. To capitalize on these trends, brands should focus on delivering value, offering early access promotions, and creating seamless omnichannel shopping experiences. By understanding the nuances of consumer behavior—whether it’s price sensitivity, generational preferences, or the desire for flexible payment options—businesses can craft targeted strategies that not only boost holiday sales but also build lasting customer relationships.
As we head into the busiest shopping season of the year, the key to success will be striking the right balance between meeting consumers’ needs for savings and quality, while maintaining the integrity and profitability of your brand.
**Categories:** Capital Markets, Consulting, Finance
---
### [Is gender quotas the right approach for businesses and society?](https://df.media/is-gender-quotas-the-right-approach-for-businesses-and-society/)
**Published:** September 25, 2024
**Author:** Jonathan Algreen
**Content:**
The general narrative is that the right approach is to introduce gender quotas for women’s representation at board level in companies above a certain size. This idea got its early traction a decade ago based on the statistics that women weren’t, and still aren’t, represented equally at company board level compared to men. In other words, men were and still are overrepresented at the highest positions in the business world.
### Why is this a problem?
In a time where focus has changed from equality of opportunity to equality of outcome the inequality debate has changed from what to do to change society over time with the realization that change never comes easily or fast but a longer perspective needs to be the steering wheel rather than a rapid change that often makes the problem bigger, or create new challenges and negative externalities.
A more fundamental problem is that by changing focus from equality of opportunity to equality of outcome the very foundation of the western democracy is shaken and potentially shattered because it’s based on one of the most fundamental ideas, the meritocracy.
All the way back to Plato this concept has been discussed and today there is a strong consensus that meritocracy is not just one of the pillars in the western democracy but also one of the main reasons for the western world’s success and wealth. This doesn’t mean that the concept isn’t directly under attack by certain scholars’ putting it into question whether it’s the best approach to base our society on. As Clifton Mark [wrote](https://press.princeton.edu/ideas/a-belief-in-meritocracy-is-not-only-false-its-bad-for-you?srsltid=AfmBOorY0rYCLrzrPfNy-BePqGPWwQwTI_DxQVYh4ZgneJgbvsIU6wrC) in Princeton University Press in 2020, *“Despite the moral assurance and personal flattery that meritocracy offers to the successful, it ought to be abandoned both as a belief about how the world works and as a general social ideal. It’s false, and believing in it encourages selfishness, discrimination and indifference to the plight of the unfortunate.”* It’s obvious the concept of meritocracy has its flaws and isn’t perfect, but what’s the alternative? Adrian Wooldridge [discusses](https://literaryreview.co.uk/earning-our-stripes) this topic deeply in his book The Aristocracy of Talent: How Meritocracy Made the Modern World where he sees the same imperfect meritocracy but still opposite to Clifton Mark and others, he concludes that it’s still the best concept to build our democracy and society on and can potentially be dangerous to dissolve, at least for now it’s too early to throw the meritocratic based society away.
The strongest argument for a meritocratic approach in society is that the opposite is less desirable. Where some may think the opposite of meritocracy is a more equal society it’s not the truth. Opposite meritocracy is aristocracy and a society based on nepotism and dynasty. This means that by dissolving meritocracy, where the method is to legislate for ensuring equality of opportunity, the result will be a focus on and method to legislate for ensuring equality of outcome that therefore leads to a society based on nepotism and dynasty.
### The devil is in the details
The solution has seemed tremendously simple by focusing on the outcome and therefore introducing new government legislation that requires certain actions like a specific percentage of women in boards of larger companies. The first country to introduce this backed by new legislation was [Norway](https://academic.oup.com/book/44441/chapter/376662710#426302646) with a 40% quota for women at board level in large corporations. Shortly after followed several European countries like Germany, France and Spain. It was expected that Sweden and Denmark would follow their Scandinavian sibling but to this day they haven’t. One could ask why is that since Norway, an aligned partner in all aspects, was a first mover and several European countries followed but why didn’t Sweden and Denmark?
The answer to this question may be cultural. Sweden and Denmark are often interpreted as the most liberal countries in Europe, strongly driven by fundamental values of the indivuídual rights and the values the western democracy is built on. Those values like a meritocratic foundation are a stronghold in these two countries and therefore the idea of a quotas approach to anything in the business world is not a natural path to them.
Another important reason may be the fact that there is no evidence supporting this approach will lead to better, stronger and more successful businesses and therefore a better society as a whole. This has been [discussed by experts](https://hir.harvard.edu/equal-representation-the-debate-over-gender-quotas-part-2/) around the world and hasn’t led to any proof and strong evidence yet.
### If not quotas then what?
It seems obvious that there is added value in a broader approach and higher level of diversity in the workplace, which includes the positions on the upper floor. But at the same time there are no easy fixes if we don’t want to undermine the pillars the Western liberal democracy is built upon. Instead we need to have the longer perspective in mind when legislation is made, but also by looking into how we educate and the culture we built not just in the companies but even more importantly in the society as a whole. We need to ask questions like; are girls throughout the school years motivated to go into business, management and strive for the highest positions in business? Are women met with openness towards leadership positions in business? Are women welcomed into the strongest business networks in our society? Do we create the right culture in our organization if there is no room for maternity leave without disqualifying yourself from future leadership positions?
These questions need to be asked, by all of us, and we need to make a change where we come short. The objective should be to change the culture and the mindset, but only where we obviously come short and without undermining the strengths our society are built on, or the free choice of whom to hire in the organization and for women to still have the free choice to choose differently, choose family over career or another kind of a career than leadership. All this has to go hand in hand if we want to keep moving forward in a society where the foundation is equality of opportunity rather than equality of outcome.
Politicians tend to look for quick fixes but there are no easy short term solutions for this. It’s a cultural challenge that can be changed by ensuring the right approach throughout the early years in education and parenting to get to a point where we all truly understand that women in business and leadership are as qualified as their colleagues of the other gender. What they choose is up to them alone and we should all accept it, even if the outcome isn’t a 50-50 balance, it probably never will be due to differences in how people and genders prioritise their lives and careers.
**Categories:** Consulting
---
### [How Can You Save Money As A Landlord?](https://df.media/how-can-you-save-money-as-a-landlord/)
**Published:** August 16, 2023
**Author:** Ethan Brooks
**Content:**
Being a landlord can be a great investment, but you will also encounter some financial obstacles that can cost up to thousands. Fortunately, there are some strategies that landlords can use to save money without compromising on the quality of their rental properties.
[More than half (56%) of all landlords in a government survey owned 5 or more properties](https://www.gov.uk/government/statistics/english-private-landlord-survey-2021-main-report/english-private-landlord-survey-2021-main-report--2). This can lead to a huge amount of profit but also a lot of outgoing expenses. In this article, we explore some practical tips on how you can effectively save money as a landlord.
## Efficient Property Maintenance
One of the most effective ways to save money as a landlord is to prioritise efficient property maintenance. Regularly inspecting and addressing maintenance issues can prevent minor problems from turning into big, costly repairs or renovations.
Simple tasks like fixing leaky faucets, repairing damaged tiles, and maintaining heating systems can prevent larger issues and reduce long-term repair expenses. Creating a preventative maintenance schedule can help you stay on top of property upkeep, extend the lifespan of appliances and fixtures, and minimise unexpected repair costs.
## Energy Efficiency Upgrades
Investing in [energy-efficient upgrades](https://www.gov.uk/green-deal-energy-saving-measures/improvements-and-benefits-to-your-home) for your rental property can add up to huge cost savings over time. Consider installing [energy-efficient lighting](https://warmable.co.uk/guides/6-effective-ways-to-save-money-on-energy-around-the-house/), thermostats, and insulation to reduce utility bills and attract eco-conscious tenants.
Upgrading to double-glazed windows can improve energy efficiency and reduce heating costs. Fitting energy-efficient appliances such as dishwashers and washing machines can appeal to prospective tenants and enhance the property’s overall value.
## Negotiate Service Contracts
As a landlord you may need to pay for services such as gardening, waste removal, or property management. You can save money by negotiating contracts with service providers. Shop around for competitive rates and consider bundling services for potential discounts.
Building a good relationship with reliable contractors can also lead to better rates for maintenance and repairs. Always request multiple quotes for significant projects to ensure you get the best value for your money.
## DIY and Self-Management
While you absolutely have to comply with safety regulations and ensure that repairs are carried out professionally, some minor maintenance tasks can be handled through DIY. Simple tasks like painting, replacing handles, or fixing minor plumbing issues can save you money on labour costs.
You could also consider self-managing your property if you have the time and expertise. Managing the property yourself can eliminate the need for a letting agent’s fees, saving you a significant percentage of the rental income.
## Tenant Retention and Communication
High tenant turnover can lead to increased costs, such as advertising for new tenants, conducting background checks, and potential periods of vacancy. If you have a good relationship with your tenants, you can reduce these costs.
Maintaining open communication with your tenants and addressing their concerns as soon as possible can make them more likely to stay with you. By building a positive landlord-tenant relationship, you increase the likelihood of tenants renewing their leases.
## Mortgage and Interest Rates
Regularly review your mortgage and interest rates to ensure you are getting the best deal possible. Refinancing your mortgage or [getting a remortgage](https://deedlefinance.com/guides/what-is-remortgaging/) or switching to a different lender if you find a better rate can save you money on monthly repayments.
However, keep in mind any early repayment fees or other costs associated with refinancing. Ask for advice from a mortgage broker to determine the most cost-effective options for your specific circumstances.
## Insurance Policies
Review your landlord insurance policies regularly to ensure they provide adequate coverage at the best rates. While you need to have comprehensive coverage for potential risks, paying for unnecessary or overlapping coverage can be costly.
Consider bundling multiple properties under a single insurance policy to potentially qualify for discounts. Always compare quotes from different insurance providers to find the best value for your coverage needs.
## Tax Deductions
As a landlord in the UK, you are eligible for various tax deductions that can help reduce your overall tax liability. Keep detailed records of all expenses related to your rental property, including mortgage interest, property maintenance, insurance, and property management fees.
These deductions can be offset against your rental income, reducing your taxable profits and ultimately saving you money on your tax bill. Check on the government website or consult an advisor or accountant if you need more information.
## Long-Term Rental Strategies
While short-term rentals may generate higher income during peak seasons, they can also be more expensive to manage due to higher turnover rates and marketing costs. Consider focusing on long-term rental strategies to secure stable, reliable tenants.
Long-term tenants are more likely to treat the property as their home, reducing the risk of property damage. By renting long-term, you also cut the time and costs associated with finding new tenants.
**Categories:** Business, Finance
**Tags:** EnergyEfficiency, Landlord, PropertyMaintenance
---
### [Top 5 E-Commerce Business Models](https://df.media/top-5-e-commerce-business-models/)
**Published:** August 31, 2023
**Author:** Maya Pise
**Content:**
An e-commerce business is a company or organization that conducts most of its activities over the internet. It may have some physical presence, such as a store, office or warehouse, but most of its sales are online. What makes e-commerce a convenient and viable option for many businesses is that things can often be automated.
Thanks to the internet, businesses can reach many more people. Businesses don’t just have to restrict themselves to having local customers; they can easily have customers from anywhere. Another perk of going online is that the internet makes it easier to give customers what they want.
## Subscription Services
[Subscription services are very popular right now](https://history-computer.com/the-10-largest-subscription-companies-in-the-world-and-what-they-do/). When it comes to subscriptions for physical products, you pay a fee and receive regular deliveries. Some products you can subscribe to include flowers, books, and food. Sign up, and you can schedule to receive deliveries at regular intervals which best suit you.
With food subscription services, you choose meals, and the ingredients are delivered to your door, along with recipes. Everything is fresh, and ice packs are used to keep certain ingredients cool, so they don’t spoil. A tactic that subscription companies use to retain customers is to change their line-up of options regularly. A food subscription company, for example, might change its selection of recipes every month. Some even offer subscriptions to surprise boxes, where consumers are unaware of which products they will receive.
## Auction or Bidding Sites
These days, people like to get a deal. It should come as no surprise that many people enjoy using auction/bidding sites to get things for reduced prices. [eBay](https://www.ebay.com/) is, without a doubt, the best-known one. You can put almost anything up for auction at this site and have people bid on it.
Etsy is another popular site, though it has a key difference: it’s focused on handmade and vintage items. As well as selling your own products on these sites and buying things from other people, you can even set up your own site. This is harder than using an established platform, but the advantage is that you can set your own terms; you could even make more money from each sale.
## Social Media Sales
Many people also sell products or services through their social media accounts. They promote their offerings to followers they’ve already got – friends, colleagues and other people – and try to build their customer base up. Sites like Facebook and Twitter can work wonders for independent start-ups.
Social media can be very competitive though, simply because anyone can use it to promote something. Those who want to use it to build up an e-commerce business have to be persistent with their posting. They also have to reach as many people as possible for their venture to succeed.
## Retail E-Commerce
The way this particular model works is simple. Your website is essentially a digital store. Visitors browse through your collection of products or services and can make purchases right then and there. All transactions are done through your own site. The main consideration of this approach is attracting people to your website.
To get enough sales, you have to market your product range effectively. Forming connections with other sites, for example, blogs in your niche, can be a helpful strategy as it may expand your reach and bring in new customers.
## Business to Business
E-commerce isn’t just for businesses selling things to the general public; it also supports transactions between one business and another. Companies and organisations use e-commerce platforms because it enables them to reach clients much more easily. With the internet, the potential is unlimited in that a business could potentially make deals with any other business in the world. The possibilities are endless, which is why almost every enterprise is online.
Many businesses who do deals with others have two sides to their websites. There’s the open, public part that anyone can access. Then there’s a private, members-only part that’s for clients and business partners only.
## Conclusion
E-commerce is the way forward for businesses. These days, if a business doesn’t have some sort of online presence, it’s going to struggle to establish itself and generate enough money. Eventually, though, e-commerce may give way to a more technologically advanced way of doing business.
The Metaverse is an example of this. Instead of buying things as a person, you make purchases using your Metaverse avatar. Gaming can even be done this way. You can enjoy regular video games or gamble by playing [Microgaming games online](https://www.platincasino.com/en-ca/microgaming.html), for example. This may be the start of an entirely new way of driving e-commerce.
**Categories:** Business
---
### [How To Avoid The Financial Pitfalls Of Divorce](https://df.media/how-to-avoid-the-financial-pitfalls-of-divorce/)
**Published:** August 9, 2023
**Author:** Daily Finance
**Content:**
Divorce is not only an emotionally taxing process but also a significant financial event that can have long-lasting effects on both parties involved.
Splitting assets, dividing debts and determining support payments can be complex and overwhelming, potentially leading to financial pitfalls if not managed carefully.
However, with proper planning, open communication and informed decision-making, it is possible to avoid common financial mistakes during divorce.
In this article, we will explore essential strategies and tips to help individuals navigate the financial aspects of divorce, ensuring a more secure and stable financial future.
## Organise and Assess Your Finances
The first step in avoiding financial pitfalls during divorce is to thoroughly organise and assess your finances. [Divorce Bob](https://www.divorcebob.com/) recommends that you create a comprehensive list of all assets, including bank accounts, investments, properties and valuable possessions.
Likewise, make a list of all debts, loans and liabilities. This detailed financial inventory will serve as a foundation for equitable asset division and ensure that no assets or debts are overlooked during the divorce process.
## Safeguarding Your Business
For business owners, divorce can pose unique financial challenges. To protect your business, conduct a professional business valuation to determine its true value, aiding equitable asset division. Maintain clear separation between personal and business finances to avoid disputes.
Consider negotiating a buyout or co-ownership arrangement with your spouse to secure business continuity. Explore mediation or collaboration as cost-effective alternatives to litigation. Safeguarding your business during divorce will ensure its stability and protect your hard-earned assets for a successful future post-divorce.
## Seek Professional Financial Guidance
Divorce involves complex financial decisions that can have lasting implications. To navigate these intricacies with confidence, seek the guidance of financial professionals experienced in divorce matters such as the [NADP](https://thenadp.com/).
Consulting a financial planner or divorce financial analyst can provide valuable insights into tax implications, asset division and long-term financial planning. Working with professionals will help you make well-informed decisions aligned with your financial goals and needs.
## Understand the True Value of Assets
Often, divorcing couples focus on the market value of assets without considering their future financial worth.
For instance, the long-term value of a retirement account may differ significantly from its current market value due to taxes and penalties upon withdrawal. It is essential to consider the potential tax consequences and future growth of assets before making decisions on how to divide them.
## Avoid Emotional Financial Decisions
Emotions can run high during divorce, leading to impulsive financial decisions. It is crucial to approach financial matters with a clear and rational mindset.
Avoid making decisions out of spite, revenge or frustration, as these may lead to financial pitfalls in the long run. Instead, focus on pragmatic and well-thought-out choices that align with your financial needs and goals.
## Negotiate for Equitable Asset Division
Divorce is not about “winning” or “losing” but rather achieving a fair and equitable resolution. Work with your spouse and their legal counsel to negotiate a reasonable division of assets that considers the needs and interests of both parties.
Being open to compromise and cooperation can help avoid costly litigation and foster a smoother divorce process.
## Consider the Impact Child Support
If child support payments are involved, carefully assess their impact on your financial situation. Child support payments can have significant tax implications for both the paying spouse and the recipient. Child support calculations may vary by location, and it is essential to understand how these payments may affect your overall financial picture.
Divorce is undoubtedly a challenging life event, but with careful financial planning and thoughtful decision-making, you can avoid common financial pitfalls. The strategies detailed in this article are all essential steps in securing your financial future post-divorce.
By taking a proactive approach and prioritising financial stability, you can emerge from divorce with greater confidence and peace of mind as you embark on a new chapter in your life.
**Categories:** Business, Finance
**Tags:** ChildSupport, Divorce, FinancialFuture
---
### [Deadline Reminder: Kessler Topaz Meltzer & Check, LLP Reminds Electric Last Mile Solutions, Inc. (ELMS) Investors with Substantial Losses to Contact the Firm](https://df.media/deadline-reminder-kessler-topaz-meltzer-check-llp-reminds-electric-last-mile-solutions-inc-elms-investors-with-substantial-losses-to-contact-the-firm/)
**Published:** July 27, 2023
**Author:** Daily Finance
**Content:**
RADNOR, Pa., April 2, 2022 /PRNewswire/ — The law firm of Kessler Topaz Meltzer & Check, LLP informs investors that a securities class action lawsuit has been filed against Electric Last Mile Solutions, Inc. (“Electric Last Mile”) (NASDAQ: ELMS) f/k/a Forum Merger III Corp. (NASDAQ: FIII). The action charges Electric Last Mile with violations of the federal securities laws, including omissions and fraudulent misrepresentations relating to the company’s business, operations, and prospects. As a result of Electric Last Mile’s materially misleading statements to the public, Electric Last Mile investors have suffered significant losses.
[](https://web.archive.org/web/20221126161126/https://mma.prnewswire.com/media/277422/ktmc_Logo.html)
Kessler Topaz is one of the world’s foremost advocates in protecting the public against corporate fraud and other wrongdoing. Our securities fraud litigators are regularly recognized as leaders in the field individually and our firm is both feared and respected among the defense bar and the insurance bar. We are proud to have recovered billions of dollars for our clients and the classes of shareholders we represent.
**ELECTRIC LAST MILE’S ALLEGED MISCONDUCT** Electric Last Mile is a commercial electric vehicle solutions company that focuses on designing, engineering, manufacturing, and customizing electric delivery and utility vehicles.
On February 1, 2022, after regular market trading hours, Electric Last Mile revealed that its previously issued financial statements should no longer be relied upon as the company would be restating its previously issued financial statements from August 20, 2020 (inception) through December 31, 2020, including statements in Electric Last Mile’s registration statement. Electric Last Mile also announced the resignations of defendants James Taylor and Jason Luo, the company’s co-founders and CEO and Executive Chairman, respectively. In addressing their resignations, Electric Last Mile revealed that following an investigation by a Special Committee of the Board of Directors into “certain sales of equity securities” made by and to individuals associated with the company, Electric Last Mile determined that in November and December 2020, certain executives purchased equity in the company “at substantial discounts to market value” without any independent valuation.
Following this news, Electric Last Mile’s share price fell $2.88 per share, or 51%, to close at $2.71 per share on February 2, 2022.
**WHAT CAN I DO?** Electric Last Mile investors may, ***no later than April 4, 2022*** seek to be appointed as a lead plaintiff representative of the class through Kessler Topaz Meltzer & Check, LLP or other counsel, or may choose to do nothing and remain an absent class member. Kessler Topaz Meltzer & Check, LLP encourages Electric Last Mile investors who have suffered significant losses to contact the firm directly to acquire more information.
**WHO CAN BE A LEAD PLAINTIFF?** A lead plaintiff is a representative party who acts on behalf of all class members in directing the litigation. The lead plaintiff is usually the investor or small group of investors who have the largest financial interest and who are also adequate and typical of the proposed class of investors. The lead plaintiff selects counsel to represent the lead plaintiff and the class and these attorneys, if approved by the court, are lead or class counsel. Your ability to share in any recovery is not affected by the decision of whether or not to serve as a lead plaintiff.
**ABOUT KESSLER TOPAZ MELTZER & CHECK, LLP** Kessler Topaz Meltzer & Check, LLP prosecutes class actions in state and federal courts throughout the country and around the world. The firm has developed a global reputation for excellence and has recovered billions of dollars for victims of fraud and other corporate misconduct. All of our work is driven by a common goal: to protect investors, consumers, employees and others from fraud, abuse, misconduct and negligence by businesses and fiduciaries. At the end of the day, we have succeeded if the bad guys pay up, and if you recover your assets. The complaint in this action was not filed by Kessler Topaz Meltzer & Check, LLP.
**Categories:** Global News
---
### [DEADLINE APPROACHING: Investors in Telefonaktiebolaget LM Ericsson with Substantial Losses Have Opportunity to Lead Class Action Lawsuit – ERIC](https://df.media/deadline-approaching-investors-in-telefonaktiebolaget-lm-ericsson-with-substantial-losses-have-opportunity-to-lead-class-action-lawsuit-eric-2/)
**Published:** July 27, 2023
**Author:** Daily Finance
**Content:**
SAN DIEGO, March 19, 2022 /PRNewswire/ — The law firm of **Robbins Geller Rudman & Dowd LLP** announces that purchasers or acquirers of Telefonaktiebolaget LM Ericsson (NASDAQ: ERIC) securities between April 27, 2017 and February 25, 2022, both dates inclusive (the “Class Period”) have until May 2, 2022 to seek appointment as lead plaintiff in *Nyy v. Telefonaktiebolaget LM Ericsson*, No. 22-cv-01167 (E.D.N.Y.). Commenced on March 3, 2022 and assigned to Judge William F. Kuntz, II, the *Ericsson* class action lawsuit charges Ericsson and certain of its top executive officers with violations of the Securities Exchange Act of 1934.
[](https://web.archive.org/web/20221128225643/https://mma.prnewswire.com/media/198876/robbins_geller_rudman_and_dowd_llp_logo.html)
**CASE ALLEGATIONS**: Ericsson, together with its subsidiaries, provides communication infrastructure, services, and software solutions to the telecommunications and other sectors. Ericsson operates in, among other countries, the Republic of Iraq.
The *Ericsson* class action lawsuit alleges that, throughout the Class Period, defendants made false and misleading statements and failed to disclose that: (i) Ericsson overstated the extent to which it had reformed its business practices to eliminate the use of bribes to secure business in foreign countries; (ii) Ericsson had paid bribes to the terrorist group the Islamic State in Iraq and Syria (“ISIS” or the “Islamic State”) to gain access to certain transport routes in Iraq; (iii) accordingly, Ericsson’s revenues derived from its operations in Iraq were, in at least substantial part, derived from unlawful conduct and thus unsustainable; and (iv) as a result, Ericsson’s public statements were materially false and misleading at all relevant times.
On February 16, 2022, Ericsson’s CEO told a Swedish newspaper that Ericsson may have made payments to ISIS to gain access to certain transport routes in Iraq, noting that Ericsson had identified “unusual expenses dating back to 2018” but had not yet determined the final recipient of the funds for those expenses, although defendants could “see that it disappeared,” and that Ericsson has spent “considerable resources trying to understand this as best we can.” On this news, Ericsson’s American Depositary Share (“ADS”) price fell by more than 11%.
Then, on February 27, 2022, the International Consortium of Investigative Journalists (“ICIJ”) published a report on Ericsson’s alleged dealings with ISIS in Iraq, citing a leaked internal investigation that revealed that Ericsson had reportedly made “tens of millions of dollars in suspicious payments” over nearly a decade to keep its business in the country. The ICIJ report also alleged that “a spreadsheet lists company probes into possible bribery, money laundering and embezzlement by employees in Angola, Azerbaijan, Bahrain, Brazil, China, Croatia, Libya, Morocco, the United States and South Africa,” which “have not been previously disclosed.” On this news, Ericsson’s ADS price fell an additional 8.3%, further damaging investors.
**THE LEAD PLAINTIFF PROCESS**: The Private Securities Litigation Reform Act of 1995 permits any investor who purchased Ericsson securities during the Class Period to seek appointment as lead plaintiff in the *Ericsson* class action lawsuit. A lead plaintiff is generally the movant with the greatest financial interest in the relief sought by the putative class who is also typical and adequate of the putative class. A lead plaintiff acts on behalf of all other class members in directing the class action lawsuit. The lead plaintiff can select a law firm of its choice to litigate the class action lawsuit. An investor’s ability to share in any potential future recovery of the class action lawsuit is not dependent upon serving as lead plaintiff.
**ABOUT ROBBINS GELLER RUDMAN & DOWD LLP**: Robbins Geller Rudman & Dowd LLP is one of the world’s leading complex class action firms representing plaintiffs in securities fraud cases. The Firm is ranked #1 on the 2021 ISS Securities Class Action Services Top 50 Report for recovering nearly $2 billion for investors last year alone – more than triple the amount recovered by any other plaintiffs’ firm. With 200 lawyers in 9 offices, Robbins Geller’s attorneys have obtained many of the largest securities class action recoveries in history, including the largest securities class action recovery ever – $7.2 billion – in *In re Enron Corp. Sec. Litig.*
**Categories:** Global News
---
### [Duff & Phelps Utility and Infrastructure Fund Inc. Announces Dividend and Discloses Sources of Distribution Section 19(a) Notice](https://df.media/duff-phelps-utility-and-infrastructure-fund-inc-announces-dividend-and-discloses-sources-of-distribution-section-19a-notice/)
**Published:** July 27, 2023
**Author:** Daily Finance
**Content:**
CHICAGO, March 7, 2022 /PRNewswire/ — The Board of Directors of Duff & Phelps Utility and Infrastructure Fund Inc. (NYSE: DPG), a closed-end fund advised by Duff & Phelps Investment Management Co., today authorized the payment of dividends on its common stock as follows:
| **Cents Per Share** | **Ex-Date** | **Record Date** | **Payable Date** |
|---|---|---|---|
| 35.0 | June 14, 2022 | June 15, 2022 | June 30, 2022 |
The Fund adopted a Managed Distribution Plan (the “Plan”) in 2015 to maintain its current 35 cents per share distribution rate. Under the Plan, the Fund will distribute all available investment income to its shareholders, consistent with the Fund’s investment objective. If and when sufficient investment income is not available on a quarterly basis, the Fund will distribute realized capital gains and/or return of capital to its shareholders in order to maintain the 35 cents per share distribution level.
The following table sets forth the estimated amounts of the Fund’s March quarterly distribution to shareholders of record at the close of business on March 15, 2022 (ex-date March 14, 2022), payable March 31, 2022, together with the cumulative distributions paid this fiscal year to date from the following sources. All amounts are expressed per share of common stock based on U.S. generally accepted accounting principles which may differ from federal income tax regulations.
| **Distribution Estimates** | **March 2022 (QTD)** | **Year-to-date (YTD)** | |
|---|---|---|---|
| (Sources) | *Per ShareAmount* | *% of Current Distribution* | *Per Share Amount* | *% ofCumulative Distributions* | |
| Net Investment Income | $ 0.040 | 11.5% | $ 0.087 | 12.4% | |
| Net Realized Short-Term Capital Gains | 0.000 | 0.0% | 0.000 | 0.0% | |
| Net Realized Long-Term Capital Gains | 0.000 | 0.0% | 0.000 | 0.0% | |
| Return of Capital (or other Capital Source) | 0.310 | 88.5% | 0.613 | 87.6% | |
| **Total** | **$ 0.350** | **100.0%** | **$ 0.700** | **100.0%** | |
| | |
| | |
| **As of February 28, 2022** | | |
| Average annual total return on NAV for the 5 years | 3.03% | |
| Annualized current distribution rate as a percentage of NAV | 10.01% | |
| Cumulative total return on NAV for the fiscal year | 2.95% | |
| Cumulative fiscal year distributions as a percentage of NAV | 5.00% | |
| | |
| | | | | | | | | |
The Fund will issue a separate 19(a) notice at the time of each quarterly distribution using the most current financial information available. You should not draw any conclusions about the Fund’s investment performance from the amount of these distributions or from the terms of the Fund’s managed distribution plan.
The Fund estimates that it has distributed more than its income and capital gains; therefore, a portion of your distribution may be a return of capital. A return of capital may occur, for example, when some or all of the money that you invested in the Fund is paid back to you. A return of capital distribution does not necessarily reflect the Fund’s investment performance and should not be confused with ‘yield’ or ‘income’.
The amounts and sources of distributions reported in this notice are only estimates and are not being provided for tax reporting purposes. The actual amounts and sources of the amounts for tax reporting purposes will depend upon the Fund’s investment experience during the remainder of the fiscal year and may be subject to changes based on tax regulations. The Fund or your broker will send you a Form 1099-DIV for the calendar year that will tell you how to report these distributions for federal income tax purposes.
**About the Fund**
Duff & Phelps Utility and Infrastructure Fund Inc. is a closed-end investment management company whose investment objective is to seek total return, resulting *primarily* from (i) a high level of current income, with an emphasis on providing tax-advantaged dividend income and (ii) growth in current income, and *secondarily* from capital appreciation. The Fund seeks to achieve these objectives by investing primarily in equities of domestic and foreign utilities and infrastructure providers. Under normal market conditions, the Fund will invest at least 80% of its total assets in dividend-paying equity securities of companies in the utility industry and the infrastructure industry. The utility industry is defined to include the following sectors: electric, gas, water, telecommunications, and midstream energy. The infrastructure industry is defined as companies owning or operating essential transportation assets, such as toll roads, bridges, tunnels, airports, seaports, and railroads. For more information, please contact shareholder services at (866) 270-7598.
**About the Investment Adviser**
Duff & Phelps Investment Management Co. is a subsidiary of Virtus Investment Partners (NASDAQ: VRTS), a multi-boutique asset manager. Duff & Phelps has more than 35 years of experience managing investment portfolios, including institutional separate accounts and open- and closed-end funds investing in utilities, infrastructure, MLPs and real estate investment trusts (REITs).
**Categories:** Finance
---
### [DOCU INVESTOR NEWS: ROSEN, TOP RANKED GLOBAL INVESTOR COUNSEL, Encourages DocuSign, Inc. Investors with Losses to Secure Counsel Before Important Deadline in Securities Class Action – DOCU](https://df.media/docu-investor-news-rosen-top-ranked-global-investor-counsel-encourages-docusign-inc-investors-with-losses-to-secure-counsel-before-important-deadline-in-securities-class-action-docu/)
**Published:** July 27, 2023
**Author:** Daily Finance
**Content:**
NEW YORK, Jan. 30, 2022 /PRNewswire/ — **WHY:** Rosen Law Firm, a global investor rights law firm, reminds purchasers of the securities of DocuSign, Inc. (NASDAQ: DOCU) between March 27, 2020 and December 2, 2021, both dates inclusive (the “Class Period”), of the important **February 22, 2022** **lead plaintiff deadline** in securities class action commenced by the Firm.
**SO WHAT:** If you purchased DocuSign securities during the Class Period you may be entitled to compensation without payment of any out of pocket fees or costs through a contingency fee arrangement.
**WHY ROSEN LAW:** We encourage investors to select qualified counsel with a track record of success in leadership roles. Often, firms issuing notices do not have comparable experience, resources, or any meaningful peer recognition. Many of these firms do not actually litigate securities class actions. Be wise in selecting counsel. The Rosen Law Firm represents investors throughout the globe, concentrating its practice in securities class actions and shareholder derivative litigation. Rosen Law Firm has achieved the largest ever securities class action settlement against a Chinese Company. Rosen Law Firm was Ranked No. 1 by ISS Securities Class Action Services for number of securities class action settlements in 2017. The firm has been ranked in the top 4 each year since 2013 and has recovered hundreds of millions of dollars for investors. In 2019 alone the firm secured over $438 million for investors. In 2020, founding partner Laurence Rosen was named by law360 as a Titan of Plaintiffs’ Bar. Many of the firm’s attorneys have been recognized by Lawdragon and Super Lawyers.
**DETAILS OF THE CASE:** According to the lawsuit, defendants throughout the Class Period made false and/or misleading statements and/or failed to disclose that: (1) the impact of the Covid-19 pandemic on DocuSign’s business was positive, not negative; (2) DocuSign misrepresented the role that the Covid-19 pandemic had on its growth; (3) DocuSign downplayed the impact that a “return to normal” would have on the Company’s growth and business; and (4) as a result, defendants’ public statements were materially false and/or misleading at all relevant times. When the true details entered the market, the lawsuit claims that investors suffered damages.
No Class Has Been Certified. Until a class is certified, you are not represented by counsel unless you retain one. You may select counsel of your choice. You may also remain an absent class member and do nothing at this point. An investor’s ability to share in any potential future recovery is not dependent upon serving as lead plaintiff.
**Categories:** Global News
---
### [DNP SELECT INCOME FUND ANNOUNCES DIVIDENDS AND SOURCES OF DISTRIBUTION](https://df.media/dnp-select-income-fund-announces-dividends-and-sources-of-distribution/)
**Published:** July 27, 2023
**Author:** Daily Finance
**Content:**
CHICAGO, March 7, 2022 /PRNewswire/ — The Board of Directors of DNP Select Income Fund Inc. (NYSE: DNP), a closed-end fund advised by Duff & Phelps Investment Management Co., today authorized the payment of dividends on its common stock as follows:
| Cents Per Share | Ex-Dividend Date | Record Date | Payable Date |
|---|---|---|---|
| 6.5 | April 28, 2022 | April 29, 2022 | May 10, 2022 |
| 6.5 | May 27, 2022 | May 31, 2022 | June 10, 2022 |
| 6.5 | June 29, 2022 | June 30, 2022 | July 11, 2022 |
The Fund adopted a Managed Distribution Plan (the “Plan”) in 2007 to maintain its current 6.5 cent per share distribution rate. Under the Plan, the Fund will distribute all available investment income to its shareholders, consistent with the Fund’s primary objective. If and when sufficient investment income is not available on a monthly basis, the Fund will distribute long-term capital gains and/or return of capital to its shareholders in order to maintain the 6.5 cent per share distribution level.
The following table sets forth the estimated amounts of the Fund’s current monthly distribution, payable March 10, 2022, together with the cumulative distributions paid this fiscal year to date from the following sources. The fiscal year is from November 1, 2021 to October 31, 2022. All amounts are expressed per share of common stock based on U.S. generally accepted accounting principles, which may differ from federal income tax regulations.
| Notification of Sources of Distribution |
|---|
| Distribution Period: February 2022 |
| Distribution Amount Per Share of Common Stock: $0.065 |
| |
| Distribution Estimates | February 2022 | Fiscal YTD |
| | Per Share Amount | % of Current Distribution | Per Share Amount | % of Cumulative Distributions |
| Net Investment Income | $0.019 | 29% | $0.088 | 34% |
| Net Realized Short-Term Capital Gains | – | – | – | – |
| Net Realized Long-Term Capital Gains | 0.025 | 39% | 0.133 | 51% |
| Return of Capital (or Other Capital Source) | 0.021 | 32% | 0.039 | 15% |
| Total(per common share) | $0.065 | 100% | $0.260 | 100% |
| January 31, 2022 | |
|---|---|
| Average annual total return\* on NAV for the 5 years ended | 9.55% |
| Annualized current distribution rate as a percentage of NAV | 8.02% |
| Cumulative total return on NAV for the fiscal YTD | 5.02% |
| Cumulative fiscal year distributions as a percentage of NAV | 2.01% |
\* Simple arithmetic average of each of the past five annual returns.
You should not necessarily draw any conclusions about the Fund’s investment performance from the amount of these distributions or from the terms of the Fund’s Plan.
The amounts and sources of distributions reported in this notice are only estimates and are not being provided for tax reporting purposes. The actual amounts and sources of the amounts for tax reporting purposes will depend upon the Fund’s investment experience during the remainder of the fiscal year and may be subject to changes based on tax regulations. The Fund or your broker will send you a Form 1099-DIV for the calendar year that will tell you how to report these distributions for federal income tax purposes.
The Fund will issue a separate 19(a) notice at the time of each monthly distribution using the most current financial information available.
**About the Fund**
DNP Select Income Fund Inc. is a closed-end diversified investment management company whose primary investment objectives are current income and long-term growth of income. The fund seeks to achieve these objectives by investing primarily in a diversified portfolio of equity and fixed income securities of companies in the public utilities industry. For more information, please call (800) 864-0629.
**About the Investment Adviser**
Duff & Phelps Investment Management Co. has more than 40 years of experience managing investment portfolios, including institutional separate accounts and open- and closed-end funds investing in utilities, infrastructure and real estate investment trusts (REITs).
Duff & Phelps is a subsidiary of Virtus Investment Partners (NASDAQ: VRTS), a multi-boutique asset manager with $187.2 billion under management as of December 31, 2021. Virtus provides investment management products and services to individuals and institutions through a multi-manager asset management business, comprising a number of individual affiliated managers, each with a distinct investment style, autonomous investment process and individual brand.
**Categories:** Global News
---
### [Cohen & Steers Total Return Realty Fund, Inc. (RFI) Notification of Sources of Distribution Under Section 19(a)](https://df.media/cohen-steers-total-return-realty-fund-inc-rfi-notification-of-sources-of-distribution-under-section-19a/)
**Published:** July 27, 2023
**Author:** Daily Finance
**Content:**
NEW YORK, March 28, 2022 /PRNewswire/ — This press release provides shareholders of Cohen & Steers Total Return Realty Fund, Inc. (NYSE: RFI) (the “Fund”) with information regarding the sources of the distribution to be paid on March 31, 2022 and cumulative distributions paid fiscal year-to-date.
In December 2011, the Fund implemented a managed distribution policy in accordance with exemptive relief issued by the Securities and Exchange Commission. The managed distribution policy seeks to deliver the Fund’s long-term total return potential through regular monthly distributions declared at a fixed rate per common share. The policy gives the Fund greater flexibility to realize long-term capital gains throughout the year and to distribute those gains on a regular monthly basis to shareholders. The Board of Directors of the Fund may amend, terminate or suspend the managed distribution policy at any time, which could have an adverse effect on the market price of the Fund’s shares.
The Fund’s monthly distributions may include long-term capital gains, short-term capital gains, net investment income and/or return of capital for federal income tax purposes. Return of capital includes distributions paid by the Fund in excess of its net investment income and net realized capital gains and such excess is distributed from the Fund’s assets. A return of capital is not taxable; rather, it reduces a shareholder’s tax basis in his or her shares of the Fund. In addition, distributions from the Fund’s investments in real estate investment trusts (REITs) may later be characterized as capital gains and/or a return of capital, depending on the character of the dividends reported to the Fund after year-end by REITs held by the Fund. The amount of monthly distributions may vary depending on a number of factors, including changes in portfolio and market conditions.
At the time of each monthly distribution, information will be posted to cohenandsteers.com and mailed to shareholders in a concurrent notice. However, this information may change at the end of the year because the final tax characteristics of the Fund’s distributions cannot be determined with certainty until after the end of the calendar year. Final tax characteristics of all of the Fund’s distributions will be provided on Form 1099-DIV, which is mailed after the close of the calendar year.
The following table sets forth the estimated amounts of the current distribution and the cumulative distributions paid this fiscal year-to-date from the sources indicated. All amounts are expressed per common share.
| **DISTRIBUTION ESTIMATES** | **March 2022** | **YEAR-TO-DATE (YTD)March 31, 2022\*** |
|---|---|---|
| **Source** | **Per Share Amount** | **% of Current Distribution** | **Per Share Amount** | **% of 2022 Distributions** |
| Net Investment Income | $0.0000 | 0.00% | $0.0000 | 0.00% |
| Net Realized Short-Term Capital Gains | $0.0800 | 100.00% | $0.1584 | 66.00% |
| Net Realized Long-Term Capital Gains | $0.0000 | 0.00% | $0.0816 | 34.00% |
| Return of Capital (or other Capital Source) | $0.0000 | 0.00% | $0.0000 | 0.00% |
| **Total Current Distribution** | **$0.0800** | **100.00%** | **$0.2400** | **100.00%** |
**You should not draw any conclusions about the Fund’s investment performance from the amount of this distribution or from the terms of the Fund’s managed distribution policy. The amounts and sources of distributions reported in this Notice are only estimates, are likely to change over time, and are not being provided for tax reporting purposes. The actual amounts and sources of the amounts for accounting and tax reporting purposes will depend upon the Fund’s investment experience during the remainder of its fiscal year and may be subject to changes based on tax regulations. The amounts and sources of distributions year-to-date may be subject to additional adjustments.**
**\*THE FUND WILL SEND YOU A FORM 1099-DIV FOR THE CALENDAR YEAR THAT WILL TELL YOU HOW TO REPORT THESE DISTRIBUTIONS FOR FEDERAL INCOME TAX PURPOSES.**
The Fund’s Year-to-date Cumulative Total Return for fiscal year 2022 (January 1, 2022 through February 28, 2022) is set forth below. Shareholders should take note of the relationship between the Year-to-date Cumulative Total Return with the Fund’s Cumulative Distribution Rate for 2022. In addition, the Fund’s Average Annual Total Return for the five-year period ending February 28, 2022 is set forth below. Shareholders should note the relationship between the Average Annual Total Return with the Fund’s Current Annualized Distribution Rate for 2022. The performance and distribution rate information disclosed in the table is based on the Fund’s net asset value per share (NAV). The Fund’s NAV is calculated as the total market value of all the securities and other assets held by the Fund minus the total liabilities, divided by the total number of shares outstanding. While NAV performance may be indicative of the Fund’s investment performance, it does not measure the value of a shareholder’s individual investment in the Fund. The value of a shareholder’s investment in the Fund is determined by the Fund’s market price, which is based on the supply and demand for the Fund’s shares in the open market.
***Fund Performance and Distribution Rate Information*:**
| **Year-to-date January 1, 2022 to February 28, 2022** |
|---|
| Year-to-date Cumulative Total Return1 | -10.86% |
| Cumulative Distribution Rate2 | 1.67% |
| |
| **Five-year period ending February 28, 2022** |
| Average Annual Total Return3 | 9.01% |
| Current Annualized Distribution Rate4 | 6.67% |
| *1.* | Year-to-date Cumulative Total Return is the percentage change in the Fund’s NAV over the year-to-date time period including distributions paid and assuming reinvestment of those distributions. |
|---|---|
| 2. | Cumulative Distribution Rate for the Fund’s current fiscal period (January 1, 2022 through March 31, 2022) measured on the dollar value of distributions in the year-to-date period as a percentage of the Fund’s NAV as of February 28, 2022. |
| 3. | Average Annual Total Return represents the compound average of the Annual NAV Total Returns of the Fund for the five-year period ending February 28, 2022. Annual NAV Total Return is the percentage change in the Fund’s NAV over a year including distributions paid and assuming reinvestment of those distributions. |
| 4. | The Current Annualized Distribution Rate is the current fiscal period’s distribution rate annualized as a percentage of the Fund’s NAV as of February 28, 2022. |
Investors should consider the investment objectives, risks, charges and expense of the Fund carefully before investing. You can obtain the Fund’s most recent periodic reports, when available, and other regulatory filings by contacting your financial advisor or visiting cohenandsteers.com. These reports and other filings can be found on the Securities and Exchange Commission’s EDGAR Database. You should read these reports and other filings carefully before investing.
*Shareholders should not use the information provided here in preparing their tax returns. Shareholders will receive a Form 1099-DIV for the calendar year indicating how to report Fund distributions for federal income tax purposes.*
**About Cohen & Steers.** Cohen & Steers is a leading global investment manager specializing in real assets and alternative income, including real estate, preferred securities, infrastructure, resource equities, commodities, as well as multi-strategy solutions. Founded in 1986, the firm is headquartered in New York City, with offices in London, Dublin, Hong Kong, and Tokyo.
***Forward-Looking Statements*** *This press release and other statements that Cohen & Steers may make may contain forward looking statements within the meaning of Section 27A of the Securities Act of 1933 and Section 21E of the Securities Exchange Act of 1934, which reflect the company’s current views with respect to, among other things, its operations and financial performance. You can identify these forward-looking statements by the use of words such as “outlook,” “believes,” “expects,” “potential,” “continues,” “may,” “will,” “should,” “seeks,” “approximately,” “predicts,” “intends,” “plans,” “estimates,” “anticipates,” or the negative versions of these words or other comparable words. Such forward-looking statements are subject to various risks and uncertainties.*
*Accordingly, there are or will be important factors that could cause actual outcomes or results to differ materially from those indicated in these statements. The company undertakes no obligation to publicly update or review any forward-looking statement, whether as a result of new information, future developments or otherwise.*
**Categories:** Business, Finance, Global News
---
### [DISPOSITION OF COMMON SHARES OF JACK NATHAN MEDICAL CORP.](https://df.media/disposition-of-common-shares-of-jack-nathan-medical-corp/)
**Published:** July 27, 2023
**Author:** Daily Finance
**Content:**
GEORGETOWN, ON, Oct. 28, 2022 /CNW/ – This press release is being disseminated as required by National Instrument 62–103 – *The Early Warning System and Related Take Over Bids and Insider Reporting Issues* in connection with the filing of an early warning report by George Barakat in respect of the disposition of common shares (each, a “**Common Share**“) in the capital of Jack Nathan Medical Corp. (the “**Issuer**“) (TSXV:JNH.V).
George Barakat announces that, during the period between August 3, 2022 and October 27, 2022, he, directly or indirectly, sold an aggregate of 1,578,500 Common Shares beneficially owned by him, or over which he had control or direction, over the facilities of the TSX Venture Exchange at an average price per Common Share of $0.1097, for total consideration of approximately $173,133.35.
Following the sales referred to above, Mr. Barakat beneficially owns or, through GKAT Inc., exercises control or direction over, 13,413,180 Common Shares and options to acquire an additional 700,000 Common Shares (the “**Options**“), representing approximately 15.97% of the issued and outstanding Common Shares on a non-diluted basis and representing approximately 16.66% of the issued and outstanding Common Shares, assuming the full exercise of all of the Options that Mr. Barakat beneficially owns or exercises control or direction over.
Immediately prior to the completion of the sales referred to above, Mr. Barakat beneficially Owned, or exercised control or direction over, 14,991,680 Common Shares and 700,000 Options, representing approximately 17.86% of the issued and outstanding Common Shares on a non-diluted basis and representing approximately 18.54% of the issued and outstanding Common Shares, assuming the full exercise of all of the Options that Mr. Barakat beneficially owns or exercises control or direction over.
As previously announced on June 30, 2022, Mr. Barakat intends to, from time to time, dispose of Common Shares beneficially owned by him, or over which he has control or direction, including the Common Shares held by GKAT Inc., in order to meet his liquidity needs from time to time.
**Categories:** Finance
---
### [Digicel Enters Binding Agreement to Sell Pacific Operations to Telstra](https://df.media/digicel-enters-binding-agreement-to-sell-pacific-operations-to-telstra/)
**Published:** July 27, 2023
**Author:** Daily Finance
**Content:**
KINGSTON, Jamaica, Oct. 24, 2021 /PRNewswire/ — Digicel Group Holdings Limited (“DGHL”) is pleased to announce it has entered into an agreement to sell Digicel Pacific Limited (“DPL”), its wholly-owned subsidiary, to a subsidiary of the Australian telecommunications company Telstra Corporation Limited, valuing DPL at up to US$ 1.85 billion, inclusive of a three year, US$ 250 million earn-out and subject to customary post-closing adjustments. The transaction, which remains subject to customary government and regulatory approvals, is expected to complete in the first quarter of 2022.
DPL operates in six markets in the South Pacific including Papua New Guinea, Fiji, Samoa, Vanuatu, Tonga and Nauru. It recorded sales of approximately US$450 million and adjusted earnings before interest, tax, depreciation and amortisation (‘Adjusted EBITDA’) of approximately US$ 222\[1\] million in the year ended March 31, 2021.
On completion Digicel will have no operational responsibility for the Pacific operations though customary transition services will be provided by DGHL for a short period. There will be no change to the Digicel brand in the six markets and the current DPL management team will remain with and continue to lead the business delivering best in class telecommunications services to DPL’s valued customers in the South Pacific. To facilitate a seamless transition, Denis O’Brien will join the Board of Directors of the newly formed holding company for DPL.
Commenting, Denis O’Brien, Digicel Founder and Chairman said: “Today’s announcement is a tremendous testament to our colleagues across Digicel Group and in particular, our 1,700 staff in the Pacific. In 2006, we established a business in the South Pacific region that has helped democratise mobile communications and transform local economies and societies by making affordable best-in-class communications available to more than 10 million people across six of the most exciting markets in the South Pacific region.
“I am very pleased that today’s agreement with Telstra, our very near neighbour in the Pacific, will further enhance DPL’s infrastructure, data and call termination links with one of the largest and most reliable networks in Australia. I thank all of our colleagues in the South Pacific and beyond who have made today possible and I remain committed to ensuring a successful transition in my ongoing role as a director of the newly formed holding company for DPL.
“From a Digicel perspective, today marks a very successful realisation of a strategic investment following our entry in the South Pacific in 2006,” Mr O’Brien added.
**For Reference:**
| Antonia Graham | Pat Walsh |
|---|---|
| Head of Group Communications, Digicel | Murray Group |
| T: +1 876.564.1708 (Jamaica) | T: +353.87.2269345 |
| | |
**About Digicel**
As a Digital Operator, Digicel is in the business of delivering powerful digital experiences 1440 minutes of each day to customers – that’s every minute, all day, every day.
Through its world-class LTE and fibre networks, together with its suite of 8 apps spanning sports (SportsMax), music (D’Music), news (Loop), local radio and podcasts (GoLoud), TV streaming (PlayGo), enhanced messaging and marketplaces (BiP), cloud storage (Billo) and self-care (MyDigicel app), Digicel is the only operator in its markets that can deliver that.
Serving consumer and business customers in 32 markets in the Caribbean, Central America and Pacific, its investments of over US$7 billion and a commitment to its communities through its Digicel Foundations in Haiti, Jamaica, Papua New Guinea and Trinidad & Tobago have contributed to positive outcomes for over 3 million people to date.
With its Better Together brand, Digicel is making a promise of simply more to customers and communities and its 7,000 employees worldwide work together to make that a powerful reality day in, day out.
**Forward-Looking Statements**
This release contains forward-looking statements within the meaning of the federal securities laws of the United States. Certain other jurisdictions may have analogous concepts. Such forward-looking statements reflect, among other things, management’s current expectations, plans and strategies, and anticipated financial results, all of which are subject to known and unknown risks, uncertainties and factors that may cause our actual results to differ materially from those expressed or implied by these forward-looking statements. Many of these risks are beyond our ability to control or predict.
Because of these risks, uncertainties and assumptions, you should not place undue reliance on these forward-looking statements. Furthermore, forward-looking statements speak only as of the date they are made. We do not undertake any obligation to update or review any such forward-looking information, whether as a result of new information, future events or otherwise.
**Other disclosure**
Our debt securities are not registered with the SEC or any other securities regulator and are not listed with any exchange. We have no intention of registering the securities in the United States or listing them with any exchange.
Certain figures in this release, including financial data, are rounded. Accordingly, corresponding calculated figures, including totals and percentage changes, may not be an exact arithmetic presentation of the corresponding figures.
**Regulation G**
This release contains non-GAAP financial measures as defined by Regulation G of the rules of the Securities and Exchange Commission.
\[1\] Financial information presented on an as-reported basis. FY21 Adjusted EBITDA excluding group recharges and other costs was US$233m.
**Categories:** Finance, Global News
---
### [DEADLINE: Celsius Holdings, Inc. Investors with Substantial Losses Have Opportunity to Lead Class Action Lawsuit – CELH](https://df.media/deadline-celsius-holdings-inc-investors-with-substantial-losses-have-opportunity-to-lead-class-action-lawsuit-celh/)
**Published:** July 27, 2023
**Author:** Daily Finance
**Content:**
SAN DIEGO, March 19, 2022 /PRNewswire/ — The law firm of **Robbins Geller Rudman & Dowd LLP** announces that purchasers of Celsius Holdings, Inc. (NASDAQ: CELH) securities between August 12, 2021 and March 1, 2022, inclusive (the “Class Period”) have until May 16, 2022 to seek appointment as lead plaintiff in *McCallion v. Celsius Holdings, Inc.*, No. 22-cv-80418 (S.D. Fla.). Commenced on March 16, 2022, the *Celsius* class action lawsuit charges Celsius and certain of its top executive officers with violations of the Securities Exchange Act of 1934.
**CASE ALLEGATIONS**: Celsius develops, markets, and sells functional drinks and liquid supplements. Celsius’ core offerings include pre- and post-workout functional energy drinks and protein bars.
The *Celsius* class action lawsuit alleges that, throughout the Class Period, defendants made false and misleading statements and failed to disclose that: (i) Celsius had improperly recorded expenses for non-cash share-based compensation for the second and third quarters of 2021; (ii) as a result, Celsius’ financial statements for those periods would be restated, including to report a net loss for the third quarter of 2021; (iii) there was a material weakness in Celsius’ internal controls over financial reporting; and (iv) consequently, defendants’ positive statements about Celsius’ business, operations, and prospects were materially misleading and/or lacked a reasonable basis.
On March 1, 2022, Celsius disclosed that it could not timely file its 2021 annual report due to “staffing limitations, unanticipated delays and identified material errors in previous filings.” Specifically, Celsius “determined that the calculation and expense of non-cash share-based compensation, related to grants of stock options and restricted stock units awarded to certain former employees and retired directors were materially understated for the three and six month periods ended June 30, 2021 and three and nine month periods ended September 30, 2021.” As a result, management concluded that there was a material weakness in Celsius’ internal controls over financial reporting. On this news, Celsius’ stock price fell more than 8%, damaging investors.
**THE LEAD PLAINTIFF PROCESS**: The Private Securities Litigation Reform Act of 1995 permits any investor who purchased Celsius securities during the Class Period to seek appointment as lead plaintiff in the *Celsius* class action lawsuit. A lead plaintiff is generally the movant with the greatest financial interest in the relief sought by the putative class who is also typical and adequate of the putative class. A lead plaintiff acts on behalf of all other class members in directing the class action lawsuit. The lead plaintiff can select a law firm of its choice to litigate the class action lawsuit. An investor’s ability to share in any potential future recovery of the class action lawsuit is not dependent upon serving as lead plaintiff.
**ABOUT ROBBINS GELLER RUDMAN & DOWD LLP**: Robbins Geller Rudman & Dowd LLP is one of the world’s leading complex class action firms representing plaintiffs in securities fraud cases. The Firm is ranked #1 on the 2021 ISS Securities Class Action Services Top 50 Report for recovering nearly $2 billion for investors last year alone – more than triple the amount recovered by any other plaintiffs’ firm. With 200 lawyers in 9 offices, Robbins Geller’s attorneys have obtained many of the largest securities class action recoveries in history, including the largest securities class action recovery ever – $7.2 billion – in *In re Enron Corp. Sec. Litig.*
**Categories:** Finance
---
### [DEADLINE APPROACHING: Investors in Telefonaktiebolaget LM Ericsson with Substantial Losses Have Opportunity to Lead Class Action Lawsuit – ERIC](https://df.media/deadline-approaching-investors-in-telefonaktiebolaget-lm-ericsson-with-substantial-losses-have-opportunity-to-lead-class-action-lawsuit-eric/)
**Published:** July 27, 2023
**Author:** Daily Finance
**Content:**
SAN DIEGO, March 19, 2022 /PRNewswire/ — The law firm of **Robbins Geller Rudman & Dowd LLP** announces that purchasers or acquirers of Telefonaktiebolaget LM Ericsson (NASDAQ: ERIC) securities between April 27, 2017 and February 25, 2022, both dates inclusive (the “Class Period”) have until May 2, 2022 to seek appointment as lead plaintiff in *Nyy v. Telefonaktiebolaget LM Ericsson*, No. 22-cv-01167 (E.D.N.Y.). Commenced on March 3, 2022 and assigned to Judge William F. Kuntz, II, the *Ericsson* class action lawsuit charges Ericsson and certain of its top executive officers with violations of the Securities Exchange Act of 1934.
**CASE ALLEGATIONS**: Ericsson, together with its subsidiaries, provides communication infrastructure, services, and software solutions to the telecommunications and other sectors. Ericsson operates in, among other countries, the Republic of Iraq.
The *Ericsson* class action lawsuit alleges that, throughout the Class Period, defendants made false and misleading statements and failed to disclose that: (i) Ericsson overstated the extent to which it had reformed its business practices to eliminate the use of bribes to secure business in foreign countries; (ii) Ericsson had paid bribes to the terrorist group the Islamic State in Iraq and Syria (“ISIS” or the “Islamic State”) to gain access to certain transport routes in Iraq; (iii) accordingly, Ericsson’s revenues derived from its operations in Iraq were, in at least substantial part, derived from unlawful conduct and thus unsustainable; and (iv) as a result, Ericsson’s public statements were materially false and misleading at all relevant times.
On February 16, 2022, Ericsson’s CEO told a Swedish newspaper that Ericsson may have made payments to ISIS to gain access to certain transport routes in Iraq, noting that Ericsson had identified “unusual expenses dating back to 2018” but had not yet determined the final recipient of the funds for those expenses, although defendants could “see that it disappeared,” and that Ericsson has spent “considerable resources trying to understand this as best we can.” On this news, Ericsson’s American Depositary Share (“ADS”) price fell by more than 11%.
Then, on February 27, 2022, the International Consortium of Investigative Journalists (“ICIJ”) published a report on Ericsson’s alleged dealings with ISIS in Iraq, citing a leaked internal investigation that revealed that Ericsson had reportedly made “tens of millions of dollars in suspicious payments” over nearly a decade to keep its business in the country. The ICIJ report also alleged that “a spreadsheet lists company probes into possible bribery, money laundering and embezzlement by employees in Angola, Azerbaijan, Bahrain, Brazil, China, Croatia, Libya, Morocco, the United States and South Africa,” which “have not been previously disclosed.” On this news, Ericsson’s ADS price fell an additional 8.3%, further damaging investors.
**THE LEAD PLAINTIFF PROCESS**: The Private Securities Litigation Reform Act of 1995 permits any investor who purchased Ericsson securities during the Class Period to seek appointment as lead plaintiff in the *Ericsson* class action lawsuit. A lead plaintiff is generally the movant with the greatest financial interest in the relief sought by the putative class who is also typical and adequate of the putative class. A lead plaintiff acts on behalf of all other class members in directing the class action lawsuit. The lead plaintiff can select a law firm of its choice to litigate the class action lawsuit. An investor’s ability to share in any potential future recovery of the class action lawsuit is not dependent upon serving as lead plaintiff.
**ABOUT ROBBINS GELLER RUDMAN & DOWD LLP**: Robbins Geller Rudman & Dowd LLP is one of the world’s leading complex class action firms representing plaintiffs in securities fraud cases. The Firm is ranked #1 on the 2021 ISS Securities Class Action Services Top 50 Report for recovering nearly $2 billion for investors last year alone – more than triple the amount recovered by any other plaintiffs’ firm. With 200 lawyers in 9 offices, Robbins Geller’s attorneys have obtained many of the largest securities class action recoveries in history, including the largest securities class action recovery ever – $7.2 billion – in *In re Enron Corp. Sec. Litig.*
**Categories:** Finance, Global News
---
### [DEADLINE ALERT: Kessler Topaz Meltzer & Check, LLP Announces Deadline in Paysafe Limited f/k/a Foley Trasimene Acquisition Corp. II Securities Fraud Class Action Lawsuit](https://df.media/deadline-alert-kessler-topaz-meltzer-check-llp-announces-deadline-in-paysafe-limited-f-k-a-foley-trasimene-acquisition-corp-ii-securities-fraud-class-action-lawsuit/)
**Published:** July 27, 2023
**Author:** Daily Finance
**Content:**
RADNOR, Pa., Feb. 6, 2022 /PRNewswire/ — The law firm of Kessler Topaz Meltzer & Check, LLP informs investors that a securities class action lawsuit has been filed against Paysafe Limited (“Paysafe”) (NYSE: PSFE) f/k/a Foley Trasimene Acquisition Corp. II (“FTAC”) (NYSE: BFT). The action charges Paysafe with violations of the federal securities laws, including omissions and fraudulent misrepresentations relating to the company’s business, operations, and prospects. As a result of Paysafe’s materially misleading statements to the public, Paysafe investors have suffered significant losses.
**PAYSAFE’S MISCONDUCT** Paysafe, a Bermudian company with principal executive offices in Hamilton, Bermuda, provides end-to-end payment solutions through three primary business segments: Integrated Processing, Digital Wallet and eCash Solutions.
The Class Period commences on December 7, 2020, when FTAC announced that it had entered into a definitive agreement and plan of merger with Paysafe Group Holdings Limited. In connection with this announcement, the defendants represented that the transaction would position Paysafe for strong, accelerated growth. Thereafter, and throughout the Class Period, the defendants repeatedly assured investors that Paysafe was executing well against its strategy and was positioned for strong growth throughout 2021.
Investors began to learn the truth about Paysafe on August 16, 2021, when Paysafe announced its financial results for the second–quarter of 2021 and provided disappointing guidance for the third quarter of 2021. Specifically, the defendants projected third quarter revenue of between $360 million and $375 million—well below analysts’ estimate of $389 million. The defendants attributed this weak guidance to challenges in Paysafe’s Digital Wallet segment, including “some softness in the . . . online gambling space” in European markets.
Nonetheless, Defendants assured investors that the company would rebound in the fourth–quarter of 2021, stating that “Q4 is . . . where you start seeing a double-digit growth in Digital Wallet’s revenue,” and reiterating that despite a weak third quarter, the company still expected full-year 2021 revenue of between $1.53 billion and $1.55 billion due to strong fourth quarter expected results.
Following this news, the price of Paysafe common stock declined $1.58 per share, or more than 15%, from a close of $10.20 per share on August 13, 2021, to close at $8.62 per share on August 16, 2021.
Then, on November 11, 2021, Paysafe announced its third–quarter 2021 financial results—including below-guidance quarterly revenue of $353.6 million—and lowered its full-year 2021 guidance for revenue and other financial metrics. Specifically, the defendants revealed that, due to “\[g\]ambling regulations and softness in key European markets and performance challenges impacting the Digital Wallet segment,” as well as “modified scope and timing of new eCommerce customer agreements relative to \[Paysafe\]’s original expectations for these agreement,” they now expected full-year 2021 revenue of between $1.47 billion and $1.48 billion. Additionally, the defendants provided disappointing guidance for the fourth quarter of 2021, projecting quarterly revenue of between $355 million and $385 million.
Following this news, the price of Paysafe common stock declined $3.03 per share, or more than 41%, from a close of $7.27 per share on November 10, 2021, to close at $4.24 per share on November 11, 2021.
The *O’Brien* Action alleges that, throughout the Class Period, the defendants misrepresented and/or failed to disclose that: (1) Paysafe was being negatively impacted by gambling regulations in key European markets; (2) Paysafe was encountering performance challenges in its Digital Wallet segment; (3) new eCommerce customer agreements were being pushed back; and (4) as a result, the defendants’ statements about Paysafe’s business, operations, and prospects lacked a reasonable basis.
**WHAT CAN I DO?** Paysafe investors may, ***no later than February 8, 2022***, seek to be appointed as a lead plaintiff representative of the class through Kessler Topaz Meltzer & Check, LLP or other counsel, or may choose to do nothing and remain an absent class member. Kessler Topaz Meltzer & Check, LLP encourages Paysafe investors who have suffered significant losses to contact the firm directly to acquire more information.
**WHO CAN BE A LEAD PLAINTIFF?** A lead plaintiff is a representative party who acts on behalf of all class members in directing the litigation. The lead plaintiff is usually the investor or small group of investors who have the largest financial interest and who are also adequate and typical of the proposed class of investors. The lead plaintiff selects counsel to represent the lead plaintiff and the class and these attorneys, if approved by the court, are lead or class counsel. Your ability to share in any recovery is not affected by the decision of whether or not to serve as a lead plaintiff.
**ABOUT KESSLER TOPAZ MELTZER & CHECK, LLP** Kessler Topaz Meltzer & Check, LLP prosecutes class actions in state and federal courts throughout the country and around the world. The firm has developed a global reputation for excellence and has recovered billions of dollars for victims of fraud and other corporate misconduct. All of our work is driven by a common goal: to protect investors, consumers, employees and others from fraud, abuse, misconduct and negligence by businesses and fiduciaries. At the end of the day, we have succeeded if the bad guys pay up, and if you recover your assets. The complaint in this action was not filed by Kessler Topaz Meltzer & Check, LLP.
**Categories:** Finance, Global News
---
### [CU INC. ELIGIBLE DIVIDENDS](https://df.media/cu-inc-eligible-dividends/)
**Published:** July 27, 2023
**Author:** Daily Finance
**Content:**
CALGARY, AB, April 14, 2022 /CNW/ – **CU Inc.** (TSX: CIU.PR.A) (TSX: CIU.PR.C)
The Board of Directors of CU Inc. has declared the following Cumulative Redeemable Preferred Share dividends:
| **Shares** | **TSX StockSymbol** | **DividendPer Share ($)** | **Record Date(2022)** | **Payment Date(2022)** |
|---|---|---|---|---|
| Series 1 4.60% | CIU.PR.A | 0.28750 | 05-May | 01-Jun |
| Series 4 2.292% | CIU.PR.C | 0.14325 | 05-May | 01-Jun |
These dividends are eligible dividends within the meaning of the Income Tax Act (Canada).
**CU Inc. is a wholly-owned subsidiary of Canadian Utilities Limited, an ATCO Company. CU Inc. is an Alberta-based corporation with approximately 3,200 employees and assets of $18 billion; comprised of rate regulated utility operations in pipelines, natural gas and electricity transmission and distribution.**
***Forward-Looking Information:***
*Certain statements contained in this news release may constitute forward-looking information. Forward-looking information is often, but not always, identified by the use of words such as “anticipate”, “plan”, “estimate”, “expect”, “may”, “will”, “intend”, “should”, and similar expressions.*
*Forward-looking information involves known and unknown risks, uncertainties and other factors that may cause actual results or events to differ materially from those anticipated in such forward-looking information.*
*The Company’s actual results could differ materially from those anticipated in this forward-looking information as a result of regulatory decisions, competitive factors in the industries in which the Company operates, prevailing economic conditions (including as may be affected by the COVID-19 pandemic), and other factors, many of which are beyond the control of the Company.*
*The Company believes that the expectations reflected in the forward-looking information are reasonable, but no assurance can be given that these expectations will prove to be correct and such forward-looking information should not be unduly relied upon.*
*Any forward-looking information contained in this news release represents the Company’s expectations as of the date hereof and is subject to change after such date. The Company disclaims any intention or obligation to update or revise any forward-looking information whether as a result of new information, future events or otherwise, except as required by applicable securities legislation.*
**Categories:** Finance
---
### [CSI Companies Named A Finalist In 2023 Stevie® Awards for Sales & Customer Service](https://df.media/csi-companies-named-a-finalist-in-2023-stevie-awards-for-sales-customer-service/)
**Published:** July 27, 2023
**Author:** Daily Finance
**Content:**
The national workforce solutions company gains recognition in the Sales Growth Achievement of the Year category.
JACKSONVILLE, Fla., Feb. 11, 2023 /PRNewswire-PRWeb/ — CSI Companies was named a Finalist in the Sales Growth Achievement of the Year category in the 17th annual Stevie® Awards for Sales & Customer Service. More than 2,300 nominations from across a diverse range of industries were evaluated in this year’s competition. Finalists were determined by the average scores of 170 professionals worldwide.
The Sales Growth Achievement of the Year category recognizes organizations for their improvements in sales since the beginning of July 2020. Over the last few years, CSI Companies has undergone drastic development in offering full-cycle business solutions to leading businesses across the nation.
“The rapid growth CSI has experienced in the last few years is the direct result of a strategic approach borne in response to the pandemic,” said CSI’s CFO Josh Bowling. “We refined our services and expanded our reach within healthcare to help our clients navigate labor supply and demand. This is a major step in our evolution to a more extensive workforce solutions-based company that will favorably position us for future growth.”
The Gold, Silver, and Bronze Stevie placements from among the Finalists will be revealed during a gala banquet on Friday, March 3 at Caesars Palace in Las Vegas, Nevada.
About CSI Companies
CSI Companies has been a nationally recognized organization for nearly three decades, providing customized workforce solutions for leading businesses and Fortune 500 companies. By delivering strategic advisory, staffing, recruiting, and technology consulting services, CSI enables a diverse range of businesses to maximize their productivity and overall success.
About The Stevie Awards
Stevie Awards are conferred in eight programs: the Asia-Pacific Stevie Awards, the German Stevie Awards, the Middle East & North Africa Stevie Awards, The American Business Awards®, The International Business Awards®, the Stevie Awards for Great Employers, the Stevie Awards for Women in Business, and the Stevie Awards for Sales & Customer Service. Stevie Awards competitions receive more than 12,000 entries each year from organizations in more than 70 nations. Honoring organizations of all types and sizes and the people behind them, the Stevies recognize outstanding performances in the workplace worldwide.
**Categories:** Global News
---
### [Coway Earns Three Honors at the Good Design Awards 2022](https://df.media/coway-earns-three-honors-at-the-good-design-awards-2022/)
**Published:** July 27, 2023
**Author:** Daily Finance
**Content:**
SEOUL, South Korea, Oct. 9, 2022 /PRNewswire/ — Coway Co., Ltd., “The Best Life Solution Company,” was named a “Winner” for three home appliance products at the Good Design Award 2022.
[](https://web.archive.org/web/20221009213014/https://mma.prnewswire.com/media/1916006/Image__Coway_Air_Purifier__AP_3522E__AP_3522F.html)
The Good Design Awards, hosted by the Japan Institute of Design Promotion (JDP), is one of the most prestigious international design competitions, alongside the iF Design Award, Red Dot Design Award, and IDEA.
This marks the 16th consecutive year for Coway to win at the Good Design Awards and completes the company’s grand slam of the world’s four most honored design awards for 2022.
2022’s award-winning products are the ‘Icon Ice Water Purifier (CHPI-7400N),’ ‘NOBLE Humidifier (AM-1421G),’ and the air purifier ‘Airmega ProX (AP-3522E/F)’. They have been recognized for their innovative technology and intuitive designs.
The Icon Ice Water Purifier (CHPI-7400N) is the smallest ice water purifier to come out of South Korea, with a compact size, sleek design, and simple visual elements. It features the company’s proprietary Dual Speed Ice-making technology, which ensures a quick and abundant supply of ice, and a UV sterilization system for product hygiene.
The NOBLE Humidifier (AM-1421G) is from the iconic ‘NOBLE Air Care Solution Series’ that has won multiple awards for its premium architecture-inspired design. The model is an evaporative humidifier that features an innovative host of technologies. Its Air Heating System increases humidification, and Coway’s patented Water-lock™ technology stops water from stagnating in the reservoir to prevent filter contamination.
The Airmega ProX (AP-3522E/F) is an air purifier suitable for large spaces with a geometric design and simple straight structure that harmoniously blends into any place. The eco-friendly ABS plastic is a nod toward the company’s sustainability commitments.
The expected US launch for the Airmega ProX is H1 2023 and that for the Icon Ice Water Purifier is 2024.
“We are focusing on product design and technologies that make our customers’ daily experiences healthier and more convenient,” said Hyun Joo Song, head of the Design Center at Coway. “We will continue to design products that align with how our customers live and embody our signature geometric design identity.”
***About Coway Co., Ltd.***
Established in Korea in 1989, Coway, “The Best Life Solution Company,” is a leading environmental home appliances company making people’s lives healthy and comfortable with innovative home appliances such as water purifiers, air purifiers, bidets, and mattresses. Since being founded, Coway has become a leader in the environmental home appliances industry, with intensive research, engineering, development, and customer service. The company has proven dedication to innovation with award-winning products, home health expertise, unrivaled market share, customer satisfaction, and brand recognition. Coway continues to innovate by diversifying product lines and accelerating overseas business in Malaysia, USA, Thailand, China, Indonesia, Vietnam, Japan, and Europe, based on the business success in Korea.
**Categories:** Business, Global News
---
### [Cryptocurrency 101: What Is Algo?](https://df.media/cryptocurrency-101-what-is-algo/)
**Published:** July 27, 2023
**Author:** Daily Finance
**Content:**
Cryptocurrency has taken the world by storm over the past few years, with international attention turning to the likes of Bitcoin, Dogecoin, and so forth. Many large businesses and corporations have made movies to integrate cryptocurrency into their working model.
With the rise of crypto, there have been a number of types of cryptocurrency that have also come to popularity. The Algo token is one such form. What is Algo and what do you need to understand about it?
There’s a lot to learn about this new and exciting form of crypto. You’ll want to understand the ins and outs of the Algorand blockchain before investing, and we’ve laid out all the details for you. Read on and we’ll walk you through what you need to know.
## What Is Algo?
Algo is a form of cryptocurrency that was invented as a solution to a number of problems users had with existing forms of cryptocurrency.
The benefit of the Algo is that it is a form of cryptocurrency that has no oversight in terms of its transfer. You can move digital money from your wallet to another’s instantly, with no need for processing time. There are also no transaction fees or other limitations, giving users the freedom to trade with none of the oversight associated with paper currency and many other digital currencies.
The Algo blockchain is one of the fastest, most secure, and most expansive in the world. While Algo is similar to Bitcoin in many ways, many find that it is even more of a stable and worthy investment.
The value of an Algo token is still on the rise and it is easy to get started investing in this form of crypto.
## Algo Benefits
It’s no secret that there are a lot of different kinds of cryptocurrencies out there in the world. Algo came around in 2017, and the blockchain was created by professors at MIT who were attempting to perfect the transactional elements of the blockchain system.
The main reason to go with Algo over other forms of cryptocurrency is that it is the easiest platform to trade on. Transaction speeds on the Algo blockchain are down to as low as a few seconds.
Those kinds of instantaneous speeds are hard to beat and are not found with other forms of cryptocurrency. The Algo blockchain is ideal for trading and buying digital products such as NFTs.
## Understanding Algo Trading
If you’re worried about how to handle your future crypto matters, it might be well worth looking into the Algo blockchain. What is Algo? The above information should cover all the basics that you need to get familiar with.
**Categories:** Cryptocurrency
---
### [COSMOPROF NORTH AMERICA REGISTRATION NOW OPEN!](https://df.media/cosmoprof-north-america-registration-now-open/)
**Published:** July 27, 2023
**Author:** Daily Finance
**Content:**
The 19th annual leading B2B Beauty Trade Show in the Americas opens its doors at the newly renovated Las Vegas Convention Center with a new show format!
LAS VEGAS, April 12, 2022 /PRNewswire/ **—** **Cosmoprof North America** (CPNA), the largest B2B beauty exhibition in the Americas, will host its 19th edition **July 12th – 14th** at the **Las Vegas Convention Center (LVCC) in Las Vegas, NV, and is open for registration.** As the world gets back to business, the beauty industry continues to adapt and advance to support the newfound optimism and opportunities for growth in the US. **Cosmoprof NA,** the most important beauty industry networking opportunity in the US, is excited to once again open its doors and provide attendees with an exhilarating show experience to learn and share the most important new developments in the industry.
**“Cosmoprof North America** is excited to continue its tradition of hosting a powerful, world class platform for domestic and international retailers, distributors, beauty brands and suppliers to network, share their visionary ideas and foster relationships in an exceptional new arena, now held in a convenient mid-week format,” said **Enrico Zannini, General Manager of BolognaFiere Cosmoprof**. “The newly designed **Two-Hall** **format** will provide attendees with an increased focus on their specific needs to make the most of their time at the show, as well as newly designed features to ignite inspiration.”
“Cosmoprof North America continues to be a driver for growth, innovation, trends, and thought leadership in the beauty industry,” shares **Nina Daily, Executive Director of the Professional Beauty Association**. “Reconnection with partners and creating new relationships is more important than ever, and we are confident the new format and venue will lead to a successful Cosmoprof North America 2022 and allow attendees to facilitate valuable connections.”
The award-winning event has now moved from Sunday – Tuesday, to **Tuesday – Thursday** and introducing a **NEW** **two hall format.**
For the first time, **Cosmopack North America**, the only event in the Americas fully dedicated to the entire beauty supply chain, will have its own dedicated North Hall. At Cosmopack, buyers can discover innovative ingredients, raw materials, packaging, cutting-edge components, technological advances and more to take brands from concept to creation. Having its own location will make it easier to find supply chain solutions. Also featured is a dedicated Cosmopack Buyer Lounge, special activations, and on the floor education complimentary to exhibitors and attendees. Dedicated to finished products, **The** **Cosmoprof North America** **West Hall** will feature four macro sectors including Hair Care, Skin Care & Makeup, Nails, and Natural Products. Country Pavilions will showcase authentic elements and innovations from countries recognized for their strong heritage in beauty.
CPNA is excited to share new 2022 initiatives:
**Discover Black-Owned Beauty**: This personalized curated display area is specially created for Black-owned beauty brands seeking access to market opportunities, educational resources, retail distribution, and brand exposure. Curators Adrienne Mason and Maria Torres created the Beauty International Group with the intention to ensure Black-owned beauty brands have access to investment capital, retail distribution, logistics, and valuable industry know-how. This area facilitates retailers’ commitment to the “fifteen percent pledge,” which asks businesses to dedicate 15% of their shelf space to Black-owned brands.
For the first time, the **Entrepreneur Academy** will be hosted in partnership with the Fashion Institute of Technology’s Cosmetics & Fragrance Marketing and Management Master’s Program. The one-day intensive hands-on practical workshop provides beauty entrepreneurs with tools to help them build a brand, manage financials, and more. Participants will now receive an FIT noncredit certification.
Returning this year are special areas dedicated to curated exhibitors including Discover Beauty, Discover Beauty Spotlights, Discover Green, and The Beauty Vanities. Also returning are **CPNA** special projects including Boutique, a one-of-a-kind beauty sampling bar, the Buyer Program, which encourages networking between exhibitors and top buyers, Cosmoprof & Cosmopack North America Awards, CosmoTrends, Mentorship Program, and Press Zone. CosmoTalks’ wide-ranging seminars and workshops that combine creativity, inspiration and business will be hosted by powerhouses such as NPD, FIT, Spate, Insider’s Guide to Spas, and BEAUTYSTREAMS, amongst others. With more than 20 seminars and workshops, it aims to be the widest ranging series of conferences and in-depth talks in the beauty industry.
**Organizer:** Cosmoprof North America is organized by North American Beauty Events LLC, a joint-venture company between BolognaFiere Group and the Professional Beauty Association.
**BolognaFiere Group**, the world’s leading trade show organizer in the cosmetics, fashion, architecture, building, art and culture sectors, features in its portfolio more than 80 exhibitions, both domestic and international. BolognaFiere Cosmoprof S.p.a., a company of BolognaFiere Group, is the organizer of Cosmoprof, an international platform, with events in Bologna (established 1967), Hong Kong (established 1996) and Las Vegas (established 2003).
**The Professional Beauty Association (PBA)** is the largest and most inclusive trade organization representing the entire beauty industry. PBA exists to elevate, unite and serve the beauty industry and the professionals who improve people’s lives and is the only national organization to represent the entire beauty industry. PBA is dedicated to advocating and fighting for the rights of the beauty industry, enhancing professionalism, and committed to the long-term success of the stylist and the businesses that employ and support them.
**Categories:** Global News
---
### [Converge Technology Solutions Corp. Completes Acquisition of Vicom Infinity and Infinity Systems Software](https://df.media/converge-technology-solutions-corp-completes-acquisition-of-vicom-infinity-and-infinity-systems-software-2/)
**Published:** July 27, 2023
**Author:** Daily Finance
**Content:**
*Vicom Infinity and Infinity Systems Software join Converge Company as part of Converge’s portfolio of companies.*
TORONTO and GATINEAU, QC, Aug. 31, 2021 /PRNewswire/ – Converge Technology Solutions Corp. (“**Converge**” or “the **Company**“) (TSX: CTS) (FSE: 0ZB) (OTCQX: CTSDF) a software-enabled IT & Cloud Solutions provider, is pleased to announcethe closing of its previously announced acquisitionof Vicom Infinity and Infinity Systems Software.
Vicom Infinity, a world-class IBM mainframe solutions provider, focuses on their philosophy of combining proven IT technology with the infinite possibilities of innovative thinking to transform IT functionality. Vicom Infinity’s products and uncompromising service have helped clients successfully transform their IT enterprise systems.
Infinity Systems Software has been a leading supplier of software and services for IBM platforms for more than 20 years. Sister company to Vicom Infinity, Infinity Systems Software is proficient in IBM mainframe and offers a wide range of services including IT consulting, applications development, managed services, legacy modernization, disaster recovery, and customization.
Vicom Infinity and Infinity Systems Software marks the twenty-second and twenty-third acquisitions completed by Converge since October 2017. Converge’s family of companies also includes Corus Group, LLC; Northern Micro, Inc.; 10084182 Canada Inc. operating as Becker-Carroll; Key Information Systems, Inc.; BlueChip Tek, Inc.; Lighthouse Computer Systems, Inc.; Software Information Systems LLC.; Nordisk Systems, Inc.; Essex Technology Group, Inc.; Datatrend Technologies, Inc.; VSS, LLC; Solutions PCD, Inc.; Unique Digital, Inc.; Workgroup Connections, Inc.; Vivvo Application Studios LTD.; Vicom Computer Services, Inc.; CarpeDatum LLC; Accudata Systems, Inc.; Dasher Technologies, Inc.; ExactlyIT, Inc.; and REDNET AG.
**About Converge** Converge Technology Solutions Corp. is a software-enabled IT & Cloud Solutions provider focused on delivering industry-leading solutions and services. Converge’s regional sales and services organizations deliver advanced analytics, cloud, and cybersecurity offerings to clients across various industries. The Company supports these solutions with managed services, digital infrastructure, and talent expertise offerings across all major IT vendors in the marketplace. This multi-faceted approach enables Converge to address the unique business and technology requirements for all clients in the public and private sectors.
**About Vicom Infinity & Infinity Systems Software** Vicom Infinity provides processing solutions for high-availability environments to ensure seamless IT transformation development. Vicom Infinity architects, implements, and supports customized solutions that fit the unique needs of each specific client and are widely known for their expertise in optimizing legacy investments while introducing new technologies and capabilities. Infinity Systems Software, sister company to Vicom Infinity, has been a leading software supplier and services provider for IBM platforms for more than 20 years. Infinity Systems Software is highly skilled in IBM mainframe environments, from legacy systems to IBM’s sophisticated System z mainframes, including Linux-based platforms.
Together, Vicom Infinity and Infinity Systems Software bring a wealth of experience and expertise in IBM data center environments. By combining technology tools and business objectives, both organizations jointly deliver unique insight into IBM’s technology roadmap and help clients find the right strategy to achieve business success.
**Categories:** Global News
---
### [Cooperation zones facilitate development across the Guangdong-Hong Kong-Macao Greater Bay Area](https://df.media/cooperation-zones-facilitate-development-across-the-guangdong-hong-kong-macao-greater-bay-area/)
**Published:** July 27, 2023
**Author:** Daily Finance
**Content:**
BEIJING, Oct. 1, 2021 /PRNewswire/ — This is a news report from Beijing Review:
[](https://web.archive.org/web/20221126145728/https://mma.prnewswire.com/media/1639464/An_e_commerce_entrepreneur_Macao_introduces_wine_sold_company_exhibition_Guangzhou.html)
During his days working for the local government and an accounting firm in his hometown of Hong Kong, Lo Yuenlai cherished an entirely different professional dream–to work in the field of technology and innovation. After learning about the possibilities opening up in Shenzhen, Guangdong Province, the young man decided to give it a go.
“Compared with Hong Kong, the mainland features a larger space with diverse industries that can broaden my horizon. That’s what attracted me most,” the 25-year-old told Beijing Review.
He has been working in Shenzhen for almost two years now, at a hi-tech company focusing on machine vision in the Shenzhen-Hong Kong Youth Innovation and Entrepreneur Hub (E Hub) located in Qianhai, just across a bay from Hong Kong Special Administrative Region (SAR).
E Hub-based businesses can enjoy a rent discount and other subsidies from both the Shenzhen government and the hub’s authority, Lo explained. Four years after settling there, BMTek, where Lo works, has gone through a growth spurt. Its staff has grown from a mere seven members to more than 100.
E Hub is part of a plan for advancing the reform and opening up of the Qianhai Shenzhen-Hong Kong Modern Service Industry Cooperation Zone issued by China’s central authorities in early September. The plan expands the area of the Qianhai zone by eight times, from 14.92 square km to 120 square km.
Similarly, a plan for the creation of a Guangdong–Macao in-depth cooperation zone in Hengqin was issued in the same month.
Together, the two plans provide a broader, more convenient and higher-quality environment for residents of the mainland and both SARs to live, invest and work in, said Leung Chun-ying, Vice Chairman of the National Committee of the Chinese People’s Political Consultative Conference, China’s top political advisory body, at an online seminar on September 13.
They also make it easier for enterprises in Hong Kong and Macao to explore the vast array of opportunities on the mainland and beyond, Leung added.
The Qianhai plan gives full rein to Hong Kong’s long-held advantages in high-end professional services, while enabling the Qianhai zone to play a greater role, Chief Executive of Hong Kong SAR Carrie Lam said.
Rather than getting embroiled in competition for resources, Qianhai and Hong Kong will forge a mutually beneficial relationship, Wu Sikang, Director of the Shenzhen Municipal Government’s Development Research Center, said.
Like Qianhai, Hengqin, too, banks on its geographical advantage to promote regional cooperation. The Hengqin Island in Zhuhai is adjacent to Macao, with the closest points between the two no more than 200 meters apart, and is also not far from Hong Kong.
Hengqin covers an area of 106 square km, over three times the size of Macao. The Hengqin plan aims to help Macao cultivate a more diversified economy and leverage its advantages in industries such as health, modern finance, hi-tech, exhibitions, trade, culture and sports.
“Industries and businesses that boost employment are what we want,” said Cong Liang, Vice Chairman of the National Development and Reform Commission, the nation’s top economic regulator.
According to the plan, young professionals from Macao who start their own businesses or are employed in innovative enterprises in Hengqin will be able to enjoy supporting policies from both Macao and Guangdong. Further measures to encourage businesses in the cooperation zone to recruit young talent from the SAR are in the pipeline.
With a population of more than 80 million, the Guangdong-Hong Kong-Macao Greater Bay Area, consisting of two SARs and nine Guangdong cities, covers an area of 56,000 square km, about three times that of the San Francisco Bay Area.
Regional cooperation has made the daily life of residents in the Greater Bay Area more convenient. For example, a new port of entry, with a designed capacity for handling 222,000 daily passenger crossings, has greatly eased travel between Zhuhai and Macao.
Guangdong will continue to improve services for Hong Kong and Macao entrepreneurs, said Lin Keqing, Executive Vice Governor of Guangdong. Also, a range of competitions and internship programs will be launched to help them familiarize with the real world of business on the mainland.
**Categories:** Business
---
### [Converge Technology Solutions Corp. Completes Acquisition of Vicom Infinity and Infinity Systems Software](https://df.media/converge-technology-solutions-corp-completes-acquisition-of-vicom-infinity-and-infinity-systems-software/)
**Published:** July 27, 2023
**Author:** Daily Finance
**Content:**
*Vicom Infinity and Infinity Systems Software join Converge Company as part of Converge’s portfolio of companies.*
TORONTO and GATINEAU, QC, Aug. 31, 2021 /PRNewswire/ – Converge Technology Solutions Corp. (“**Converge**” or “the **Company**“) (TSX: CTS) (FSE: 0ZB) (OTCQX: CTSDF) a software-enabled IT & Cloud Solutions provider, is pleased to announce the closing of its previously announced acquisition of Vicom Infinity and Infinity Systems Software.
Vicom Infinity, a world-class IBM mainframe solutions provider, focuses on their philosophy of combining proven IT technology with the infinite possibilities of innovative thinking to transform IT functionality. Vicom Infinity’s products and uncompromising service have helped clients successfully transform their IT enterprise systems.
Infinity Systems Software has been a leading supplier of software and services for IBM platforms for more than 20 years. Sister company to Vicom Infinity, Infinity Systems Software is proficient in IBM mainframe and offers a wide range of services including IT consulting, applications development, managed services, legacy modernization, disaster recovery, and customization.
Vicom Infinity and Infinity Systems Software marks the twenty-second and twenty-third acquisitions completed by Converge since October 2017. Converge’s family of companies also includes Corus Group, LLC; Northern Micro, Inc.; 10084182 Canada Inc. operating as Becker-Carroll; Key Information Systems, Inc.; BlueChip Tek, Inc.; Lighthouse Computer Systems, Inc.; Software Information Systems LLC.; Nordisk Systems, Inc.; Essex Technology Group, Inc.; Datatrend Technologies, Inc.; VSS, LLC; Solutions PCD, Inc.; Unique Digital, Inc.; Workgroup Connections, Inc.; Vivvo Application Studios LTD.; Vicom Computer Services, Inc.; CarpeDatum LLC; Accudata Systems, Inc.; Dasher Technologies, Inc.; ExactlyIT, Inc.; and REDNET AG.
**About Converge** Converge Technology Solutions Corp. is a software-enabled IT & Cloud Solutions provider focused on delivering industry-leading solutions and services. Converge’s regional sales and services organizations deliver advanced analytics, cloud, and cybersecurity offerings to clients across various industries. The Company supports these solutions with managed services, digital infrastructure, and talent expertise offerings across all major IT vendors in the marketplace. This multi-faceted approach enables Converge to address the unique business and technology requirements for all clients in the public and private sectors.
**About Vicom Infinity & Infinity Systems Software** Vicom Infinity provides processing solutions for high-availability environments to ensure seamless IT transformation development. Vicom Infinity architects, implements, and supports customized solutions that fit the unique needs of each specific client and are widely known for their expertise in optimizing legacy investments while introducing new technologies and capabilities. Infinity Systems Software, sister company to Vicom Infinity, has been a leading software supplier and services provider for IBM platforms for more than 20 years. Infinity Systems Software is highly skilled in IBM mainframe environments, from legacy systems to IBM’s sophisticated System z mainframes, including Linux-based platforms.
Together, Vicom Infinity and Infinity Systems Software bring a wealth of experience and expertise in IBM data center environments. By combining technology tools and business objectives, both organizations jointly deliver unique insight into IBM’s technology roadmap and help clients find the right strategy to achieve business success.
**Categories:** Finance, Global News
---
### [CON EDISON REPORTS 2021 EARNINGS](https://df.media/con-edison-reports-2021-earnings/)
**Published:** July 27, 2023
**Author:** Daily Finance
**Content:**
NEW YORK, Feb. 17, 2022 /PRNewswire/ — Consolidated Edison, Inc. (Con Edison) (NYSE: ED) today reported 2021 net income for common stock of $1,346 million or $3.86 a share compared with $1,101 million or $3.29 a share in 2020. Adjusted earnings were $1,528 million or $4.39 a share in 2021 compared with $1,399 million or $4.18 a share in 2020. Adjusted earnings and adjusted earnings per share in 2021 exclude the impact of impairment losses related to Con Edison’s investments in Stagecoach Gas Services LLC (Stagecoach) and Honeoye Storage Corporation (Honeoye) and the loss from the sale of a renewable electric project. Adjusted earnings and adjusted earnings per share in 2021 and 2020 exclude the impact of the impairment losses related to Con Edison’s investment in Mountain Valley Pipeline, LLC (MVP), the effects of hypothetical liquidation at book value (HLBV) accounting for tax equity investments in certain renewable and sustainable electric projects of Con Edison Clean Energy Businesses, Inc. (the Clean Energy Businesses) and the net mark-to-market effects of the Clean Energy Businesses. Adjusted earnings and adjusted earnings per share in 2021 exclude the tax impact on the parent company of HLBV accounting and mark-to-market effects of the Clean Energy Businesses.
[](https://web.archive.org/web/20221126150659/https://mma.prnewswire.com/media/1522521/ConEdison_Logo.html)
For the fourth quarter of 2021, net income for common stock was $224 million or $0.63 a share compared with $43 million or $0.13 a share in the 2020 period. Adjusted earnings were $355 million or $1.00 a share in the 2021 period compared with $253 million or $0.75 a share in the 2020 period. Adjusted earnings and adjusted earnings per share in the 2021 period exclude the impact of the impairment losses related to Con Edison’s investments in Stagecoach and Honeoye. Adjusted earnings and adjusted earnings per share in the 2021 and 2020 periods exclude the impact of the impairment losses related to Con Edison’s investment in MVP, the effects of HLBV accounting for tax equity investments in certain renewable and sustainable electric projects of the Clean Energy Businesses and the net mark-to-market effects of the Clean Energy Businesses. Adjusted earnings and adjusted earnings per share for the 2021 period exclude the tax impact on the parent company of HLBV accounting and mark-to-market effects of the Clean Energy Businesses.
“Once again in 2021, our employees continued to provide safe, reliable service to our customers throughout the unprecedented challenges of the pandemic, and our focus on delivering investor value remains strong,” said Timothy P. Cawley, chairman and chief executive officer of Con Edison. “Our expanded Clean Energy Commitment reflects our dedication to lead the transition to renewables, give our customers greater control over their energy use, and build a more resilient grid.”
For the year of 2022, Con Edison expects its adjusted earnings per share to be in the range of $4.40 to $4.60 per share. Adjusted earnings per share exclude the effects of HLBV accounting for tax equity investments in certain renewable and sustainable electric projects of the Clean Energy Businesses and the related tax impact of such HLBV accounting on the parent company (approximately $40 million or $0.11 a share after-tax) and the net mark-to-market effects of the Clean Energy Businesses and the related tax impact of such mark-to-market effects on the parent company, the amounts of which will not be determinable until year end. The forecast reflects other operations and maintenance expenses of $3,185 million. The company also forecasts a five-year compounded annual adjusted earnings per share growth rate of 5% to 7% based on its 2022 adjusted earnings per share guidance. Con Edison is considering strategic alternatives with respect to the Clean Energy Businesses, which through its subsidiaries, develops, owns and operates renewable and sustainable energy infrastructure projects and provides energy-related products and services to wholesale and retail customers. Con Edison’s forecast of adjusted earnings per share for the year of 2022 does not include the impact, if any, that may result from such evaluation.
In 2022, Con Edison expects to make capital investments of $4,607 million. For 2023 and 2024, Con Edison expects to make capital investments of $11,070 million in aggregate. Con Edison plans to meet its capital requirements for 2022 through 2024, through internally-generated funds and the issuance of long-term debt and common equity. The company’s plans include the issuance of between $800 million and $1,400 million of long-term debt, primarily at Consolidated Edison Company of New York, Inc. and Orange and Rockland Utilities, Inc. (collectively, the Utilities) in 2022 and approximately $2,500 million in aggregate of long-term debt, including for maturing securities, primarily at the Utilities, during 2023 and 2024. The planned debt issuance is in addition to the issuance of long-term debt secured by the Clean Energy Businesses’ renewable electric projects. The company’s plans also include the issuance of up to $850 million of common equity in 2022 and approximately $750 million in aggregate of common equity during 2023 and 2024, in addition to common equity under its dividend reinvestment, employee stock purchase and long-term incentive plans. Con Edison’s financing plans do not include the impact, if any, that may result from its evaluation of strategic alternatives with respect to the Clean Energy Businesses.
See Attachment A to this press release for a reconciliation of Con Edison’s reported earnings per share to adjusted earnings per share and reported net income for common stock to adjusted earnings for the three months and years ended December 31, 2021 and 2020. See Attachment B for the company’s consolidated income statements for the three months and years ended 2021 and 2020. See Attachments C and D for the estimated effect of major factors resulting in variations in earnings per share and net income for common stock for the three months and year ended December 31, 2021 compared to the 2020 periods.
The company’s 2021 Annual Report on Form 10-K is being filed with the Securities and Exchange Commission. A 2021 earnings release presentation will be available at [www.conedison.com](https://web.archive.org/web/20221126150659/http://www.conedison.com/). (Select “For Investors” and then select “Press Releases.”)
This press release contains forward-looking statements that are intended to qualify for the safe-harbor provisions of Section 27A of the Securities Act of 1933, as amended, and Section 21E of the Securities Exchange Act of 1934, as amended. Forward-looking statements are statements of future expectations and not facts. Words such as “forecasts,” “expects,” “estimates,” “anticipates,” “intends,” “believes,” “plans,” “will,” “target,” “guidance,” “potential,” “consider” and similar expressions identify forward-looking statements. The forward-looking statements reflect information available and assumptions at the time the statements are made, and accordingly speak only as of that time.
Actual results or developments might differ materially from those included in the forward-looking statements because of various factors such as those identified in reports Con Edison has filed with the Securities and Exchange Commission, including that Con Edison’s subsidiaries are extensively regulated and are subject to penalties; its utility subsidiaries’ rate plans may not provide a reasonable return; it may be adversely affected by changes to the utility subsidiaries’ rate plans; the failure of, or damage to, its subsidiaries’ facilities could adversely affect it; a cyber-attack could adversely affect it; the failure of processes and systems and the performance of employees and contractors could adversely affect it; it is exposed to risks from the environmental consequences of its subsidiaries’ operations, including increased costs related to climate change; a disruption in the wholesale energy markets or failure by an energy supplier or customer could adversely affect it; it has substantial unfunded pension and other postretirement benefit liabilities; its ability to pay dividends or interest depends on dividends from its subsidiaries; it requires access to capital markets to satisfy funding requirements; changes to tax laws could adversely affect it; its strategies may not be effective to address changes in the external business environment; it faces risks related to health epidemics and other outbreaks, including the COVID-19 pandemic; and it also faces other risks that are beyond its control, including inflation and supply chain disruptions. Con Edison assumes no obligation to update or revise any forward-looking statements, whether as a result of new information, future events or otherwise, except as required by law.
This press release also contains financial measures, adjusted earnings and adjusted earnings per share, that are not determined in accordance with generally accepted accounting principles in the United States of America (GAAP). These non-GAAP financial measures should not be considered as an alternative to net income for common stock or net income per share, respectively, each of which is an indicator of financial performance determined in accordance with GAAP. Adjusted earnings and adjusted earnings per share exclude from net income for common stock and net income per share, respectively, certain items that Con Edison does not consider indicative of its ongoing financial performance such as the impairment losses related to Con Edison’s investments in MVP, Stagecoach and Honeoye, the loss from the sale of a renewable electric project, the effects of the Clean Energy Businesses’ HLBV accounting for tax equity investors in certain renewable and sustainable electric projects and mark-to-market accounting and only for the 2021 periods exclude the tax impact on the parent company of HLBV accounting and mark-to-market accounting. Management uses these non-GAAP financial measures to facilitate the analysis of Con Edison’s financial performance as compared to its internal budgets and previous financial results and to communicate to investors and others Con Edison’s expectations regarding its future earnings and dividends on its common stock. Management believes that these non-GAAP financial measures are also useful and meaningful to investors to facilitate their analysis of Con Edison’s financial performance.
Consolidated Edison, Inc. is one of the nation’s largest investor-owned energy-delivery companies, with approximately $14 billion in annual revenues and $63 billion in assets. The company provides a wide range of energy-related products and services to its customers through the following subsidiaries: Consolidated Edison Company of New York, Inc. (CECONY), a regulated utility providing electric service in New York City and New York’s Westchester County, gas service in Manhattan, the Bronx, parts of Queens and parts of Westchester, and steam service in Manhattan; Orange and Rockland Utilities, Inc. (O&R), a regulated utility serving customers in a 1,300-square-mile-area in southeastern New York State and northern New Jersey; Con Edison Clean Energy Businesses, Inc., the second-largest owners of solar electric projects in North America, which, through its subsidiaries develops, owns and operates renewable and sustainable energy infrastructure projects and provides energy-related products and services to wholesale and retail customers; and Con Edison Transmission, Inc., which falls primarily under the oversight of the Federal Energy Regulatory Commission and through its subsidiaries invests in electric transmission projects supporting its parent company’s effort to transition to clean, renewable energy. Con Edison Transmission manages, through joint ventures, both electric and gas assets while seeking to develop electric transmission projects that will bring clean, renewable electricity to customers, focusing on New York, New England, the Mid-Atlantic states and the Midwest.
| | | | **Attachment A** |
|---|---|---|---|
| | | | |
| | For the Three Months Ended | | For the Years Ended |
| | December 31, | | December 31, |
| | Earningsper Share | Net Income for Common Stock(Millions of Dollars) | | Earningsper Share | Net Income for Common Stock (Millions of Dollars) |
| | 2021 | 2020 | 2021 | 2020 | | 2021 | 2020 | 2021 | 2020 |
| **Reported earnings per share (basic) and net income for common stock (GAAP basis)** | **$0.63** | **$0.13** | **$224** | **$43** | | **$3.86** | **$3.29** | **$1,346** | **$1,101** |
| | | | | | | | | | |
| Impairment loss related to investment in Mountain Valley Pipeline, LLC (pre-tax) | 0.65 | 0.95 | 231 | 320 | | 0.66 | 0.95 | 231 | 320 |
| Income taxes (a) | (0.19) | (0.29) | (69) | (97) | | (0.19) | (0.29) | (69) | (97) |
| Impairment loss related to investment in Mountain Valley Pipeline, LLC (net of tax) | 0.46 | 0.66 | 162 | 223 | | 0.47 | 0.66 | 162 | 223 |
| Loss from sale of a renewable electric project (pre-tax) | — | — | — | — | | 0.01 | — | 4 | — |
| Income taxes (b) | — | — | — | — | | — | — | (1) | — |
| Loss from sale of a renewable electric project (net of tax) | — | — | — | — | | 0.01 | — | 3 | — |
| Impairment loss related to investment in Stagecoach (pre-tax) | — | — | 1 | — | | 0.61 | — | 212 | — |
| Income taxes (c) | — | — | — | — | | (0.19) | — | (65) | — |
| Impairment loss related to investment in Stagecoach (net of tax) | — | — | 1 | — | | 0.42 | — | 147 | — |
| Impairment loss related to investment in Honeoye Storage Corporation (pre-tax) | 0.02 | — | 5 | — | | 0.02 | — | 5 | — |
| Income taxes | — | — | — | — | | — | — | — | — |
| Impairment loss related to investment in Honeoye Storage Corporation (net of tax) | 0.02 | — | 5 | — | | 0.02 | — | 5 | — |
| HLBV effects (pre-tax) | (0.08) | 0.01 | (26) | 6 | | (0.41) | 0.14 | (142) | 44 |
| Income taxes (d) | 0.02 | — | 8 | (2) | | 0.12 | (0.04) | 44 | (12) |
| HLBV effects (net of tax) | (0.06) | 0.01 | (18) | 4 | | (0.29) | 0.10 | (98) | 32 |
| Net mark-to-market effects (pre-tax) | (0.08) | (0.07) | (28) | (23) | | (0.15) | 0.18 | (53) | 57 |
| Income taxes (e) | 0.03 | 0.02 | 9 | 6 | | 0.05 | (0.05) | 16 | (14) |
| Net mark-to-market effects (net of tax) | (0.05) | (0.05) | (19) | (17) | | (0.10) | 0.13 | (37) | 43 |
| | | | | | | | | | |
| **Adjusted earnings and adjusted earnings per share (non-GAAP basis)** | **$1.00** | **$0.75** | **$355** | **$253** | | **$4.39** | **$4.18** | **$1,528** | **$1,399** |
| | |
|---|---|
| (a) | The amount of income taxes was calculated using a combined federal and state income tax rate of 30% for the three months and years ended December 31, 2021 and December 31, 2020. |
| (b) | The amount of income taxes was calculated using a combined federal and state income tax rate of 26% for the year ended December 31, 2021. |
| (c) | The amount of income taxes was calculated using a combined federal and state income tax rate of 30% for the three months and year ended December 31, 2021. |
| (d) | The amount of income taxes was calculated using a combined federal and state income tax rate of 31% for the three months and year ended December 31, 2021 and a combined federal and state income tax rate of 33% and 27% for the three months and year ended December 31, 2020, respectively. Adjusted earnings and adjusted earnings per share for the 2021 periods exclude the tax impact on the parent company of HLBV accounting ($2 million and $0.00 for the three months ended December 31, 2021, respectively, and $9 million and $0.02 for the year ended December 31, 2021, respectively) of the Clean Energy Businesses. Adjusted earnings and adjusted earnings per share for the 2020 periods do not exclude the tax impact on the parent company of HLBV accounting (immaterial for the three months ended December 31, 2020, and ($3) million and ($0.01) for the year ended December 31, 2020, respectively) of the Clean Energy Businesses. |
| (e) | The amount of income taxes was calculated using a combined federal and state income tax rate of 31% and 32% for the three months and year ended December 31, 2021, respectively, and a combined federal and state income tax rate of 26% and 25% for the three months and year ended December 31, 2020, respectively. Adjusted earnings and adjusted earnings per share for the 2021 periods exclude the tax impact on the parent company of the mark-to-market effects ($1 million and $0.00 for the three months ended December 31, 2021, respectively, and $3 million and $0.01 for the year ended December 31, 2021, respectively) of the Clean Energy Businesses. Adjusted earnings and adjusted earnings per share for the 2020 periods do not exclude the tax impact on the parent company of the mark-to-market effects ($1 million and $0.00 for the three months ended December 31, 2020, respectively, and ($4) million and ($0.01) for the year ended December 31, 2020, respectively) of the Clean Energy Businesses. |
| **Attachment B** |
|---|
| | | | | |
| | For the Three Months Ended | For the Years Ended |
| | December 31, | December 31, |
| | 2021 | 2020 | 2021 | 2020 |
| OPERATING REVENUES | | | | |
| Electric | $2,306 | $2,070 | $9,485 | $8,730 |
| Gas | 730 | 596 | 2,638 | 2,269 |
| Steam | 139 | 123 | 532 | 508 |
| Non-utility | 240 | 171 | 1,021 | 739 |
| TOTAL OPERATING REVENUES | 3,415 | 2,960 | 13,676 | 12,246 |
| OPERATING EXPENSES | | | | |
| Purchased power | 386 | 408 | 1,835 | 1,600 |
| Fuel | 63 | 32 | 229 | 156 |
| Gas purchased for resale | 229 | 163 | 690 | 527 |
| Other operations and maintenance | 812 | 698 | 3,254 | 2,814 |
| Depreciation and amortization | 521 | 492 | 2,032 | 1,920 |
| Taxes, other than income taxes | 707 | 660 | 2,810 | 2,575 |
| TOTAL OPERATING EXPENSES | 2,718 | 2,453 | 10,850 | 9,592 |
| OPERATING INCOME | 697 | 507 | 2,826 | 2,654 |
| OTHER INCOME (DEDUCTIONS) | | | | |
| Investment income | (240) | (292) | (420) | (214) |
| Other income | 3 | 8 | 22 | 23 |
| Allowance for equity funds used during construction | 6 | 5 | 21 | 17 |
| Other deductions | (48) | (50) | (161) | (227) |
| TOTAL OTHER INCOME | (279) | (329) | (538) | (401) |
| INCOME BEFORE INTEREST AND INCOME TAX EXPENSE | 418 | 178 | 2,288 | 2,253 |
| INTEREST EXPENSE | | | | |
| Interest on long-term debt | 237 | 230 | 930 | 915 |
| Other interest | 1 | (4) | (14) | 118 |
| Allowance for borrowed funds used during construction | (3) | (4) | (11) | (14) |
| NET INTEREST EXPENSE | 235 | 222 | 905 | 1,019 |
| INCOME BEFORE INCOME TAX EXPENSE | 183 | (44) | 1,383 | 1,234 |
| INCOME TAX EXPENSE | (4) | (93) | 190 | 90 |
| NET INCOME | 187 | 49 | 1,193 | 1,144 |
| Income attributable to non-controlling interest | (37) | 6 | (153) | 43 |
| NET INCOME FOR COMMON STOCK | $224 | $43 | $1,346 | $1,101 |
| Net income per common share — basic | $0.63 | $0.13 | $3.86 | $3.29 |
| Net income per common share — diluted | $0.63 | $0.13 | $3.85 | $3.28 |
| AVERAGE NUMBER OF SHARES OUTSTANDING — BASIC (IN MILLIONS) | 353.8 | 336.7 | 348.4 | 334.8 |
| AVERAGE NUMBER OF SHARES OUTSTANDING — DILUTED (IN MILLIONS) | 354.8 | 337.5 | 349.4 | 335.7 |
| **Attachment C** |
|---|
| |
| Variation for the Three Months Ended December 31, 2021 vs. 2020 |
| | Net Income for Common Stock (Net of Tax) (Millions of Dollars) | Earnings per Share |
| **CECONY (a)** | | |
| Recognition of late payment charges for the year ended 2020 that are being recovered through a surcharge mechanism established by the New York Public Service Commission in its November 2021 order | $32 | $0.09 |
| Recognition of late payment charges for the year 2021 that are being recovered through a surcharge mechanism established by the New York Public Service Commission in its November 2021 order, and resuming the billing of late payment charges and no access fees | 41 | 0.13 |
| Higher incentives earned under the electric and gas earnings adjustment mechanisms (EAMs) and positive incentives | 28 | 0.08 |
| Higher electric rate base | 17 | 0.05 |
| Higher gas rate base | 9 | 0.03 |
| Lower storm-related costs | 5 | 0.01 |
| Higher stock based compensation costs | (14) | (0.04) |
| Higher healthcare costs | (2) | (0.01) |
| Dilutive effect of stock issuances | — | (0.05) |
| Other | (6) | (0.01) |
| Total CECONY | 110 | 0.28 |
| **O&R (a)** | | |
| Electric base rate increase | 2 | 0.01 |
| Lower storm-related costs | 2 | 0.01 |
| Other | 4 | — |
| Total O&R | 8 | 0.02 |
| **Clean Energy Businesses** | | |
| HLBV effects | 24 | 0.07 |
| Net mark-to-market effects | 3 | — |
| Dilutive effect of stock issuances | — | (0.01) |
| Other | — | 0.01 |
| Total Clean Energy Businesses | 27 | 0.07 |
| **Con Edison Transmission** | | |
| Impairment loss related to investment in Mountain Valley Pipeline, LLC | 64 | 0.22 |
| Foregoing Allowance for Funds Used During Construction income starting in January 2021 until significant construction resumes on the Mountain Valley Pipeline | (12) | (0.04) |
| Impairment loss related to investment in Stagecoach | (1) | — |
| Impairment loss related to investment in Honeoye | (5) | (0.02) |
| Other | (3) | (0.01) |
| Total Con Edison Transmission | 43 | 0.15 |
| **Other, including parent company expenses** | | |
| Impairment tax benefits related to investment in Mountain Valley Pipeline, LLC | (3) | (0.02) |
| Tax impact of HLBV effects | (2) | — |
| Tax impact of net mark-to-market effects | (1) | — |
| Other | (1) | — |
| Total Other, including parent company expenses | (7) | (0.02) |
| Total Reported (GAAP basis) | 181 | 0.50 |
| Impairment loss related to investment in Mountain Valley Pipeline, LLC | (61) | (0.20) |
| HLBV effects | (22) | (0.07) |
| Net mark-to-market effects | (2) | — |
| Impairment loss related to investment in Honeoye | 5 | 0.02 |
| Impairment loss related to investment in Stagecoach | 1 | — |
| Total Adjusted (non-GAAP basis) | $102 | $0.25 |
| a. Under the revenue decoupling mechanisms in the Utilities’ NY electric and gas rate plans and the weather-normalization clause applicable to their gas businesses, revenues are generally not affected by changes in delivery volumes from levels assumed when rates were approved. In general, the Utilities recover on a current basis the fuel, gas purchased for resale and purchased power costs they incur in supplying energy to their full-service customers. Accordingly, such costs do not generally affect Con Edison’s results of operations. |
| **Attachment D** |
|---|
| |
| Variation for the Year Ended December 31, 2021 vs. 2020 |
| | Net Income for Common Stock (Net of Tax) (Millions of Dollars) | Earnings per Share |
| **CECONY (a)** | | |
| Recognition of late payment charges for the year ended 2020 that are being recovered through a surcharge mechanism established by the New York Public Service Commission in its November 2021 order | $32 | $0.09 |
| Recognition of late payment charges for the year ended 2021 that are being recovered through a surcharge mechanism established by the New York Public Service Commission in its November 2021 order, and resuming the billing of late payment charges and no access fees | 41 | 0.13 |
| Higher electric rate base | 64 | 0.19 |
| Higher gas rate base | 38 | 0.11 |
| Higher incentives earned under the electric and gas earnings adjustment mechanisms (EAMs) and positive incentives | 30 | 0.09 |
| Weather impact on steam revenues | 16 | 0.05 |
| Higher costs related to heat, storm and emergency response | (37) | (0.11) |
| Higher healthcare costs | (16) | (0.05) |
| Higher stock-based compensation costs | (11) | (0.03) |
| Dilutive effect of stock issuances | — | (0.15) |
| Other | 2 | — |
| Total CECONY | 159 | 0.32 |
| **O&R (a)** | | |
| Electric base rate increase | 9 | 0.03 |
| Higher storm-related costs | (5) | (0.02) |
| Total O&R | 4 | 0.01 |
| **Clean Energy Businesses** | | |
| Higher revenues | 209 | 0.62 |
| HLBV effects | 139 | 0.41 |
| Net mark-to-market effects | 83 | 0.24 |
| Higher operations and maintenance expenses | (180) | (0.54) |
| Loss from sale of a renewable electric project | (3) | (0.01) |
| Dilutive effect of stock issuances | — | (0.03) |
| Other | (6) | — |
| Total Clean Energy Businesses | 242 | 0.69 |
| **Con Edison Transmission** | | |
| Impairment loss related to investment in Mountain Valley Pipeline, LLC | 64 | 0.21 |
| Impairment losses related to investment in Stagecoach | (153) | (0.44) |
| Foregoing Allowance for Funds Used During Construction income starting in January 2021 until significant construction resumes on the Mountain Valley Pipeline | (44) | (0.13) |
| Impairment loss related to investment in Honeoye | (5) | (0.02) |
| Other | (3) | (0.01) |
| Total Con Edison Transmission | (141) | (0.39) |
| **Other, including parent company expenses** | | |
| Impairment tax benefits related to investment in Mountain Valley Pipeline, LLC | (3) | (0.02) |
| Tax impact of HLBV effects | (9) | (0.02) |
| Tax impact of net mark-to-market effects | (3) | (0.01) |
| Lower consolidated state income tax benefit | (9) | (0.03) |
| Impairment tax benefits related to investment in Stagecoach | 6 | 0.02 |
| Other | (1) | — |
| Total Other, including parent company expenses | (19) | (0.06) |
| Total Reported (GAAP basis) | 245 | 0.57 |
| Impairment loss related to investment in Mountain Valley Pipeline, LLC | (61) | (0.19) |
| HLBV effects | (130) | (0.39) |
| Net mark-to-market effects | (80) | (0.23) |
| Impairment losses related to investment in Stagecoach | 147 | 0.42 |
| Impairment loss related to investment in Honeoye | 5 | 0.02 |
| Loss from sale of a renewable electric project | 3 | 0.01 |
| Total Adjusted (non-GAAP basis) | $129 | $0.21 |
| a. Under the revenue decoupling mechanisms in the Utilities’ NY electric and gas rate plans and the weather-normalization clause applicable to their gas businesses, revenues are generally not affected by changes in delivery volumes from levels assumed when rates were approved. In general, the Utilities recover on a current basis the fuel, gas purchased for resale and purchased power costs they incur in supplying energy to their full-service customers. Accordingly, such costs do not generally affect Con Edison’s results of operations. |
**Categories:** Finance
---
### [COINBASE GLOBAL 24 HOUR DEADLINE ALERT: Former Louisiana Attorney General and Kahn Swick & Foti, LLC Remind Investors with Losses in Excess of $100,000 of Deadline in Class Action Lawsuits Against Coinbase Global Inc. – COIN](https://df.media/coinbase-global-24-hour-deadline-alert-former-louisiana-attorney-general-and-kahn-swick-foti-llc-remind-investors-with-losses-in-excess-of-100000-of-deadline-in-class-action-lawsuits-against/)
**Published:** July 27, 2023
**Author:** Daily Finance
**Content:**
NEW ORLEANS, Sept. 19, 2021 /PRNewswire/ — Kahn Swick & Foti, LLC (“KSF”) and KSF partner, the former Attorney General of Louisiana, Charles C. Foti, Jr., remind investors that they have until **September 20, 2021** to file lead plaintiff applications in securities class action lawsuits against Coinbase Global Inc. (NasdaqGS: COIN), if they purchased the Company’s shares issued in connection with its April 2021 Direct Offering (the “Offering”). These actions are pending in the United States District Court for the Northern District of California.
## What You May Do
If you purchased shares of Coinbase and would like to discuss your legal rights and how these cases might affect you and your right to recover for your economic loss, you may, without obligation or cost to you, contact KSF Managing Partner Lewis Kahn toll-free at 1-877-515-1850to learn more. If you wish to serve as a lead plaintiff in these class actions by overseeing lead counsel with the goal of obtaining a fair and just resolution, you must request this position by application to the Court by **September 20, 2021**.
## About the Lawsuits
Coinbase and certain of its executives are charged with failing to disclose material information in its Registration Statement and Prospectus, violating federal securities laws.
On May 17, 2021, a month after its Direct Offering, the Company disclosed plans to raise about $1.25 billion via a convertible bond sale. Then, on May 19, 2021, the Company disclosed technical issues with its platform causing “delays…due to network congestion” affecting its users.
The alleged false and misleading statements and omissions include, but are not limited to, that: (i) the Company required a sizeable cash injection; (ii) the Company’s platform was susceptible to service-level disruptions, which were increasingly likely to occur as the Company scaled its services to a larger user base; and (iii) as a result of the foregoing, the Company’s statements were materially false and misleading at all relevant times.
The first-filed case is *Ramsey v. Coinbase Global, Inc., et al*, 3:21-cv-05634.
## About Kahn Swick & Foti, LLC
KSF, whose partners include former Louisiana Attorney General Charles C. Foti, Jr., is one of the nation’s premier boutique securities litigation law firms. KSF serves a variety of clients – including public institutional investors, hedge funds, money managers and retail investors – in seeking to recover investment losses due to corporate fraud and malfeasance by publicly traded companies. KSF has offices in New York, California, Louisiana and New Jersey.
**Categories:** Finance, Global News
---
### [Cohen & Steers Select Preferred and Income Fund, Inc. (PSF) Notification of Sources of Distribution Under Section 19(a)](https://df.media/cohen-steers-select-preferred-and-income-fund-inc-psf-notification-of-sources-of-distribution-under-section-19a/)
**Published:** July 27, 2023
**Author:** Daily Finance
**Content:**
NEW YORK, Oct. 27, 2021 /PRNewswire/ — This press release provides shareholders of Cohen & Steers Select Preferred and Income Fund, Inc. (NYSE: PSF) (the “Fund”) with information regarding the sources of the distribution to be paid on October 29, 2021 and cumulative distributions paid fiscal year-to-date.
In December 2016, the Fund implemented a managed distribution policy in accordance with exemptive relief issued by the Securities and Exchange Commission. The managed distribution policy seeks to deliver the Fund’s long-term total return potential through regular monthly distributions declared at a fixed rate per common share. The policy gives the Fund greater flexibility to realize long-term capital gains throughout the year and to distribute those gains on a regular monthly basis to shareholders. The Board of Directors of the Fund may amend, terminate or suspend the managed distribution policy at any time, which could have an adverse effect on the market price of the Fund’s shares.
The Fund’s monthly distributions may include long-term capital gains, short-term capital gains, net investment income and/or return of capital for federal income tax purposes. Return of capital includes distributions paid by the Fund in excess of its net investment income and net realized capital gains and such excess is distributed from the Fund’s assets. A return of capital is not taxable; rather, it reduces a shareholder’s tax basis in his or her shares of the Fund. The amount of monthly distributions may vary depending on a number of factors, including changes in portfolio and market conditions.
At the time of each monthly distribution, information will be posted to cohenandsteers.com and mailed to shareholders in a concurrent notice. However, this information may change at the end of the year because the final tax characteristics of the Fund’s distributions cannot be determined with certainty until after the end of the calendar year. Final tax characteristics of all of the Fund’s distributions will be provided on Form 1099-DIV, which is mailed after the close of the calendar year.
The following table sets forth the estimated amounts of the current distribution and the cumulative distributions paid this fiscal year-to-date from the sources indicated. All amounts are expressed per common share.
| **DISTRIBUTION ESTIMATES** | **October 2021** | **YEAR-TO-DATE (YTD)October 31, 2021\*** |
|---|---|---|
| **Source** | **Per Share Amount** | **% of Current Distribution** | **Per Share Amount** | **% of 2021 Distributions** |
| Net Investment Income | $0.0593 | 37.77% | $1.0697 | 68.13% |
| Net Realized Short-Term Capital Gains | $0.0000 | 0.00% | $0.0000 | 0.00% |
| Net Realized Long-Term Capital Gains | $0.0977 | 62.23% | $0.5003 | 31.87% |
| Return of Capital (or other Capital Source) | $0.0000 | 0.00% | $0.0000 | 0.00% |
| **Total Current Distribution** | **$0.1570** | **100.00%** | **$1.5700** | **100.00%** |
**You should not draw any conclusions about the Fund’s investment performance from the amount of this distribution or from the terms of the Fund’s managed distribution policy. The amounts and sources of distributions reported in this Notice are only estimates, are likely to change over time, and are not being provided for tax reporting purposes. The actual amounts and sources of the amounts for accounting and tax reporting purposes will depend upon the Fund’s investment experience during the remainder of its fiscal year and may be subject to changes based on tax regulations. The amounts and sources of distributions year-to-date may be subject to additional adjustments.**
**\*THE FUND WILL SEND YOU A FORM 1099-DIV FOR THE CALENDAR YEAR THAT WILL TELL YOU HOW TO REPORT THESE DISTRIBUTIONS FOR FEDERAL INCOME TAX PURPOSES**
The Fund’s Year-to-date Cumulative Total Return for fiscal year 2021 (January 1, 2021 through September 30, 2021) is set forth below. Shareholders should take note of the relationship between the Year-to-date Cumulative Total Return with the Fund’s Cumulative Distribution Rate for 2021. In addition, the Fund’s Average Annual Total Return for the five-year period ending September 30, 2021 is set forth below. Shareholders should note the relationship between the Average Annual Total Return with the Fund’s Current Annualized Distribution Rate for 2021. The performance and distribution rate information disclosed in the table is based on the Fund’s net asset value per share (NAV). The Fund’s NAV is calculated as the total market value of all the securities and other assets held by the Fund minus the total liabilities, divided by the total number of shares outstanding. While NAV performance may be indicative of the Fund’s investment performance, it does not measure the value of a shareholder’s individual investment in the Fund. The value of a shareholder’s investment in the Fund is determined by the Fund’s market price, which is based on the supply and demand for the Fund’s shares in the open market.
***Fund Performance and Distribution Rate Information:***
| **Year-to-date January 1, 2021 to September 30, 2021** |
|---|
| Year-to-date Cumulative Total Return1 | 6.06% |
| Cumulative Distribution Rate2 | 5.81% |
| |
| **Five-year period ending September 30, 2021** |
| Average Annual Total Return3 | 7.98% |
| Current Annualized Distribution Rate4 | 6.97% |
| 1. | Year-to-date Cumulative Total Return is the percentage change in the Fund’s NAV over the year-to-date time period including distributions paid and assuming reinvestment of those distributions. |
|---|---|
| 2. | Cumulative Distribution Rate for the Fund’s current fiscal period (January 1, 2021 through October 31, 2021) measured on the dollar value of distributions in the year-to-date period as a percentage of the Fund’s NAV as of September 30, 2021. |
| 3. | Average Annual Total Return represents the compound average of the Annual NAV Total Returns of the Fund for the five-year period ending September 30, 2021. Annual NAV Total Return is the percentage change in the Fund’s NAV over a year including distributions paid and assuming reinvestment of those distributions. |
| 4. | The Current Annualized Distribution Rate is the current fiscal period’s distribution rate annualized as a percentage of the Fund’s NAV as of September 30, 2021. |
Investors should consider the investment objectives, risks, charges and expense of the Fund carefully before investing. You can obtain the Fund’s most recent periodic reports, when available, and other regulatory filings by contacting your financial advisor or visiting cohenandsteers.com. These reports and other filings can be found on the Securities and Exchange Commission’s EDGAR Database. You should read these reports and other filings carefully before investing.
*Shareholders should not use the information provided here in preparing their tax returns. Shareholders will receive a Form 1099-DIV for the calendar year indicating how to report Fund distributions for federal income tax purposes.*
Symbol: (NYSE: CNS)
**About Cohen & Steers.** Cohen & Steers is a leading global investment manager specializing in real assets and alternative income, including real estate, preferred securities, infrastructure, resource equities, commodities, as well as multi-strategy solutions. Founded in 1986, the firm is headquartered in New York City, with offices in London, Dublin, Hong Kong, and Tokyo.
***Forward-Looking Statements***
*This press release and other statements that Cohen & Steers may make may contain forward looking statements within the meaning of Section 27A of the Securities Act of 1933 and Section 21E of the Securities Exchange Act of 1934, which reflect the company’s current views with respect to, among other things, its operations and financial performance. You can identify these forward-looking statements by the use of words such as “outlook,” “believes,” “expects,” “potential,” “continues,” “may,” “will,” “should,” “seeks,” “approximately,” “predicts,” “intends,” “plans,” “estimates,” “anticipates,” or the negative versions of these words or other comparable words. Such forward-looking statements are subject to various risks and uncertainties.*
*Accordingly, there are or will be important factors that could cause actual outcomes or results to differ materially from those indicated in these statements. The company undertakes no obligation to publicly update or review any forward-looking statement, whether as a result of new information, future developments or otherwise.*
**Categories:** Global News
---
### [Cohen & Steers Closed-End Funds Declare Distributions for April, May, and June 2022](https://df.media/cohen-steers-closed-end-funds-declare-distributions-for-april-may-and-june-2022/)
**Published:** July 27, 2023
**Author:** Daily Finance
**Content:**
NEW YORK, March 29, 2022 /PRNewswire/ — The Boards of Directors of the Cohen & Steers Closed-End Funds announced today the monthly distributions for April, May, and June 2022, as summarized in the charts below:
| **Ticker** | **Fund Name** | **Monthly Dividend** |
|---|---|---|
| FOF | Cohen & Steers Closed-End Opportunity Fund, Inc. | $0.087 |
| LDP | Cohen & Steers Limited Duration Preferred and Income Fund, Inc. | $0.135 |
| PSF | Cohen & Steers Select Preferred and Income Fund, Inc. | $0.135 |
| PTA | Cohen & Steers Tax-Advantaged Preferred Securities and Income Fund | $0.130 |
| RFI | Cohen & Steers Total Return Realty Fund, Inc. | $0.080 |
| RNP | Cohen & Steers REIT and Preferred and Income Fund, Inc. | $0.136 |
| RQI | Cohen & Steers Quality Income Realty Fund, Inc. | $0.080 |
| UTF | Cohen & Steers Infrastructure Fund, Inc. | $0.155 |
Distributions will be made on the following schedule:
| **Month** | **Ex-Date** | **Record Date** | **Payable Date** |
|---|---|---|---|
| April | April 12, 2022 | April 13, 2022 | April 29, 2022 |
| May | May 10, 2022 | May 11, 2022 | May 31, 2022 |
| June | June 14, 2022 | June 15, 2022 | June 30, 2022 |
Cohen & Steers Tax-Advantaged Preferred Securities and Income Fund pay regular monthly cash distributions to common shareholders at a level rate that may be adjusted from time to time. The fund’s distributions reflect net investment income, and may also include net realized capital gains and/or return of capital. Return of capital includes distributions paid by a fund in excess of its net investment income. Such excess is distributed from the fund’s assets. Under federal tax regulations, some or all of the return of capital distributed by a fund may be taxed as ordinary income. The amount of monthly distributions may vary depending on a number of factors, including changes in portfolio and market conditions.
**\_\_\_\_\_\_\_\_\_\_\_\_\_\_\_\_\_\_\_\_\_\_\_\_\_\_\_\_\_\_\_\_\_\_\_\_\_\_\_\_\_\_\_\_\_\_\_\_\_\_\_\_\_\_\_\_\_\_\_\_\_\_\_\_\_\_\_\_\_\_\_\_\_\_\_\_\_\_**
**Cohen & Steers Closed-End Opportunity Fund, Inc., Cohen & Steers Limited Duration Preferred and Income Fund, Inc., Cohen & Steers Select Preferred and Income Fund, Inc., Cohen & Steers Total Return Realty Fund, Inc., Cohen & Steers REIT and Preferred and Income Fund, Inc., Cohen & Steers Infrastructure Fund, Inc., and Cohen & Steers Quality Income Realty Fund, Inc. only:**
Cohen & Steers Closed-end Opportunity Fund, Inc., Cohen & Steers Limited Duration Preferred and Income Fund, Inc., Cohen & Steers Select Preferred and Income Fund, Inc., Cohen & Steers Total Return Realty Fund, Inc., Cohen & Steers REIT and Preferred and Income Fund, Inc., Cohen & Steers Infrastructure Fund, Inc., and Cohen & Steers Quality Income Realty Fund, Inc. (each, a “Fund” and collectively the “Funds”) declared their monthly distributions pursuant to such Fund’s managed distribution plans. Each Fund implemented a managed distribution policy in accordance with exemptive relief issued by the Securities and Exchange Commission. The policy gives each Fund greater flexibility to realize long-term capital gains throughout the year and to distribute those gains on a regular monthly basis to shareholders. Information can also be found on the Funds’ website at cohenandsteers.com. The Board of Directors of each Fund may amend, terminate or suspend the managed distribution policy at any time, which could have an adverse effect on the market price of each Fund’s shares.
Distributions of a fund’s investment in real estate investment trusts (REITs), master limited partnerships (MLPs) and/or closed-end funds (CEFs) may later be characterized as capital gains and/or a return of capital, depending on the character of the dividends reported to each fund after year end by the REITs, MLPs and CEFs held by a fund.
Each Fund’s distributions may include net investment income, long-term capital gains, short-term capital gains and/or return of capital. Under the plan, prior to the payment date of the distribution every month, each Fund will issue a press release and a notice containing information about the amount and sources of the distribution and other related information to shareholders of record on the record date. Please note that the notice is not provided for tax reporting purposes but for informational purposes only. Information can also be found on the Funds’ website at cohenandsteers.com.
*Shareholders should not use the information provided in preparing their tax returns. Shareholders will receive a Form 1099-DIV for the calendar year indicating how to report Fund distributions for federal income tax purposes.*
Investors should consider the investment objectives, risks, charges and expense of the fund carefully before investing. You can obtain the fund’s most recent periodic reports, when available, and other regulatory filings by contacting your financial advisor or visiting cohenandsteers.com. These reports and other filings can be found on the Securities and Exchange Commission’s EDGAR Database. You should read these reports and other filings carefully before investing.
Symbol: (NYSE: CNS)
**About Cohen & Steers.** Cohen & Steers is a leading global investment manager specializing in real assets and alternative income, including real estate, preferred securities, infrastructure, resource equities, commodities, as well as multi-strategy solutions. Founded in 1986, the firm is headquartered in New York City, with offices in London, Dublin, Hong Kong, and Tokyo.
***Forward-Looking Statements***
*This press release and other statements that Cohen & Steers may make may contain forward looking statements within the meaning of Section 27A of the Securities Act of 1933 and Section 21E of the Securities Exchange Act of 1934, which reflect the company’s current views with respect to, among other things, its operations and financial performance. You can identify these forward-looking statements by the use of words such as “outlook,” “believes,” “expects,” “potential,” “continues,” “may,” “will,” “should,” “seeks,” “approximately,” “predicts,” “intends,” “plans,” “estimates,” “anticipates,” or the negative versions of these words or other comparable words. Such forward-looking statements are subject to various risks and uncertainties.*
*Accordingly, there are or will be important factors that could cause actual outcomes or results to differ materially from those indicated in these statements. The company undertakes no obligation to publicly update or review any forward-looking statement, whether as a result of new information, future developments or otherwise.*
**Categories:** Global News
---
### [CLASS ACTION: Kessler Topaz Meltzer & Check, LLP Reminds SunPower Corporation Shareholders of Securities Fraud Class Action Lawsuit and Encourages Investors with Substantial Losses to Contact the Firm](https://df.media/class-action-kessler-topaz-meltzer-check-llp-reminds-sunpower-corporation-shareholders-of-securities-fraud-class-action-lawsuit-and-encourages-investors-with-substantial-losses-to-contact-the/)
**Published:** July 27, 2023
**Author:** Daily Finance
**Content:**
RADNOR, Pa., March 26, 2022 /PRNewswire/ — The law firm of Kessler Topaz Meltzer & Check, LLP informs investors that a securities class action lawsuit has been filed against SunPower Corporation (“SunPower”) (NASDAQ: SPWR). The action charges SunPower with violations of the federal securities laws, including omissions and fraudulent misrepresentations relating to the company’s business, operations, and prospects. As a result of SunPower’s materially misleading statements to the public, SunPower investors have suffered significant losses.
[](https://web.archive.org/web/20221126150837/https://mma.prnewswire.com/media/277422/ktmc_Logo.html)
Kessler Topaz is one of the world’s foremost advocates in protecting the public against corporate fraud and other wrongdoing. Our securities fraud litigators are regularly recognized as leaders in the field individually and our firm is both feared and respected among the defense bar and the insurance bar. We are proud to have recovered billions of dollars for our clients and the classes of shareholders we represent.
**SUNPOWER’S ALLEGED MISCONDUCT**
SunPower provides solar energy solutions, including sales to its third-party dealer network and resellers, storage solutions, cash and loan sales, and long-term leases directly to end customers, and sells turn-key engineering, procurement, and construction services, as well as energy under power purchase agreements.
On January 21, 2022, SunPower issued a press release revealing that the company had “identified a cracking issue that developed over time in certain factory-installed connectors within third-party commercial equipment supplied to SunPower.” As a result, SunPower reported that it “expects approximately $27 million of supplier-quality related charges in fourth quarter 2021 and approximately $4 million in the first quarter of 2022″ to replace the faulty connectors.
Following this news, SunPower’s stock fell $3.22, or 16.9%, to close at $15.80 on January 21, 2022.
**WHAT CAN I DO?**
SunPower investors may, ***no later than April 18, 2022*** seek to be appointed as a lead plaintiff representative of the class through Kessler Topaz Meltzer & Check, LLP or other counsel, or may choose to do nothing and remain an absent class member. Kessler Topaz Meltzer & Check, LLP encourages SunPower investors who have suffered significant losses to contact the firm directly to acquire more information.
**WHO CAN BE A LEAD PLAINTIFF?** A lead plaintiff is a representative party who acts on behalf of all class members in directing the litigation. The lead plaintiff is usually the investor or small group of investors who have the largest financial interest and who are also adequate and typical of the proposed class of investors. The lead plaintiff selects counsel to represent the lead plaintiff and the class and these attorneys, if approved by the court, are lead or class counsel. Your ability to share in any recovery is not affected by the decision of whether or not to serve as a lead plaintiff.
**ABOUT KESSLER TOPAZ MELTZER & CHECK, LLP** Kessler Topaz Meltzer & Check, LLP prosecutes class actions in state and federal courts throughout the country and around the world. The firm has developed a global reputation for excellence and has recovered billions of dollars for victims of fraud and other corporate misconduct. All of our work is driven by a common goal: to protect investors, consumers, employees and others from fraud, abuse, misconduct and negligence by businesses and fiduciaries. At the end of the day, we have succeeded if the bad guys pay up, and if you recover your assets. The complaint in this action was not filed by Kessler Topaz Meltzer & Check, LLP.
**Categories:** Global News
---
### [Clark Atlanta University President George T. French Jr. Ph.D. Selected Among 100 Most Influential Georgians](https://df.media/clark-atlanta-university-president-george-t-french-jr-ph-d-selected-among-100-most-influential-georgians/)
**Published:** July 27, 2023
**Author:** Daily Finance
**Content:**
ATLANTA, Jan. 5, 2022 /PRNewswire/ — Clark Atlanta University (CAU) President George T. French Jr. selected among the Most Influential Georgians by Georgia Trend Magazine.
The magazine published its 24th annual listing this month. It includes remarkable Georgians who have helped to ensure the state remains at the top for doing business and improving the lives of all of its citizens. According to Georgia Trend this was especially true as the nation and world continues to face challenges from COVID-19 and political conflicts.
“It is an honor to be recognized by Georgia Trend Magazine among such distinguished and esteemed Georgians. The work done by the individuals selected help to make the state of Georgia the great state that it is today. While we all work in different industries and workforces, our common goal is always the people. I have had the opportunity to work directly with many of those recognized by Georgia Trend to ensure that Clark Atlanta University scholars and students from historically black colleges and universities have the funding, tools and access to experiences they need to increase diversity in the pipelines of many industries and that is what it’s all about,” said Clark Atlanta University president George T. French Jr. Ph.D.
This year’s list highlights, politicians, college presidents, nonprofit and economic development leaders who have been an inspiration to others and spearheaded efforts to not only meet but beat the challenges throughout Georgia. Some of those highlighted include Jon Ossoff, U.S. Senator, Raphael Warnock, U.S. Senator, Andre Dickens, 61st Mayor of the City of Atlanta, Stacey Abrams, Founder & Chair of Fair Fight Action, Andre, Juanita Baranco, Executive Vice President & COO Baranco Automotive Group, John Hope Bryant, Founder, Chair & CEO Operation HOPE, Antwan Patton (BIG BOI) Rapper, Record Producer, Actor, Tyler Perry, Producer, Director, Actor, Writer and Philanthropist.
**About Clark Atlanta University** Established in 1988 by the historic consolidation of Atlanta University (1865) and Clark College (1869). Clark Atlanta University continues a 150-year legacy rooted in African-American tradition and focused on the future. Through global innovation, transformative educational experiences, and high-value engagement. CAU cultivates lifted lives that transform the world. Notable alumni include James Weldon Johnson, American civil rights activist, poet, and songwriter (Lift Every Voice and Sing “The Black National Anthem”; Ralph David Abernathy Sr., American civil rights activist; Congressman Hank Johnson, GA District 4; Kenya Barris, American award-winning television and movie producer.
**Categories:** Global News
---
### [CJF launches Edward Burtynsky Award for Climate Photojournalism](https://df.media/cjf-launches-edward-burtynsky-award-for-climate-photojournalism/)
**Published:** July 27, 2023
**Author:** Daily Finance
**Content:**
TORONTO, Dec. 12, 2022 /CNW/ – The Canadian Journalism Foundation (CJF) today launched the **new Edward Burtynsky Award for Climate Photojournalism**, celebrating provocative, impactful and inspirational climate photography from around the world. The award recognizes a single image that furthers people’s understanding of the causes and effects of the climate.
[](https://web.archive.org/web/20221212223013/https://mma.prnewswire.com/media/1966598/Canadian_Journalism_Foundation_CJF_launches_Edward_Burtynsky_Awa.html)
The winner will receive a $5,000 prize presented at the CJF’s annual Awards ceremony in Toronto.
“The CJF is thrilled to launch this important and timely award named for one of the world’s most renowned photographers,” says CJF President and Executive Director Natalie Turvey. “Understanding and addressing climate change is an issue of paramount importance, and compelling images both help us to understand the scope of the threat and inspire us to act.”
Submissions are open to Canadian professional photojournalists employed by Canadian news outlets or working freelance for a Canadian news organization. **The deadline for submissions is Jan. 20, 2023.**
**Criteria for submissions are as follows:**
- The image must relate to the climate crisis and/or show people impacted by the climate crisis and/or trying to reverse or mitigate climate change;
- Image must have been taken between Jan. 1, 2022, and Dec. 31, 2022;
- Submissions must be from a professional photojournalist employed by a Canadian news organization, or from a Canadian freelance photojournalist published by a Canadian news outlet;
- Applicants must include a description of the image (maximum of 250 words) with their submission); and
- Applicants must include their CV/resume with their submissions.
Each applicant is restricted to one submission.
“I am so pleased to be part of launching this important new award with the Canadian Journalism Foundation,” says Edward Burtynsky. “The power of the photographic image at this point in time is undeniable and it represents an integral opportunity for the intersection of art, storytelling and scientific discourse as we seek to recognize excellence and impact where the climate crisis is concerned. I look forward to celebrating the photographers who have focussed their lens on this subject matter.”
This award is generously supported by **Marci McDonald and Clair Balfour** and **Lisa Balfour Bowen.**
*Cision is the exclusive distribution partner of the Canadian Journalism Foundation.*
**About the Canadian Journalism Foundation**
Established in 1990, The Canadian Journalism Foundation promotes, celebrates and facilitates excellence in journalism. The foundation runs a prestigious annual awards and fellowship program featuring an industry gala where news leaders, journalists and corporate Canada gather to celebrate outstanding journalistic achievement and the value of professional journalism. Through monthly J-Talks, a public speakers’ series, the CJF facilitates dialogue among journalists, businesspeople, academics and students about the role of the media in Canadian society and the ongoing challenges for media in the digital era. The foundation also fosters opportunities for journalism education, training and research.
**Categories:** Global News
---
### [CIBC donates US$50,000 to support Hurricane Ida relief efforts](https://df.media/cibc-donates-us50000-to-support-hurricane-ida-relief-efforts/)
**Published:** July 27, 2023
**Author:** Daily Finance
**Content:**
TORONTO and CHICAGO, Sept. 3, 2021 /CNW/ – **CIBC** (TSX: CM) (NYSE: CM) announced today it is donating US$50,000 to support Hurricane Ida relief efforts.
“We join our clients and team members across North America in supporting efforts to help those affected by Hurricane Ida, which has caused devastation across several states,” says Michael Capatides, CIBC Group Head, U.S. Region, and President & CEO, CIBC Bank USA. “Our thoughts are with everyone impacted by the hurricane’s destruction.”
Individuals and companies that want to help with the disaster relief efforts are invited to donate to the American Red Cross. Money raised will enable the Red Cross to provide immediate and ongoing relief activities in response to the disaster.
**About CIBC**
CIBC is a leading North American financial institution with 10 million personal banking, business, public sector and institutional clients. Across Personal and Business Banking, Commercial Banking and Wealth Management, and Capital Markets businesses, CIBC offers a full range of advice, solutions and services through its leading digital banking network, and locations across Canada with offices in the United States and around the world.
**Categories:** Global News
---
### [Chongqing Develops Deep Bonds with Macao at the Macao International Travel (Industry) Expo](https://df.media/chongqing-develops-deep-bonds-with-macao-at-the-macao-international-travel-industry-expo/)
**Published:** July 27, 2023
**Author:** Daily Finance
**Content:**
MACAO, China, Oct. 8, 2022 /PRNewswire/ — The 10th Macao International Travel (Industry) Expo (MITE) took place at the Cotai Expo of the Venetian Macao on September 23. A total of 12 units of Chongqing participated in this tourism exhibition, including three districts in Chongqing, Qianjiang, Wulong, and Nanchuan districts, four key tourism enterprises, and four cultural institutions.
Chongqing Cultural and Tourism Delegation strives to enhance the international visibility and reputation of the tourism brand image of “A Land of Natural Beauty, A City with Cultural Appeal” through various forms, such as cultural and tourism theme halls, tourism promotion conferences, Chongqing–Macao exchange, and cooperation symposium, featured cultural performances, and intangible cultural heritage interactive experiences.
At this year’s MITE, Chongqing has set up six booths. Exhibitors brought delicate cultural products, such as Xiushan folding lanterns, Wulong Fairy Mountain black tea, Fuling Caixiang Chinese knots, and Rongchang pottery. Each exhibitor actively conducted on-site sales and negotiations with local specialty food, exquisite cultural and creative products, intangible cultural heritage gifts, and publicity materials.
On the same day, the 2022 Chongqing Tourism Macao Week and Chongqing Tourism Promotion Conference (Macao) were held at the main stage of Hall A, Cotai Expo. Qin Dingbo, deputy director of Chongqing Municipal Commission of Culture and Tourism Development, delivered the opening speech. Qin said that Chongqing and Macao have close exchanges and mutual assistance in culture and tourism. Next, it is hoped that the two places will further strengthen cooperation in hotel management, talent training, tourism law enforcement, cultural and artistic creation, cultural exhibition, cultural heritage protection, and youth research.
At the event, the travel agency companies and tourism marketing enterprises from Chongqing and Macao signed cooperation agreements. For example, Chongqing Wulong Tourism Industry (Group) Co., Ltd. signed a strategic cooperation agreement with Macao Multinational Holdings Group.
Enterprises from Wulong and Nanchuan districts introduced high-quality tourism routes to the guests. Chongqing also presented guests with luxury cultural and tourism gift packages, such as Air Macau round-trip tickets, luxury cruise tickets, hot pot experience tickets, hot spring hotel experience tickets, boutique scenic spot tickets, exquisite creative products, and featured local snacks.
After the conference, the 2022 Chongqing – Macao Cultural and Tourism Exchange and Cooperation Symposium was held in Sicily Hall. More than 40 representatives of the cultural and tourism industry from Chongqing and Macao attended the meeting.
**Categories:** Global News
---
### [CGTN: China urges faster digital, green development among APEC members](https://df.media/cgtn-china-urges-faster-digital-green-development-among-apec-members/)
**Published:** July 27, 2023
**Author:** Daily Finance
**Content:**
BEIJING, Nov. 20, 2022 /PRNewswire/ — The digital economy and green development have become major trends in global economic and social transformation.
Chinese President Xi Jinping urged on Friday for all APEC members to enhance economic and technical cooperation, speed up coordinated digital and green development.
With a combined population of 2.9 billion, the 21 APEC economies account for over 60 percent of the world’s total gross domestic product (GDP) and about half of its trade. The region’s status is globally significant, and achieving coordinated digital and green development is of vital importance.
**Relationship between digital and green economy**
Digitalization and green growth are interdependent and mutually reinforcing, Wang Song, an official at the Office of the Cyberspace Administration of China, said at a press conference on November 7.
Wang made the remark when introducing a white paper titled “Jointly Build a Community with a Shared Future in Cyberspace,” which was issued by China’s State Council Information Office. The paper called for “joint efforts to coordinate the transformation towards digitalization and green growth.”
Digital technology plays an increasingly prominent role in promoting the green economy, Wang added. It is estimated that by 2030, industries in China will reduce carbon emissions by 12.1 billion tonnes thanks to advancements in digital technologies, Wang said.
**China and other APEC members cooperating on digital economy**
China has made the development of the digital economy a national strategy.
The scale of China’s digital economy has ranked second in the world for years, according to the State Council in a report submitted to the National People’s Congress Standing Committee for review on November 28.
Steady progress has also been made in cooperation on the digital economy among China and other APEC economies.
China’s Alibaba Group and the Thailand government signed an agreement in April 2018 in Bangkok which saw the two sides cooperate in e-commerce, digital logistics, tourism and personnel training.
The company in May 2022 launched a data center in Thailand to bolster local businesses’ digital innovation capabilities, according to China’s Ministry of Commerce.
The Philippines and Australia, have also cooperated with Alibaba in retail and logistics, finance and fintechs, digital entertainment and public enterprise services, said the company.
Cooperation in digital payment has also been strengthened. China Unicom said in November that more than six million UnionPay cards have been issued in Southeast Asia since the beginning of this year, an increase of 40 percent year on year.
So far, over 40 million UnionPay cards have been issued in 10 ASEAN countries, among which seven are APEC members.
**China’s green development**
Green growth provides a practical and flexible approach for achieving sustainable development of the world economy.
The 20th National Congress of the Communist Party of China included a call for the country to accelerate the transition to a model of green development, boost green and low-carbon industries, and promote green and low-carbon ways of production and life.
China aims to peak carbon dioxide emissions before 2030 and to achieve carbon neutrality before 2060.
The country’s national carbon market covers about 4.5 billion tonnes of carbon dioxide emissions, making it the largest globally after one year’s operation, said Zhao Yingmin, head of the Chinese delegation to the 27th session of the Conference of Parties to the United Nations Framework Convention on Climate Change on November 8 in Sharm El-Sheikh, Egypt.
China’s biggest maker of electric and hybrid cars, BYD, signed an agreement in September with Thailand’s industrial estate developer WHA Group to build a new electric vehicle (EV) factory in the country with a planned annual production capacity of 150,000 units.
With an aim to grow its EV market in hope of establishing 30 percent of its auto production as EV based, Thailand has introduced a new round of investment and promotion policies to encourage investment in the whole industrial chain of electric vehicles this year, according to the China Council for the Promotion of International Trade in February.
BYD’s entry into Thailand will help its auto industry move closer to that goal, as well as help the country become a global hub for EV manufacturing, said WHA’s co-founder and chairman Jareeporn Jarukornsakul.
The automaker hoped its EV technology will contribute to the country’s EV industry, said Liu Xueliang, the general manager of BYD Asia-Pacific Auto Sales Division.
China has urged its businesses to integrate green development throughout the overseas investment and cooperation, according to a guideline issued by China’s Ministry of Commerce and Ministry of Ecology and Environment in 2021.
**Categories:** Global News
---
### [Cboe Global Markets Reports Trading Volume for December and Full Year 2022](https://df.media/cboe-global-markets-reports-trading-volume-for-december-and-full-year-2022/)
**Published:** July 27, 2023
**Author:** Daily Finance
**Content:**
CHICAGO, Jan. 5, 2023 /PRNewswire/ — Cboe Global Markets, Inc. (Cboe: CBOE), a leading provider of global market infrastructure and tradable products, today reported December monthly and full year 2022 trading volume statistics and projected rate per contract/net revenue capture for the fourth quarter of 2022 across its global business lines.
The data sheet “Cboe Global Markets Monthly Volume & RPC/Net Revenue Capture Report” contains an overview of certain December and full year 2022 trading statistics and market share by business segment, volume in select index products, and full quarter RPC/net capture, which is reported on a one-month lag, across business lines.
| **Average Daily Trading Volume (ADV) by Month** | **Year-To-Date** |
|---|---|
| | | | | | | | | |
| **Dec 2022** | **Dec 2021** | **%Chg** | **Nov2022** | **%** **Chg** | **Dec2022** | **Dec2021** | **%** **Chg** |
| Multiply-listed options (contracts, k) | 10,615 | 9,888 | 7.4 % | 11,657 | -8.9 % | 10,784 | 10,084 | 6.9 % |
| Index options (contracts, k) | 3,222 | 2,282 | 41.2 % | 3,266 | -1.4 % | 2,847 | 1,971 | 44.5 % |
| Futures (contracts, k) | 191 | 240 | -20.5 % | 183 | 4.4 % | 218 | 230 | -5.3 % |
| U.S. Equities – On-Exchange (matched shares, mn) | 1,345 | 1,441 | -6.7 % | 1,508 | -10.8 % | 1,614 | 1,621 | -0.4 % |
| U.S. Equities – Off-Exchange (matched shares, mn) | 70 | 78 | -10.7 % | 89 | -21.3 % | 90 | 83 | 9.0 % |
| Canadian Equities1 (matched shares, k) | 152,571 | 34,588 | 341.1 % | 136,248 | 12.0 % | 91,769 | 49,391 | 85.8 % |
| European Equities (€, mn) | 8,522 | 7,602 | 12.1 % | 10,689 | -20.3 % | 10,829 | 7,698 | 40.7 % |
| Cboe Clear Europe Cleared Trades2 (k) | 95,464 | 105,787 | -9.8 % | 121,563 | -21.5 % | 1,493,270 | 1,244,185 | 20.0 % |
| Cboe Clear Europe Net Settlements2 (k) | 821 | 908 | -9.5 % | 859 | -4.4 % | 10,341 | 9,940 | 4.0 % |
| Australian Equities3 (AUD, mn) | 661 | 656 | 0.8 % | 741 | -10.8 % | 784 | N/A | |
| Japanese Equities3 (JPY, bn) | 59 | 114 | -48.0 % | 111 | -46.2 % | 143 | N/A | |
| Global FX ADNV ($, mn) | 35,870 | 30,268 | 18.5 % | 42,844 | -16.3 % | 40,906 | 33,892 | 20.7 % |
| 1Canadian Equities data include MATCHNow and NEO from June 2022 onwards. Before June 2022 it included MATCHNow only. “Net capture per 10,000 touched shares” refers to transaction fees divided by the product of one-ten thousandth ADV of shares for NEO and MATCHNow and the number of trading days for the period. |
|---|
| 2 Cboe Clear Europe figures are totals (not ADV) for the months and years-to-date. |
| 3 Australian Equities and Japanese Equities data reflects Cboe’s acquisition of Cboe Asia Pacific (formerly Chi-X Asia Pacific) effective on July 1, 2021. |
**December 2022 and Full Year Trading Volume Highlights**
**U.S. Options**
- Total options volume was 3.4 billion contracts in 2022, the third consecutive record-breaking year.
- Total options ADV reached a new all-time high of 13.6 million contracts traded per day in 2022.
- Total index options volume set a new annual record of 714.7 million contracts in 2022.
- For the year, a record 558.4 million S&P 500 Index (SPX) options contracts were traded, with an ADV of 2.2 million contracts, beating the previous high of 371.3 million contracts in 2018.
- ADV for SPX options with zero days to expiry increased 83 percent throughout 2022 and comprised 43 percent of overall SPX volumes in December.
- Trading in SPX options during Global Trading Hours (GTH) set a new annual volume record of 9.4 million contracts, up 194 percent from the previous record in 2021.
- Total volume in Mini-S&P 500 Index (XSP) options surpassed 1.4 million in December, with an ADV of 68,000 contracts, the highest month since February 2020.
- MSCI® EAFE® Index (MXEA) options set a new annual volume record with 496,000 contracts traded in 2022, up 27 percent from the previous record in 2021.
**Global FX**
- Spot ADNV set a new annual volume record of $40.0 billion.
- Spot Full Amount ADNV closed the year out at $12.3 billion.
- Non-Deliverable Forwards (NDF) ADNV reached a new all-time yearly high of $880 million.
**European Equities and Derivatives**
- Cboe BIDS Europe, Cboe’s European block trading platform, had a 36 percent share of the LIS (large-in-scale) market, a record high for market share and making it the largest platform of its type for the ninth successive month (Source: big xyt).
- Cboe Europe Derivatives traded 3,647 contracts in December, a record monthly figure and beating the previous high of 2,688 contracts in November 2022.
**Fourth-Quarter 2022 RPC/Net Revenue Capture Guidance**
The projected RPC/net capture metrics for the fourth quarter of 2022 are estimated, preliminary and may change. There can be no assurance that our final RPC for the three months ended December 31, 2022, will not differ materially from these projections.
| *(In USD unless stated otherwise)* | | **Three-Months Ended** |
|---|---|---|
| **Product:** | **4Q Projection** | **Nov-22** | **Oct-22** | **Sep-22** |
| Multiply-Listed Options (per contract) | **0.061** | 0.062 | 0.064 | 0.061 |
| Index Options | **0.877** | 0.883 | 0.892 | 0.896 |
| Total Options | **0.249** | 0.252 | 0.252 | 0.242 |
| Futures (per contract) | **1.693** | 1.686 | 1.703 | 1.700 |
| U.S. Equities – Exchange (per 100 touched shares) | **0.024** | 0.023 | 0.023 | 0.023 |
| U.S. Equities – Off-Exchange (per 100 touched shares) | **0.112** | 0.109 | 0.111 | 0.114 |
| Canadian Equities (per 10,000 touched shares) | **CAD 3.97** | CAD 4.08 | CAD 4.18 | CAD 4.32 |
| European Equities (per matched notional value) | **0.222** | 0.222 | 0.224 | 0.229 |
| Australian Equities (per matched notional value) | **0.142** | 0.145 | 0.166 | 0.168 |
| Japanese Equities (per matched notional value) | **0.265** | 0.259 | 0.255 | 0.259 |
| Global FX (per one million dollars traded) | **2.693** | 2.658 | 2.676 | 2.692 |
| Cboe Clear Europe Fee per Trade Cleared | **0.008** | 0.008 | 0.008 | 0.008 |
| Cboe Clear Europe Net Fee per Settlement | **1.005** | 0.997 | 0.972 | 0.902 |
The above represents average revenue per contract (RPC) or net capture is based on a three-month rolling average, reported on a one-month lag. For Options and Futures, the average RPC represents total net transaction fees recognized for the period divided by total contracts traded during the period for options exchanges: BZX Options, Cboe Options, C2 Options and EDGX Options; futures include contracts traded on Cboe Futures Exchange, LLC (CFE). For U.S. Equities, “net capture per 100 touched shares” refers to transaction fees less liquidity payments and routing and clearing costs divided by the product of one-hundredth ADV of touched shares on BZX, BYX, EDGX and EDGA and the number of trading days for the period. For U.S. Equities – Off-Exchange, “net capture per 100 touched shares” refers to transaction fees less OMS/EMS costs and clearing costs divided by the product of one-hundredth ADV of touched shares on BIDS Trading and the number of trading days for the period. For Canadian Equities, “net capture per 10,000 touched shares” refers to transaction fees divided by the product of one-ten thousandth ADV of shares for MATCHNow and the number of trading days for the period and includes revenue from NEO from June 2022. For European Equities, “net capture per matched notional value” refers to transaction fees less liquidity payments in British pounds divided by the product of ADNV in British pounds of shares matched on Cboe Europe Equities and the number of trading days. For Australian Equities, “net capture per matched notional value” refers to transaction fees less liquidity payments in Australian Dollars divided by the product of ADNV in Australian Dollars of shares matched on Cboe Australia and the number of trading days. For Japanese Equities, “net capture per matched notional value” refers to transaction fees less liquidity payments in Japanese Yen divided by the product of ADNV in Japanese Yen of shares matched on Cboe Japan and the number of trading days. For Cboe Clear Europe, “Fee per Trade Cleared” refers to clearing fees divided by number of non-interoperable trades cleared and “Net Fee per Settlement” refers to settlement fees less direct costs incurred to settle divided by the number of settlements executed after netting. For Global FX, “net capture per one million dollars traded” refers to transaction fees less liquidity payments, if any, divided by the Spot and SEF products of one-thousandth of ADNV traded on the Cboe FX Markets and the number of trading days, divided by two, which represents the buyer and seller that are both charged on the transaction. Average transaction fees per contract can be affected by various factors, including exchange fee rates, volume-based discounts and transaction mix by contract type and product type.
**About Cboe Global Markets, Inc.** Cboe Global Markets (Cboe: CBOE), a leading provider of market infrastructure and tradable products, delivers cutting-edge trading, clearing and investment solutions to market participants around the world. The company is committed to operating a trusted, inclusive global marketplace, providing leading products, technology and data solutions that enable participants to define a sustainable financial future. Cboe provides trading solutions and products in multiple asset classes, including equities, derivatives, FX and digital assets, across North America, Europe and Asia Pacific.
| **Media Contacts** | | **Analyst Contact** |
|---|---|---|
| **Angela Tu** | **Tim Cave** | | **Kenneth Hill, CFA** | |
| +1-646-856-8734 | +44 (0) 7593-506-719 | | +1-312-786-7559 | |
| | | | | |
CBOE-V
*Cboe®, Cboe Global Markets®, Cboe Volatility Index®, VIX® and XSP®are registered trademarks and Cboe Futures ExchangeSM is a service mark of Cboe Exchange, Inc. or its affiliates. Standard & Poor’s®, S&P®, SPX®, and S&P 500® are registered trademarks of Standard & Poor’s Financial Services, LLC, and have been licensed for use by Cboe Exchange, Inc. All other trademarks and service marks are the property of their respective owners.*
*Any products that have the S&P Index or Indexes as their underlying interest are not sponsored, endorsed, sold or promoted by Standard & Poor’s or Cboe and neither Standard & Poor’s nor Cboe make any representations or recommendations concerning the advisability of investing in products that have S&P indexes as their underlying interests. All other trademarks and service marks are the property of their respective owners.*
*Cboe Global Markets, Inc. and its affiliates do not recommend or make any representation as to possible benefits from any securities, futures or investments, or third-party products or services. Cboe Global Markets, Inc. is not affiliated with S&P. Investors should undertake their own due diligence regarding their securities, futures, and investment practices. This press release speaks only as of this date. Cboe Global Markets, Inc. disclaims any duty to update the information herein.*
*Nothing in this announcement should be considered a solicitation to buy or an offer to sell any securities or futures in any jurisdiction where the offer or solicitation would be unlawful under the laws of such jurisdiction. Nothing contained in this communication constitutes tax, legal or investment advice. Investors must consult their tax adviser or legal counsel for advice and information concerning their particular situation.*
*Cboe Global Markets, Inc. and its affiliates make no warranty, expressed or implied, including, without limitation, any warranties as of merchantability, fitness for a particular purpose, accuracy, completeness or timeliness, the results to be obtained by recipients of the products and services described herein, or as to the ability of the indices referenced in this press release to track the performance of their respective securities, generally, or the performance of the indices referenced in this press release or any subset of their respective securities, and shall not in any way be liable for any inaccuracies, errors. Cboe Global Markets, Inc. and its affiliates have not calculated, composed or determined the constituents or weightings of the securities that comprise the third-party indices referenced in this press release and shall not in any way be liable for any inaccuracies or errors in any of the indices referenced in this press release.*
*Options involve risk and are not suitable for all market participants. Prior to buying or selling an option, a person should review the Characteristics and Risks of Standardized Options (ODD), which is required to be provided to all such persons. Copies of the ODD are available from your broker or from The Options Clearing Corporation, 125 S. Franklin Street, Suite 1200, Chicago, IL 60606.*
*Futures trading is not suitable for all investors and involves the risk of loss. That risk of loss can be substantial and can exceed the amount of money deposited for a futures position. You should, therefore, carefully consider whether futures trading is suitable for you in light of your circumstances and financial resources. You should put at risk only funds that you can afford to lose without affecting your lifestyle. For additional information regarding futures trading risks, see the Risk Disclosure Statement set forth in Appendix A to CFTC Regulation 1.55(c) and the Risk Disclosure Statement for Security Futures Contracts.*
***Cautionary Statements Regarding Forward-Looking Information***
*This press release contains forward-looking statements within the meaning of the Private Securities Litigation Reform Act of 1995 that involve a number of risks and uncertainties. You can identify these statements by forward-looking words such as “may,” “might,” “should,” “expect,” “plan,” “anticipate,” “believe,” “estimate,” “predict,” “potential” or “continue,” and the negative of these terms and other comparable terminology. All statements that reflect our expectations, assumptions or projections about the future other than statements of historical fact are forward-looking statements. These forward-looking statements, which are subject to known and unknown risks, uncertainties and assumptions about us, may include projections of our future financial performance based on our growth strategies and anticipated trends in our business. These statements are only predictions based on our current expectations and projections about future events. There are important factors that could cause our actual results, level of activity, performance or achievements to differ materially from those expressed or implied by the forward-looking statements.*
*We operate in a very competitive and rapidly changing environment. New risks and uncertainties emerge from time to time, and it is not possible to predict all risks and uncertainties, nor can we assess the impact of all factors on our business or the extent to which any factor, or combination of factors, may cause actual results to differ materially from those contained in any forward-looking statements.*
*Some factors that could cause actual results to differ include: the impact of the novel coronavirus (“COVID-19”) pandemic, including changes to trading behavior broadly in the market; the loss of our right to exclusively list and trade certain index options and futures products; economic, political and market conditions; compliance with legal and regulatory obligations; price competition and consolidation in our industry; decreases in trading or clearing volumes, market data fees or a shift in the mix of products traded on our exchanges; legislative or regulatory changes or changes in tax regimes; our ability to protect our systems and communication networks from security risks, cybersecurity risks, insider threats and unauthorized disclosure of confidential information; increasing competition by foreign and domestic entities; our dependence on and exposure to risk from third parties; fluctuations to currency exchange rates; factors that impact the quality and integrity of our indices; our ability to operate our business without violating the intellectual property rights of others and the costs associated with protecting our intellectual property rights; our ability to attract and retain skilled management and other personnel; our ability to minimize the risks, including our credit and default risks, associated with operating a European clearinghouse; our ability to accommodate trading and clearing volume and transaction traffic, including significant increases, without failure or degradation of performance of our systems; misconduct by those who use our markets or our products or for whom we clear transactions; challenges to our use of open source software code; our ability to meet our compliance obligations, including managing potential conflicts between our regulatory responsibilities and our for-profit status; our ability to maintain BIDS Trading as an independently managed and operated trading venue, separate from and not integrated with our registered national securities exchanges; damage to our reputation; the ability of our compliance and risk management methods to effectively monitor and manage our risks; our ability to manage our growth and strategic acquisitions or alliances effectively; restrictions imposed by our debt obligations and our ability to make payments on or refinance our debt obligations; our ability to maintain an investment grade credit rating; impairment of our goodwill, long-lived assets, investments or intangible assets; and the accuracy of our estimates and expectations. More detailed information about factors that may affect our actual results to differ may be found in our filings with the SEC, including in our Annual Report on Form 10-K for the year ended December 31, 2021 and other filings made from time to time with the SEC.*
*We do not undertake, and we expressly disclaim, any duty to update any forward-looking statement whether as a result of new information, future events or otherwise, except as required by law. Readers are cautioned not to place undue reliance on these forward-looking statements, which speak only as of the date hereof.*
**Categories:** Global News
---
### [Cathay Pacific Airways selects Sabre’s agile fares solutions to ensure the right market position as the carrier eyes future recovery](https://df.media/cathay-pacific-airways-selects-sabres-agile-fares-solutions-to-ensure-the-right-market-position-as-the-carrier-eyes-future-recovery/)
**Published:** July 27, 2023
**Author:** Daily Finance
**Content:**
SOUTHLAKE, Texas, Feb. 21, 2022 /PRNewswire/ — **Sabre Corporation** (NASDAQ: SABR), a leading software and technology provider that powers the global travel industry, today announced a new agreement with Cathay Pacific Airways, to enable the carrier to achieve strategic pricing and intelligent offer creation in today’s complex and dynamic travel marketplace.
Sabre’s AirVision Fares Manager and Fares Optimizer bring together integrated end-to-end automation and intelligence to fares management by incorporating publicly available competitor fare benchmarking and automating fare rule adjustments, empowering analysts to make astute pricing decisions in an effort to drive incremental revenue opportunities. Fares Manager helps airlines by proactively detecting and automatically suggesting responses to competitive price changes by optimizing and publishing fares and rules with minimal latency. Meanwhile, Fares Optimizer empowers airlines to utilize booking and shopping data to understand purchase behaviour and optimize fares based on demand, price sensitivity and competition.
“It’s essential to be able to mine real time market data to respond dynamically to market conditions while taking into account customer segmentation, demand, willingness to pay and competition,” said Cathay Pacific General Manager, Revenue Management Navin Chellaram. “As the industry looks to recovery, we want to ensure we move forward with the right technology partner to modernise our fares management model, enhance our business processes and offer our customers the right fares every time.”
Moving to Sabre’s agile pricing solutions will enable Cathay Pacific Airways, Hong Kong’s home carrier which is a founding member of the oneworld® global alliance to transition to a robust, cloud-based fares solution.
“At Sabre, we are resolutely focused on technological transformation,” said Rakesh Narayanan, Vice President, Regional General Manager, Asia Pacific, Travel Solutions Airline Sales, “so we’re thrilled to be able to support Cathay as they embark on their technological advancement journey. There are many factors that need to come into play to accelerate recovery in the industry and, for all airlines, it’s essential they have the right technological tools in their armoury to enable them to offer the most attractive, competitive fares amid dynamic market conditions.”
**About Sabre Corporation**
Sabre Corporation is a leading software and technology company that powers the global travel industry, serving a wide range of travel companies including airlines, hoteliers, travel agencies and other suppliers. The company provides retailing, distribution and fulfilment solutions that help its customers operate more efficiently, drive revenue and offer personalized traveler experiences. Through its leading travel marketplace, Sabre connects travel suppliers with buyers from around the globe. Sabre’s technology platform manages more than $260B worth of global travel spend annually. Headquartered in Southlake, Texas, USA, Sabre serves customers in more than 160 countries around the world.
**Categories:** Global News
---
### [Caris Life Sciences to Showcase Research with Leading Cancer Centers at ASCO Genitourinary Cancers Symposium 2023 Reflecting Its Commitment to Improving Outcomes for Patients](https://df.media/caris-life-sciences-to-showcase-research-with-leading-cancer-centers-at-asco-genitourinary-cancers-symposium-2023-reflecting-its-commitment-to-improving-outcomes-for-patients/)
**Published:** July 26, 2023
**Author:** Daily Finance
**Content:**
*Research results from five studies across three solid tumor types demonstrate the impact of Caris’ approach to molecular profiling across the continuum of cancer care*
IRVING, Texas, Feb. 13, 2023 /PRNewswire/ — Caris Life Sciences®(Caris), the leading molecular science and technology company actively developing and delivering innovative solutions to revolutionize healthcare, today announced that the company and partners within the Caris Precision Oncology Alliance™ (POA) will collectively present five studies across three tumor types at the 2023 American Society of Clinical Oncology (ASCO) Genitourinary Cancers Symposium, February 16-18, 2023 in San Francisco (Tabletop #50).
[](https://web.archive.org/web/20230213223016/https://mma.prnewswire.com/media/830740/Caris_Life_Sciences_Logo.html)
“We are proud of the growing number of collaborative abstracts accepted for presentation at ASCO GU, demonstrating the power of Caris’ comprehensive molecular profiling and the large-scale collaboration between POA sites,” said Chadi Nabhan, M.D., MBA, FACP, Chairman of the Caris Precision Oncology Alliance. “The findings represent important observations in prostate, urothelial, and renal cancers, which could lead to novel treatment strategies and knowledge that improve patient outcomes.”
“At Caris, our goal is to enable clinicians to make the best treatment choices for their patients, researchers to discover new targets, and the biopharmaceutical industry to develop the next breakthrough medicines,” said David Spetzler, M.S., Ph.D., MBA, President and Chief Scientific Officer of Caris. “These presentations show how our physicians, scientists and partners in the POA are leveraging real-world clinical evidence from over 455,000 lifetime cases in Caris’ unique AI-driven platform to deepen our understanding of cancer. These foundational discoveries provide key insights into advanced cancer and support the development of precision oncology approaches in advanced genitourinary tumors to better serve cancer patients.”
Poster presentations include:
- **Clinical and Molecular Features of *ATM* and *BRCA2* Mutations in Metastatic Prostate Cancer. (Poster Number: J8)** February 16, 11:30 AM – 1:00 PM PST
- **The Genomic Landscape of Urothelial Carcinoma with High and Low *ERBB2*/HER2 Expression. (Poster Number: M18)** February 17, 12:30 – 2:00 PM PST
- **Characterization and Impact of Wnt5A Signaling on Outcomes of Urothelial Carcinoma. (Poster Number: N3)** February 17, 12:30 – 2:00 PM PST
- **Exploration of Immunosuppressive Features of the Tumor Microenvironment within Hepatic and Non-Hepatic Tumors of Urothelial Origin. (Poster Number: N5)** February 17, 12:30 – 2:00 PM PST
- **Characterization of FOLH1 Expression in Renal Cell Carcinoma (RCC). (Poster Number: K8)** February 18, 7:00 – 8:00 AM PST
Poster and abstract summaries highlighting this research will be available onsite at Caris’ Tabletop #50. The full abstracts will be available through the official ASCO website February 13.
The Caris Precision Oncology Alliance includes 77 cancer centers and academic institutions in the United States and beyond. These institutions have early access to the extensive database and artificial intelligence platform within Caris to establish evidence-based standards for cancer profiling and molecular testing in oncology. By leveraging the comprehensive genomic, transcriptomic and proteomic data available through Caris molecular profiling, Caris seeks to provide this network with the ability to prioritize therapeutic options and determine which clinical trial opportunities may benefit their patients. POA members are also able to integrate with a growing portfolio of biomarker directed trials sponsored by biopharma. Additionally, as a member of the POA, institutions have access to Caris CODEai™, the most comprehensive data solution in the industry with cancer treatment information and real-world clinical outcomes evidence for over 350,000 patients covering over 1 million data points per patient.
**About Caris Life Sciences**
Caris Life Sciences® (Caris) is the leading molecular science and technology company actively developing and delivering innovative solutions to revolutionize healthcare and improve patient outcomes. Through comprehensive molecular profiling (Whole Exome and Whole Transcriptome Sequencing) and the application of advanced artificial intelligence (AI) and machine learning algorithms, Caris has created the large-scale clinico-genomic database and cognitive computing needed to analyze and unravel the molecular complexity of disease. This information provides an unmatched resource and the ideal path forward to conduct the basic, fundamental research to accelerate discovery for detection, diagnosis, monitoring, therapy selection and drug development to improve the human condition.
With a primary focus on cancer, Caris’ suite of market-leading molecular profiling offerings assesses DNA, RNA and proteins to reveal a molecular blueprint that helps patients, physicians and researchers better detect, diagnose and treat patients. The company’s latest advancement, Caris Assure™, is a blood-based, circulating nucleic acids sequencing (cNAS) assay that combines comprehensive molecular analysis (Whole Exome and Whole Transcriptome Sequencing from blood) and serial monitoring – making it the most powerful liquid biopsy assay ever developed.
Headquartered in Irving, Texas, Caris has offices in Phoenix, New York, Tokyo, Japan and Basel, Switzerland. Caris provides services throughout the U.S., Europe, Asia and other international markets.
**Categories:** Global News, Science
---
### [Carnival Corporation, Jabil Launch Consumer Wearable Production Line in the Caribbean](https://df.media/carnival-corporation-jabil-launch-consumer-wearable-production-line-in-the-caribbean/)
**Published:** July 26, 2023
**Author:** Daily Finance
**Content:**
SANTO DOMINGO, Dominican Republic, Dec. 20, 2021 /PRNewswire/ — Two of Florida’s most prominent companies – Carnival Corporation & plc (NYSE/LSE: CCL; NYSE: CUK), and Jabil, Inc. (NYSE: JBL) – today announced they are partnering to launch the first Experience Internet of Things consumer wearables manufacturing and fulfillment location in the Florida/Caribbean region.
[](https://web.archive.org/web/20221130211839/https://mma.prnewswire.com/media/1713952/IMG_4408.html)
Santo Domingo, the capital city of the Dominican Republic, is the site of the first Princess Medallion® device manufacturing facility outside of Asia, as Carnival Corporation adds production capacity support for its Caribbean cruises while also boosting economic development by supporting the more than 600 jobs at Jabil’s Dominican Republic facility.
“The proximity of Jabil’s state-of-the-art facilities and factory automation along with its exceptional track record across consumer, medical and military device manufacturing gives us a tremendous opportunity to support the increased demand for our experiential IoT wearables and also support good-paying jobs in the Dominican Republic in the highly desirable sector of travel and tourism,” said John Padgett, chief experience and innovation officer for Carnival Corporation. “This development also reflects the continuation of Carnival Corporation’s impressive investments throughout the Caribbean to stimulate economic growth and prosperity across the region.”
Launched in 2017, the revolutionary Medallion wearable contains a proprietary blend of communication technologies and enables the world’s first interactive guest experience platform transforming vacation travel on a large scale into a highly personalized level of customized service.
Currently available on ships from Princess Cruises, MedallionClass vacations leverage the innovation within the Medallion to enable touchless embarkation and disembarkation, frictionless commerce and keyless stateroom entry, as well as dynamic way-finding on board, family and friends locator, first-run movies on the go, an interactive events and activities planner, and interactive gaming.
The quarter-sized, 1.8-ounce wearable disc has no discernible technology – no on-off switch, no recharge needed, no menu to navigate, and is waterproof, heat- and cold-resistant and sand- and salt-proof. The Medallions are emblazoned with the cruise line’s logo and each disc is laser-etched with the guest’s name, name of their ship and sail date.
Inside the Medallion are two microscopic antennas – one utilizing Near Field Communication (NFC) and one utilizing Bluetooth Low Energy (BLE). The device seamlessly syncs with an invisible Experiential Internet of ThingsTM (xIoTTM) network of readers, sensors and edge computing devices that recognize individual guests in locations throughout the ships and facilitate experiences for them based on location, personal information they provide and onboard interactions.
The Medallion wearables are being produced in Jabil’s 60,000-square-foot manufacturing facility in Bajos de Haina’s PIISA Industrial Park, part of the area’s fast-growing free trade zone. Medallions produced and fulfilled at the Dominican Republic location will ship to Miami for distribution to guests sailing Princess MedallionClass vacations in the Caribbean.
“Jabil is excited about this new partnership with Carnival Corporation and confident that our manufacturing solutions in one of our newest sites will meet the needs of this world-class wearable that elevates the Princess Cruises guest experience,” said Mike Mahaz, vice president of global business units at Jabil. “Our facility in Santo Domingo is the ideal location to support this exciting new product, given its proximity and high-caliber talent pool.”
In addition to the new manufacturing initiative, Princess Cruises is also growing the number of ship visits to the Dominican Republic during the 2021-22 season by 250%, compared to 2019.
**About Carnival Corporation & plc** Carnival Corporation & plc is one of the world’s largest leisure travel companies with a portfolio of nine of the world’s leading cruise lines sailing to all seven continents. With operations in North America, Australia, Europe and Asia, its portfolio features Carnival Cruise Line, Princess Cruises, Holland America Line, Seabourn, P&O Cruises (Australia), Costa Cruises, AIDA Cruises, P&O Cruises (UK) and Cunard.
**About Princess Cruises:** One of the best-known names in cruising, Princess Cruises is the world’s leading international premium cruise line and tour company operating a fleet of 14 modern cruise ships, carrying two million guests each year to 380 destinations around the globe, including the Caribbean, Alaska, Panama Canal, Mexican Riviera, Europe, South America, Australia/New Zealand, the South Pacific, Hawaii, Asia, Canada/New England, Antarctica, and World Cruises. In 2017 Princess Cruises, with parent company Carnival Corporation, introduced MedallionClass Vacations enabled by the Princess Medallion, the vacation industry’s most advanced wearable device, provided free to each guest sailing on a MedallionClass ship. The award-winning innovation offers the fastest way to an effortless personalized vacation giving guests more time to do the things they love most. The company is part of Carnival Corporation & plc. (NYSE/LSE: CCL; NYSE:CUK).
**About Jabil:** Jabil (NYSE: JBL) is a manufacturing solutions provider with over 260,000 employees across 100 locations in 30 countries. The world’s leading brands rely on Jabil’s unmatched breadth and depth of end-market experience, technical and design capabilities, manufacturing know-how, supply chain insights and global product management expertise. Driven by a common purpose, Jabil and its people are committed to making a positive impact on their local community and the environment.
**Categories:** Global News
---
### [Castlelake and Chesswood Announce Forward Flow Purchase Agreement for Equipment Loan and Lease Receivables](https://df.media/castlelake-and-chesswood-announce-forward-flow-purchase-agreement-for-equipment-loan-and-lease-receivables/)
**Published:** July 26, 2023
**Author:** Daily Finance
**Content:**
MINNEAPOLIS and TORONTO, March 16, 2022 /PRNewswire/ — Castlelake L.P. (“Castlelake”), a global alternative investment manager with 17 years of experience investing in asset-rich opportunities, and Chesswood Group Limited (TSX: CHW), a specialty finance company with 40 years of experience in the commercial equipment finance market, today announced an agreement for the forward purchase of diversified equipment loan and lease receivables originated by Chesswood subsidiaries Pawnee Leasing Corporation and Tandem Finance Inc.
[](https://web.archive.org/web/20221130203909/https://mma.prnewswire.com/media/1686581/Castlelake_Logo.html)
Through the agreement, vehicles managed by Castlelake will acquire up to $400 million of small ticket equipment loan and lease receivables. The funds from the forward flow agreement are expected to enable Chesswood’s subsidiaries to continue growing originations alongside market demand by providing off-balance sheet funding for loan originations.
“We are pleased to partner with the management of Chesswood, Pawnee and Tandem as they continue to expand their well-established equipment financing footprint with small and medium-sized business across the U.S.,” said Armin Rothauser, Partner, Lending at Castlelake. “We believe this agreement enables us to help meet the need for capital in a growing market, support the continued growth of an experienced market participant and provide interesting exposure to our investors.”
“The industry consolidation that has taken place over the past decade in U.S. small and mid-size equipment finance has created a unique growth opportunity for both Pawnee Leasing and Tandem Finance,” said Jeff Fields, Chief Executive Officer of Chesswood Capital Management. “Castlelake’s expertise in equipment finance and focus on asset-rich, cash-flowing opportunities make them an ideal partner for the Chesswood Group of Companies.”
“We are excited to announce this transaction as we continue to grow our equipment finance volumes in the United States. This agreement expands on our strategic initiatives which seek to diversify revenue and earnings streams for Chesswood Group,” said Ryan Marr President & CEO of Chesswood Group.
Castlelake’s specialty finance experience spans more than $3 billion of investments across more than 3,500 commercial and industrial loans and over 5 million consumer receivable accounts. The Chesswood team has originated and serviced equipment loan and lease contracts across the credit spectrum through multiple credit cycles, including the global financial crisis and the COVID-19 pandemic.
**About Castlelake, L.P.**
Castlelake, L.P. is a global alternative investment manager focused on investments in real assets, specialty finance and aviation. Founded in 2005, Castlelake manages approximately $21 billion of assets. The Castlelake team comprises more than 200 experienced professionals, including 89 investment professionals, across six offices in North America, Europe and Asia.
**About Chesswood Group Limited**
Through three wholly-owned subsidiaries in the United States and five subsidiaries in Canada, Chesswood Group Limited is a North American specialty finance company publicly traded on the Toronto Stock Exchange. Colorado-based Pawnee Leasing Corporation, founded in 1982, finances a highly diversified portfolio of commercial equipment leases and loans through relationships with over 600 brokers in the United States. Tandem Finance Inc. provides commercial equipment financing in the U.S. through the equipment vendor channel.
Based in Toronto, Canada, Chesswood Group Limited’s shares trade on the TSX under the symbol CHW.
**Categories:** Finance, Global News
---
### [Canfor Increasing Production Capacity and Diversifying with Acquisition of Millar Western Assets](https://df.media/canfor-increasing-production-capacity-and-diversifying-with-acquisition-of-millar-western-assets/)
**Published:** July 26, 2023
**Author:** Daily Finance
**Content:**
VANCOUVER, BC, Dec. 16, 2021 /CNW/ – Canfor Corporation (TSX: CFP) is announcing that it has entered into an agreement with Millar Western Forest Products Ltd. (“Millar Western”) to acquire the company’s solid wood operations and associated tenure for $420 million, including $56 million in working capital. The purchase price represents a multiple of 3 times 2020 and 2021 average EBITDA. Canfor expects to generate at least $25 million in annual synergies principally related to alignment with the Company’s marketing programs and operational enhancements.
[](https://web.archive.org/web/20221126164607/https://mma.prnewswire.com/media/1712028/Canfor_Corporation_Canfor_Increasing_Production_Capacity_and_Div.html)
Millar Western’s solid wood operations, located in Alberta, Canada, will add 630 million board feet of production capacity and have access to a globally competitive, high-quality timber supply. The assets consist of three well-capitalized operations including two sawmill complexes in Whitecourt and Fox Creek and the high-value, specialty Spruceland Millworks facility in Acheson that is dedicated to serving strategic markets and generates higher, more stable returns.
“The acquisition of Millar Western’s solid wood operations, including the highly successful Spruceland Millworks facility, is well aligned with Canfor’s strategy to grow and diversify our global operating platform. We are excited to expand our Alberta operations to meet the growing demand of our customers for high-quality and sustainable wood products,” said Don Kayne, President & CEO, Canfor. “We look forward to welcoming Millar Western’s dedicated and skilled employees to the Canfor team.”
Canfor anticipates financing this transaction with cash and liquidity on hand. The transaction is expected to close in the first quarter of 2022 and is subject to customary closing conditions including regulatory approvals.
**Forward Looking Statements**
Certain statements in this press release constitute “forward-looking statements” which involve known and unknown risks, uncertainties and other factors that may cause actual results to be materially different from any future results, performance or achievements expressed or implied by such statements. Words such as “expects”, “anticipates”, “projects”, “intends”, “plans”, “will”, “believes”, “seeks”, “estimates”, “should”, “may”, “could”, and variations of such words and similar expressions are intended to identify such forward-looking statements. These statements are based on management’s current expectations and beliefs and actual events or results may differ materially. There are many factors that could cause such actual events or results expressed or implied by such forward-looking statements to differ materially from any future results expressed or implied by such statements. Forward-looking statements are based on current expectations and Canfor assumes no obligation to update such information to reflect later events or developments, except as required by law.
*Canfor is a leading integrated forest products company based in Vancouver, British Columbia (“BC”) with interests in BC, Alberta, North and South Carolina, Alabama, Georgia, Mississippi, Arkansas and Louisiana, as well as in Sweden with 70% interest in Vida Group. Canfor produces primarily softwood lumber and also owns a 54.8% interest in Canfor Pulp Products Inc., which is one of the largest global producers of market Northern Bleached Softwood Kraft Pulp and a leading producer of high performance kraft paper.*
**Categories:** Finance, Global News
---
### [Can the Lingering Effects of a Mild Case of COVID-19 Change Your Brain](https://df.media/can-the-lingering-effects-of-a-mild-case-of-covid-19-change-your-brain/)
**Published:** July 26, 2023
**Author:** Daily Finance
**Content:**
***Study Finds Brain Changes in People with Anxiety, Depression Symptoms***
MINNEAPOLIS, Feb. 20, 2023 /PRNewswire/ — People with long COVID who experience anxiety and depression months after a mild case of COVID-19 may have brain changes that affect the function and structure of the brain, according to a preliminary study released February 20, 2023, that will be presented at the American Academy of Neurology’s 75th Annual Meeting being held in person in Boston and live online from April 22-27, 2023.
“There is still much to learn about long COVID, which includes a wide range of health problems, including anxiety and depression, months after infection,” said Clarissa Yasuda, MD, PhD, of the University of Campinas in São Paulo, Brazil. “Our findings are concerning, as even people with a mild case of COVID-19 are showing changes in their brains months later. More studies are needed to hopefully identify treatments to prevent any long-term effects on people’s quality of life.”
The study involved 254 people with an average age of 41 who had a mild COVID-19 infection an average of three months earlier. Participants completed tests to assess symptoms of depression and anxiety. A total of 102 people had symptoms of both anxiety and depression and 152 people had no symptoms.
Participants also had brain scans. Researchers looked at damage to the brain’s gray matter to determine if there was brain shrinkage. They also compared the brain scans of the people with COVID-19 with the scans of 148 people who did not have a COVID-19 infection.
The people with COVID-19 and anxiety and depression had shrinkage in the limbic area of the brain, which plays a role in memory and emotional processing, while the people who had COVID-19 without anxiety and depression and the people without COVID-19 had no brain shrinkage.
Researchers also looked at brain function and changes in connectivity—how the brain communicates—between areas of the brain. Using a special type of software to analyze brain networks with resting-state brain activity, they looked at 84 people from the asymptomatic group, 70 people from the anxiety and depression group, and 90 people who did not have COVID-19.
Researchers found that the group with both symptoms of anxiety and depression had widespread functional changes in each of the 12 networks that were tested, while the group without symptoms showed changes in only five networks.
“Our results suggest a severe pattern of changes in how the brain communicates as well as its structure, mainly in people with anxiety and depression with long COVID syndrome, which affects so many people,” Yasuda added. “The magnitude of these changes suggests that they could lead to problems with memory and thinking skills, so we need to be exploring holistic treatments even for people mildly affected by COVID-19.”
A limitation of the study was that symptoms of anxiety and depression were self-reported, so people may have misjudged or misreported symptoms.
The study was supported by the São Paulo Research Foundation.
When posting to social media channels about this research, we encourage you to use the American Academy of Neurology’s Annual Meeting hashtag #AANAM.
The American Academy of Neurology is the world’s largest association of neurologists and neuroscience professionals, with over 38,000 members. The AAN is dedicated to promoting the highest quality patient-centered neurologic care. A neurologist is a doctor with specialized training in diagnosing, treating and managing disorders of the brain and nervous system such as Alzheimer’s disease, stroke, migraine, multiple sclerosis, concussion, Parkinson’s disease and epilepsy.
**Categories:** Global News
---
### [Brewing a strong future in Ontario: Labatt invests $145 million in sustainability and innovation](https://df.media/brewing-a-strong-future-in-ontario-labatt-invests-145-million-in-sustainability-and-innovation/)
**Published:** July 26, 2023
**Author:** Daily Finance
**Content:**
*$52.6 million is dedicated to the London brewery to help fund the introduction of the sustainable KeelClip™ packaging technology*
LONDON, ON, Nov. 18, 2021 /CNW/ – Labatt Breweries of Canada is fueling Ontario’s economic recovery with a $145 million stimulus, which includes significant sustainability enhancement and efficiency upgrades to its London brewery. The investment in Ontario is part of a larger $461.5 million Canada-wide capital program that runs from 2019-2022.
[](https://web.archive.org/web/20221126162048/https://mma.prnewswire.com/media/1692550/Labatt_Breweries_of_Canada_Brewing_a_strong_future_in_Ontario__L.html)
Both Ontario and London will benefit from the investment, with $52.6 million going directly into Labatt’s London brewery to fund line upgrades, enhancements, and sustainable innovations. A substantial portion of the investment will finance the implementation of the KeelClip™– a new technology which uses a sustainable, fibre paperboard packaging system instead of plastic.
The innovative solution uses a high-tech automated packaging system, which will enable the London brewery to eliminate more than 52,000kg of plastic by early 2022. Once the technology is implemented in Montreal and London, the solution will help eliminate more than 152,000kgs — that’s more than the weight of 117 mid-size cars of plastic no longer going into the landfill. Once the KeelClip is underway across other Labatt operations, this investment is projected to further cut Labatt’s single-use and recyclable plastics by a total of 242,000kg by 2024.
The remainder of the $145 million investment will go towards non-brewery operations across the province including distribution and technology enhancements, and commercial initiatives. This investment will not only help accelerate the province’s post-COVID economic recovery, but it will also lead to a significant reduction in single-use plastic, showcasing the company’s commitment to London and the province of Ontario.
“This is a key investment for Labatt; it represents our dedication to supporting a robust economy in Ontario, which is underpinned by sustainable innovations that future generations can count on. We’re proud to have introduced North America’s first KeelClip technology and we’re now delighted to bring its sustainability benefits to our London brewery and massively minimize plastic waste at a crucial time for the environment,” says Alex Martel, London Brewery Senior General Manager, Labatt Breweries of Canada.
“Since day one, our government has been committed to making Ontario a more attractive investment destination and today’s announcement by Labatt helps prove that it’s working,” said Vic Fedeli, Ontario’s Minister of Economic Development, Job Creation and Trade. “By lowering taxes, reducing electricity costs, and cutting red tape, we’ve reduced burdens on Ontario businesses by $7 billion every year so innovators and job creators like Labatt can make investments that go toward new Ontario Made ideas and products that will drive real economic growth for the next generation.”
“Of Ontario’s waste, 22 million pounds of plastic ends up in our Great Lakes annually, so cutting plastic out of the equation is fantastic news for our communities and natural environment,” said David Piccini, Minister of the Environment, Conservation and Parks. “Labatt’s leadership and commitment to the sustainability of their products is an excellent example of Ontario businesses working towards green, clean growth. This will have a real impact as we work together to reduce plastic waste in Ontario and leave our planet a better place for future generations.”
“I am very pleased to see such a strong endorsement for doing business in Ontario, and especially in London, from one of our most esteemed local businesses,” said Jeff Yurek, MPP for Elgin–Middlesex–London and Parliamentary Assistant to the Minister of Economic Development, Job Creation and Trade. “This is great news for the region at a time when our economy is preparing to recover and grow.”
Labatt has been brewing at its hometown brewery in London, Ontario, and operating in the province for 174 years with a total investment of $1.125 billion between 2011-2021. The company has a longstanding history of substantial investments in its brewing operations and in supporting national, provincial and local economies across Canada.
“Ontario has long been home to our London brewery, and this investment showcases our commitment to operating in the province for years to come. As we make these sustainability upgrades, we are working to future proof our brewery, and strongly position ourselves for responsible growth and expansion opportunities,” says Martel.
**About Labatt Breweries of Canada**
Labatt Breweries of Canada has been one of Canada’s most respected companies for close to 175 years with roots back to 1847 in London, Ontario, when a farmer named John Kinder Labatt first entered the business of brewing. Since then, the company has grown to include seven key breweries from coast-to-coast, as well as four craft breweries, 75 brands and over 3,600 skilled craftspeople and professionals. We know that we’re only as strong as the communities where we live and work, and we’ve been making positive contributions since before Confederation. Today, that dedication to supporting Canadian communities, which includes our many responsible drinking and environmental sustainability programs, is summed up in our dream to Bring People Together for a Better World. Our employees are the driving force behind these efforts, rising to the challenge time and time again to lend a hand. And with their dedication to supporting their fellow Canadians matched only by their passion for brewing Canada’s best-loved beers, we know that Labatt is here to stay.
**Categories:** Global News
---
### [Braxia Scientific Reports Q3 2022 Financial Results; Company Leads in Psychedelic Research, Access and Therapist Training with First Multi-Dose Psilocybin Trial in Canada](https://df.media/braxia-scientific-reports-q3-2022-financial-results-company-leads-in-psychedelic-research-access-and-therapist-training-with-first-multi-dose-psilocybin-trial-in-canada/)
**Published:** July 26, 2023
**Author:** Daily Finance
**Content:**
- Achieved milestone with the start of landmark psilocybin clinical trial in Q3 2021- more than a dozen patients receive initial dose to date in first-ever Health Canada-approved, multi-dose psilocybin clinical trial in Canada
- Braxia Scientific funded psilocybin trial establishes psilocybin treatment framework for patients with Treatment Resistant Depression (TRD), provides patients immediate access to psychedelic treatments, and training for new therapists providing psilocybin-assisted therapy
- Clinics administer ~5,500 ketamine treatments to date across growing patient base in Canada
TORONTO, March 1, 2022 /PRNewswire/ – Braxia Scientific Corp. (“Braxia Scientific”, or the “Company”), (CSE: BRAX) (OTC: BRAXF) (FWB: 4960), a medical research company with clinics providing innovative ketamine treatments for persons with depression and related disorders, today announced the filing of its fiscal third-quarter results for the three-month period ending December 31, 2021. Complete financial statements along with related management discussion and analysis can be found in the System for Electronic Document Analysis and Retrieval (SEDAR), the electronic filing system for the disclosure documents of issuers across Canada.
[](https://web.archive.org/web/20221128222002/https://mma.prnewswire.com/media/1757378/Braxia_Scientific_Corp__Braxia_Scientific_Reports_Q3_2022_Financ.html)
“Through our advanced clinical and research platform, Braxia Scientific continues to lead the way as a provider of novel treatments for TRD while also pioneering significant research initiatives, including registered clinical trials, establishing a large base of proprietary data to support potential innovative treatment development,” said Dr. Roger McIntyre, CEO, Braxia Scientific. “We are pleased to be the first group in Canada to offer a multi-dose psilocybin treatment for patients with TRD. Through our clinical trial, we have completed the initial dosing of psilocybin to more than a dozen patients while also providing critical best practices training for medical providers and therapists that will be ready to address the increasing demand for psychedelic- and psilocybin-assisted therapies.”
**Recent Operational Highlights**
**Clinical Access to Ketamine and Psilocybin-Assisted Therapy**
Through its existing clinical footprint in Canada, the Company has continued to experience increasing referrals for its ketamine program with more than 5,500 intravenous ketamine infusions administered to date. Braxia has been managing its increasing patient volume and ensuring care is delivered in a timely manner. The growing demand for treatment provided by Braxia-owned clinics has provided the impetus to expand its infrastructure and footprint to better support communities and address the unmet burden of TRD.
In Canada, the Company will continue to focus on Ontario and Quebec, which have a combined population of more than 23.5 million, and where Braxia already has existing infrastructure.
Through its four multidisciplinary, community-based Canadian clinics, the Company continues to see increased patient referrals and treatments which led to a year-over-year increase in revenue of nearly 13.3% in the third quarter of fiscal 2022.
**Providing Access to Psilocybin-Assisted Therapy in Canada**
Braxia Scientific achieved a significant milestone in November with first patients receiving treatments in first Health Canada-approved multiple-dose psilocybin clinical trial. The trial, which is being sponsored by the Brain and Cognition Discovery Foundation, is being conducted at the Canadian Rapid Treatment Center of Excellence (CRTCE), a wholly owned Braxia subsidiary, and includes adults with TRD as part of major depressive disorder or bipolar disorder, who have not satisfactorily benefited from multiple conventional treatments. This trial is the first Health-Canada approved multi-dose psilocybin trial in Canada that is actively recruiting participants at this time.
Braxia Scientific was able to achieve several hurdles prior to the start of its psilocybin clinical trial including:
- Obtaining a high-quality source of psilocybin meeting all regulatory requirements for human use in clinical research
- Received more than 150 referrals to date for psilocybin-assisted therapy for treatment resistant depression in the first six weeks of opening recruitment
- Received Health Canada and Research Ethics approval for protocols to collect treatment outcome data to allow for further optimization of psilocybin treatment protocols and development of best practice guidelines
- Trained medical and research staff as part of Braxia Institute to provide psilocybin-assisted therapy with high quality safety monitoring. This program includes twenty (20) therapists licensed to practice in Ontario with specialized training in psilocybin-assisted therapy. All therapists were trained by the Braxia Institute and are serving as study therapists for the active psilocybin clinical trial.
- Developed physical space to safely provide psilocybin treatment with a comfortable living room-like environment with appropriate medical and psychological monitoring and protocols
This infrastructure enables Braxia Scientific to provide psilocybin-assisted therapy as part of the current clinical trial, and importantly, if psilocybin is approved in the future, Braxia Scientific is positioned to provide access to psilocybin-assisted therapy treatment for eligible patients immediately.
**Growing Proprietary Research Database:** The Company continues to focus on developing novel ketamine derivatives, Braxia Scientific’s team of researchers also continue to carry out multiple research trials adding to the Company’s large database of proprietary data critical to future drug development efforts.
To date, Braxia Scientific has compiled comprehensive health data from administering approximately 5,500 ketamine treatments at its network of clinics. Additionally, Braxia Scientific’s researchers have published more than 50 ketamine-related manuscripts in peer-reviewed biomedical journals, and the CRTCE, has established a growing database with key clinical outcomes for an ongoing clinical trial evaluating psilocybin-assisted therapy.
**Third Quarter Financial Summary**
The Company’s cash and cash equivalents as of December 31, 2021, was $7.64 million compared with $9.62 million at September 30, 2021.
The Company recorded revenue of $324,902 for the third quarter fiscal 2022, ended December 31, 2021 compared with revenue of $286,841 in the third quarter ended December 31, 2020, reflecting 13.3% increase year-over-year. Revenues consisted primarily of sales from the administering of ketamine infusion treatments at the CRTCE clinics in Ontario.
Net loss for the quarter was $2.52 million including a non-cash share-based compensation expense of $939,240, compared to a net loss of $1.54 million in the third quarter of the prior year period.
Subsequent to the quarter, On January 10, 2022, the Company closed a Private Placement and issued 30,000,000 Common Shares (or Common Share equivalents) and Warrants to purchase up to an aggregate of 30,000,000 Common Shares at a purchase price of $0.10 per Common Share and associated Warrant. Each Warrant will entitle the holder to purchase one Common Share at an exercise price of $0.125 per Common Share for a period of five years following the issuance date. Each Common Share equivalent consists of one pre-funded warrant (a “Pre-Funded Warrant”), which is exercisable for one Common Share at an exercise price of $0.0001 per Common Share and will expire when exercised in full.
**Outlook**
In closing Dr. McIntyre commented, “Looking to the balance of 2022, we are focused on leveraging our core strengths including our established and advanced clinical infrastructure to continue to lead the industry by introducing new and innovative treatment and training programs. We will also build and benefit from our human capital and large proprietary health database to further enhance our intellectual property and develop and acquire new chemical entities for potential co-development.”
**About Braxia Scientific Corp.**
Braxia Scientific is a medical research company with clinics that provide innovative ketamine treatments for persons with depression and related disorders. Through its medical solutions, Braxia aims to reduce the illness burden of brain-based disorders, such as major depressive disorder among others. Braxia is primarily focused on (i) owning and operating multidisciplinary clinics, providing treatment for mental health disorders, and (ii) research activities related to discovering and commercializing novel drugs and delivery methods. Braxia seeks to develop ketamine and derivatives and other psychedelic products from its IP development platform. Through its wholly owned subsidiary, the Canadian Rapid Treatment Center of Excellence Inc., Braxia currently operates multidisciplinary community-based clinics offering rapid-acting treatments for depression located in Mississauga, Toronto, Ottawa, and Montreal.
**ON BEHALF OF THE BOARD**
“Dr. Roger S. McIntyre“
Dr. Roger S. McIntyre
Chairman & CEO
The CSE has not reviewed and does not accept responsibility for the accuracy or adequacy of this release.
**Forward-looking Information Cautionary Statement**
This news release contains forward-looking statements within the meaning of applicable securities laws. All statements that are not historical facts, future estimates, plans, programs, forecasts, projections, objectives, assumptions, expectations, or beliefs of future performance are “forward-looking statements.”
Forward-looking statements include statements about the intended promise of ketamine-based treatments for depression and the potential for ketamine to treat other emerging psychiatric disorders, such as Bipolar Depression. Such forward- looking statements involve known and unknown risks, uncertainties and other factors that may cause actual results, events, or developments to be materially different from any future results, events or developments expressed or implied by such forward-looking statements. Such risks and uncertainties include, among others, the failure of ketamine, psilocybin and other psychedelics to provide the expected health benefits and unanticipated side effects, dependence on obtaining and maintaining regulatory approvals, including acquiring and renewing federal, provincial, municipal, local or other licenses and engaging in activities that could be later determined to be illegal under domestic or international laws. Ketamine and psilocybin are currently Schedule I and Schedule III controlled substances, respectively, under the Controlled Drugs and Substances Act, S.C. 1996, c. 19 (the “CDSA”) and it is a criminal offence to possess such substances under the CDSA without a prescription or a legal exemption. Health Canada has not approved psilocybin as a drug for any indication, however ketamine is a legally permissible medication for the treatment of certain psychological conditions. It is illegal to possess such substances in Canada without a prescription.
These factors should be considered carefully, and readers are cautioned not to place undue reliance on such forward-looking statements.
Although the Company has attempted to identify important risk factors that could cause actual actions, events or results to differ materially from those described in forward-looking statements, there may be other risk factors that cause actions, events or results to differ from those anticipated, estimated or intended. Additional information identifying risks and uncertainties that could affect financial results is contained in the Company’s filings with Canadian securities regulators, including the Amended and Restated Listing Statement dated April 15, 2021. There can be no assurance that forward-looking statements will prove to be accurate, as actual results and future events could differ materially from those anticipated in forward-looking statements.
**Categories:** Global News, Science
---
### [Borr Drilling Limited – Changes to the Board of Directors](https://df.media/borr-drilling-limited-changes-to-the-board-of-directors/)
**Published:** July 26, 2023
**Author:** Daily Finance
**Content:**
HAMILTON, Bermuda, Feb. 7, 2022 /PRNewswire/ — Current Chairman of the Board of Borr Drilling Limited (the “Company”) (OSE: BORR) (NYSE: BORR), Paal Kibsgaard, has today informed the Board that due to other work-related commitments, he will need to step down from his role as Chairman. Mr. Kibsgaard is pleased to continue to serve as a regular Board Member.
The Board has elected Vice Chairman Tor Olav Troim, to be the new Chairman of the Board. Troim was previously Chairman for Borr Drilling from establishment of the Company until 8 October, 2019.
**Categories:** Global News
---
### [Bob Woodruff Foundation Grant to Easter Seals Greater Houston Makes Healing and Growth Possible](https://df.media/bob-woodruff-foundation-grant-to-easter-seals-greater-houston-makes-healing-and-growth-possible/)
**Published:** July 26, 2023
**Author:** Daily Finance
**Content:**
HOUSTON, Jan. 5, 2022 /PRNewswire/ — Easter Seals Greater Houston (ESGH) is proud to have been selected for a grant from The Bob Woodruff Foundation to address urgent needs for veterans, caregivers, and military families. These crucial funds will double the impact thanks to the match from Texas Veterans + Family Alliance administered by Texas Health and Human Services Commission.
[](https://web.archive.org/web/20221130213844/https://mma.prnewswire.com/media/1089637/Easter_Seals_Greater_Houston_Logo.html)
Veteran, Service Member, and Military-Connected Family Program is the nonprofit’s quickest growing sector as Houston has the 2nd highest Veteran population in the country. The Bob Woodruff Foundation’s grant invests in solutions to the immediate needs of the veteran population, while also addressing deeper rooted barriers to their long-term stability; a range of health and wellness needs, including food insecurity, homelessness, and mental health; as well as employment, caregiver support, and meaningful social connection.
The grant will empower ESGH’s program to continue its mission of assisting Veterans, Service Members, and military-connected families in building the lives they want during and after the military to meet their needs around reintegration, stability, wellness, and growth. With support from the Bob Woodruff Foundation, ESGH will continue supporting veterans like Chet Falkenhainer, a Navy Veteran that served from 1988-1997. He earned 3 combat action ribbons along with 2 Navy Commendation Medals with “Combat V” device for valor on each. After the military, he had anger issues and misused alcohol in an attempt to avoid his post-traumatic stress disorder. The ESGH Veteran, Service Member, and Military-Connected Family Program provided Chet Falkenhainer with Accelerated Resolution Therapy and talk therapy. Today he has positive relationships with his mother, wife, and child. He is active through growing his garden, making hot sauces, cooking, and he is always working on a home project. Contact ESGH to learn more about their transformative programs or to speak with Chet Falkenhainer for an interview.
**About Easter Seals Greater Houston** As a lead affiliate in the national network of 67 affiliates in 48 states, ESGH impacts people where they need help most — school, work, home, and in the community — from the critical first five years of life onward. Each year ESGH directly serves over 14,500 people, providing early childhood and therapy services, mental health, employment programs, adult day programs, Military and Veterans’ services, and more.
For children and adults with disabilities, for veterans and seniors, and for families and caregivers through Harris and 13 surrounding counties, ESGH is leading the way to full equity and inclusion through life changing disability and community services. With the help of supporters, they are reducing poverty and addressing financial stability; improving health care and employment, and empowering people of all ages and abilities to be full and equal participants in our community.
**Categories:** Global News
---
### [BLI DEADLINE THIS MONDAY: Robbins Geller Rudman & Dowd LLP Files Class Action Suit Against Berkeley Lights, Inc. and Announces Opportunity for Investors with Substantial Losses to Lead Case](https://df.media/bli-deadline-this-monday-robbins-geller-rudman-dowd-llp-files-class-action-suit-against-berkeley-lights-inc-and-announces-opportunity-for-investors-with-substantial-losses-to-lead-case/)
**Published:** July 26, 2023
**Author:** Daily Finance
**Content:**
SAN DIEGO, Feb. 5, 2022 /PRNewswire/ — The law firm of **Robbins Geller Rudman & Dowd LLP** has filed a class action lawsuit charging Berkeley Lights, Inc. (NASDAQ: BLI) as well as certain of its top executives with violations of the Securities Exchange Act of 1934 and announces that purchasers or acquirers of Berkeley Lights common stock between July 17, 2020 and September 14, 2021, inclusive (the “Class Period”) have until this upcoming Monday, February 7, 2022 to seek appointment as lead plaintiff. Filed on December 8, 2021, the *Berkeley Lights* class action lawsuit is captioned *Ng v. Berkeley Lights, Inc.*, No. 21-cv-09497 (N.D. Cal.).
The plaintiff is represented by Robbins Geller, which has **extensive experience** in prosecuting investor class actions including actions involving financial fraud.
**CASE ALLEGATIONS**: The *Berkeley Lights* class action lawsuit alleges that, throughout the Class Period, defendants made false and misleading statements and failed to disclose that: (i) Berkeley Lights’ flagship instrument, the Beacon, suffered from numerous design and manufacturing defects including breakdowns, high error rates, data integrity issues and other problems, limiting the ability of biotechnology companies and research institutions to consistently use the machines at scale; (ii) Berkeley Lights had received numerous customer complaints regarding the durability and effectiveness of Berkeley Lights’ automation systems, including complaints related to the design and manufacturing; (iii) the actual market for Berkeley Lights’ products and services was a fraction of the $23 billion represented to investors because of, among other things, the relatively high cost of Berkeley Lights’ instruments and consumables and inability to provide the sustained performance necessary to justify these high costs; and (iv) as a result, defendants’ statements to investors during the Class Period regarding Berkeley Lights’ business, operations, and financial results were materially false and misleading.
On September 15, 2021, research analyst firm Scorpion Capital issued a scathing investigative report, titled “Fleecing Customers And IPO Bagholders With A $2 Million Black Box That’s A Clunker, While Insiders and Silicon Valley Bigwigs Race To Dump Stock. Just Another VC Pump at 27X Sales. Target Price: $0,” which criticized Berkeley Lights’ technology and questioned the durability of Berkeley Lights’ most important business relationships and its business growth plan. Although Scorpion Capital stated it was short Berkeley Lights, the information contained in the Scorpion Capital report was purportedly based on extensive proprietary research and analysis, including 24 research interviews with former Berkeley Lights employees, industry scientists, and end users across 14 of Berkeley Lights’ largest customers. Among other findings, the report detailed a “trail of customers who allege they were ‘tricked,’ misled, or over-promised into buying a $2 million lemon” and concluded that the “reality is so far from BLI’s grandiose hype that we believe its product claims and practices may constitute outright fraud.” On this news, the price of Berkeley Lights common stock fell by nearly 30% over two trading days, damaging investors.
**THE LEAD PLAINTIFF PROCESS**: The Private Securities Litigation Reform Act of 1995 permits any investor who purchased Berkeley Lights common stock during the Class Period to seek appointment as lead plaintiff in the *Berkeley Lights* class action lawsuit. A lead plaintiff is generally the movant with the greatest financial interest in the relief sought by the putative class who is also typical and adequate of the putative class. A lead plaintiff acts on behalf of all other class members in directing the *Berkeley Lights* class action lawsuit. The lead plaintiff can select a law firm of its choice to litigate the *Berkeley Lights* class action lawsuit. An investor’s ability to share in any potential future recovery of the *Berkeley Lights* class action lawsuit is not dependent upon serving as lead plaintiff.
**ABOUT ROBBINS GELLER RUDMAN & DOWD LLP**: With 200 lawyers in 9 offices nationwide, Robbins Geller Rudman & Dowd LLP is the largest U.S. law firm representing investors in securities class actions. Robbins Geller attorneys have obtained many of the largest shareholder recoveries in history, including the largest securities class action recovery ever – $7.2 billion – in *In re Enron Corp. Sec. Litig*. The 2020 ISS Securities Class Action Services Top 50 Report ranked Robbins Geller first for recovering $1.6 billion for investors that year, more than double the amount recovered by any other securities plaintiffs’ firm.
**Categories:** Global News
---
### [BGL Announces the Sale of StickerGiant.com, Inc.](https://df.media/bgl-announces-the-sale-of-stickergiant-com-inc/)
**Published:** July 26, 2023
**Author:** Daily Finance
**Content:**
CHICAGO, Oct. 7, 2021 /PRNewswire/ — Brown Gibbons Lang & Company (BGL) is pleased to announce the sale of StickerGiant.com, Inc. (StickerGiant), to Resource Label Group, LLC (Resource Label), a portfolio company of Ares Management Corporation. The specific terms of the transaction were not disclosed.
[](https://web.archive.org/web/20221126153545/https://mma.prnewswire.com/media/1655470/Deal_Linkedin_StickerGiant_2021.html)
The transaction furthers BGL’s market-leading position in the digitally native B2B eCommerce space.
The transaction furthers BGL’s market-leading position in B2B eCommerce and as a trusted advisor to custom printing companies. StickerGiant’s fast-growing, short-run custom printing platform provides a digitally native solution for small and medium-sized businesses and strengthens BGL’s Consumer Investment Banking Group’s leadership in the digitally native B2B eCommerce space.
Created by John Fischer in 2000 as one of the first online sticker companies, StickerGiant has evolved into an industry leader in the eCommerce custom label and sticker manufacturing channel by providing an amazing customer experience, fast-turnaround, and high-quality products. Based in Longmont, CO, StickerGiant was ranked #6 on the 2020 list of “Best Places to Work” by the *Denver Business Journal*, and in the same year, was named the Manufacturer of the Year in the advanced manufacturing and machining category of the Colorado Manufacturing Awards. Known for its quick-turn model, StickerGiant is committed to producing most sticker and label product orders within 24-48 hours.
BGL’s Consumer Group has an extensive track record in mergers and acquisitions advisory and capital-raising services spanning the entire consumer spectrum, with deep experience in branded consumer and eCommerce investment banking. BGL’s Consumer investment bankers offer market-leading technical expertise, positioning strategies, and growth-oriented projection models to ensure branded and managed marketplace eCommerce DTC & B2B platforms are optimally positioned. The team focuses on providing market participants with expert insights into the trends influencing their business and helping them identify and harvest strategic opportunities in an increasingly complex marketplace.
**About Brown Gibbons Lang & Company**
Brown Gibbons Lang & Company (BGL) is a leading independent investment bank and financial advisory firm focused on the global middle market. The firm advises private and public corporations and private equity groups on mergers and acquisitions, divestitures, capital markets, financial restructurings, valuations and opinions, and other strategic matters. BGL has investment banking offices in Chicago, Cleveland, and Philadelphia, and real estate offices in Chicago, Cleveland, and San Antonio. The firm is also a founding member of Global M&A Partners, enabling BGL to service clients in more than 30 countries around the world. Securities transactions are conducted through Brown, Gibbons, Lang & Company Securities, Inc., an affiliate of Brown Gibbons Lang & Company LLC and a registered broker-dealer and member of FINRA and SIPC.
**About Resource Label Group**
Resource Label Group, LLC is a leading pressure sensitive label, shrink sleeve and RFID/NFC manufacturer with diverse product offerings for the food, beverage, chemical, household products, personal care, nutraceutical, pharmaceutical, medical device, and technology industries. With twenty-one manufacturing locations across the U.S. and Canada, Resource Label Group, LLC provides national leadership and scale to deliver capabilities, technologies, systems, and creative solutions that customers require. Headquartered in Franklin, TN, Resource Label Group, LLC employs over 1600 associates in the U.S. and Canada. Resource Label Group is a portfolio company of Ares Management Corporation.
[](https://web.archive.org/web/20221126153545/https://mma.prnewswire.com/media/805620/BGL_Logo.html)

**Categories:** Global News
---
### [BETTERWARE REPORTS FOURTH QUARTER AND FISCAL YEAR 2021 RESULTS](https://df.media/betterware-reports-fourth-quarter-and-fiscal-year-2021-results/)
**Published:** July 26, 2023
**Author:** Daily Finance
**Content:**
GUADALAJARA, Mexico, Feb. 10, 2022 /PRNewswire/ — Betterware de Mexico S.A.P.I. de C.V. (NASDAQ: BWMX), (“Betterware” or the “Company”), announced today its consolidated financial results for the fourth quarter and fiscal year 2021. The figures presented in this report are expressed in nominal Mexican Pesos (Ps.) unless otherwise noted, presented and approved by the Board of Directors, prepared in accordance with IFRS, and may include minor differences due to rounding. The Company notes that its financial year of 2021 consisted of 52 weeks while the financial year of 2020 consisted of 53 weeks. The additional week during the financial year of 2020 occurred during the fourth quarter. The Company will host a webcast presentation and conference call at 9:00 am (Eastern Time) on February 11, 2022, to discuss its results for the financial year of 2021.
[](https://web.archive.org/web/20221128210223/https://mma.prnewswire.com/media/1744534/Betterware_Earnings_Release.html)
**Key Highlights of 2021**
- **Strengthened network of associates and distributors.**
- **Net Revenue +41% YoY growth and EBITDA +33% YoY growth vs. comparable weeks in 2020.**
- **Strong balance sheet and cash flow allow for continued dividend payments.**
- **Acquisition of JAFRA´s operations in Mexico and the United States.**
Luis G. Campos, Executive Chairman of the Board, stated, “Betterware achieved extraordinary growth from 1Q 2020 to 1Q 2021, mainly driven by our increase in our average associates and distributors base of 183%. This translated into exceptional performance in net revenue and EBITDA. While it was quite a positive result, it turned comparisons with respect to 2020 challenging. Despite a much higher base, 2Q 2021 and 3Q 2021 showed strong YoY growth and traction in net revenues, of 81% and 4% respectively. As for 4Q 2021, on top of the harder comparison base, our business was impacted by a sluggish consumer in Mexico and by external factors related to supply chain disruptions prevailing globally, which resulted in a decline in net revenues and EBITDA for the quarter.
On an annual perspective, after undergoing a full year of consolidation of our sales network during 2021 and proactively dealing with external impacts, we are pleased with our performance, which led to a 41% growth in net revenue and a 33% growth in EBITDA vs. comparable weeks in 2020 and a 27.9% EBITDA margin.
We have proven once again our ability to adapt and capitalize on business opportunities as they emerge and transform them into consistent value generation for our shareholders. Going forward, we will continue executing our strategy based on our three business pillars: product innovation, business intelligence and technology. We start 2022 with a strengthened network of distributors and associates, confident of Betterware´s profitable growth in the years to come, which will lead us to reach our target of 40% household penetration in Mexico by 2025.
Aligned to our long-term agenda, the compelling acquisition of JAFRA, a world leading brand of Direct Selling in the Beauty and Personal Care (B&PC) products industry with a strong presence in Mexico and the United States, announced last month, will contribute towards product diversification, our international expansion strategy, acceleration of profit growth, and acceleration of our digital transformation, while maintaining a low leverage ratio. For Betterware the best is yet to come.”
***Luis G. Campos* Executive Chairman of the Board**
**FY 2021 Results**
| **Metric** | **Amount$ in million** | **Variation(Comparable number of Weeks)** | **Comment** |
|---|---|---|---|
| **Net Revenue** | Ps. $10,039.7 | +41% vs. comparable 2020+225% vs. 2019 | · Growth of average associates and distributors base. · Higher activity rates vs. historical average. |
| **Gross Margin** | 56.2% | +151 bps vs. 2020 | · Margin expansion reflects efficient cost management despite freight cost pressures. |
| **EBITDA** | Ps. $2,798.5 | +33% vs. comparable 2020+229% vs. 2019 | · Growth in net revenues. · Partially offset by higher operating expenses due to revamped operating structure to support increased new level of operations and higher air and sea freight costs. |
| **EBITDA Margin** | 27.9% | (193 bps) vs. 2020 | · Same as EBITDA. |
| **Net Income** | Ps. $1,826.8 | +440% vs. 2020+287% vs. 2019 | · Net income in 2020 negatively impacted by non-cash expenses related to Warrants. |
| **EPS** | Ps. $49.41 | +398% vs. 2020 | · Same as Net Income |
Betterware´s main task for 2021 was to consolidate our distributors and associates’ base, after achieving extraordinarily high triple digit growth in a short period of time, from 1Q 2020 to 1Q 2021.
During the second half of 2021, people initiated the return to their normal lifestyles, leaving behind the worst months of the pandemic. As a result, some of the people that had joined our network during 2020, went back to their customary activities and decided not to continue with Betterware, thus resulting on a higher-than-average churn rate for associates peaking at 4.6% a week (vs historical average churn rate of 2.8% a week) and a consequent mild decline in our average network of associates and distributors.
In addition to keeping most of the sales network added, we managed to improve its KPIs by maintaining weekly activity at ~34% for associates and ~80% for distributors through 2020 and 2021. Furthermore, following 2020’s extraordinary growth, tenure increased versus preceding years, strengthening to our sales network via an adequate mix of seniors and newcomers.
**4Q 2021 Results**
During 4Q 2021 our business was negatively impacted by the following factors:
1. Consumption softened compared to 1H2021, which led to increased promotions
2. Worldwide supply chain disruptions:
- Shortage of sea freight containers led us to increase air freight expenses
- Stricter than expected energy restrains in China impacted our fulfillment capacity
- Sea freights costs continued at abnormally high levels
These impacts led to lower-than-expected total net revenue and EBITDA for the fourth quarter and for 2021.
| **Metric** | **Amount$ in million** | **Variation(Comparable number of Weeks)** | **Comment** |
|---|---|---|---|
| **Net Revenue** | Ps. $2,182.1 | (11%) vs. comparable 4Q 2020+176% vs. 4Q 2019 | · Slightly lower average associates and distributor base vs. 4Q 2020 · Loss of revenue due to factory closures in China. |
| **Gross Margin** | 53.7% | (220 bps) vs. 4Q 2020 | · Increased use of airfreights. · Sea freight costs. |
| **EBITDA** | Ps. $420.8 | (43%) vs. comparable 4Q 2020+85% vs. 4Q 2019 | · Partially impacted by one-time air freight expenses · Increased promotions to incentivize sales due to softer consumption environment. |
| **EBITDA Margin** | 19.3% | (1,173 bps) vs. 4Q 2020 | · Lower operating leverage due to lower volumes · Impacted by increased promotions. |
| **Net Income** | Ps. $214.0 | +322% vs. 4Q 2020+131% vs. 4Q 2019 | · Net income in 4Q 2020 negatively impacted by non-cash expenses related to Warrants. |
| **EPS** | Ps. $5.74 | +309% vs. 4Q 2020 | · Same as Net Income |
**Strong Balance Sheet**
After 4Q 2021, Betterware’s balance sheet reflects a strong financial position:
1. Conservative Net Debt to EBITDA ratio
2. Low Total Debt to Total Assets and
3. Negative cash conversion cycle
The main strengths of the Balance Sheet reflect the company’s differentiated Business Model, which allow the company to have a high cash conversion rate and low liquidity requirements. Betterware´s cost structure allows for relevant operational flexibility to adapt its operation as demand increases or decreases.
**Long-term Growth Expectations**
Since Q3 2021 to date, we have confirmed that:
1. As people went back to their in-person activities, we realized that the “new normal”, which we previously thought would remain, will not last forever.
2. Supply chain disruptions and cost pressures would have a higher impact in our revenues and costs than previously expected.
In response to the above, the company started adjusting its commercial strategies with the objective of increasing its net revenue, EBITDA and free cash flow. These adjustments include, among others:
| **Commercial Actions** |
|---|
| **Pricing Actions** | **Price Mix** | **Catalogue Frequency** | **Hybrid Model** | **Product Innovation** | **Incentives Program** |
| General price increase of 12% to offset cost pressures | Increasing the share of lower-price items in our catalogues | Increased from 9 to 12 per year, providing enhanced flexibility to adapt | Increased in-person interaction with distributors and associates | Increasing share of new products per catalogue, from current 10% to around 20% during 2022 | Increased focus on recruitment and retention of distributors and associates |
To proactively address cost pressures, and in response to the changes in the business environment, the Company is already engaged in the execution of a series of initiatives, including the following:
| **Operational Actions** |
|---|
| **Freight Costs** | **Supply Chain (China)** | **Foreign Exchange** | **Efficiency and Productivity** |
| Signed contracts for 1/3 of our expected shipments for 2022 and 2023 at favorable rates | Accelerating domestic manufacturing plans: 20% local sourcing by year end 2022, from 7% as of 2021 | Cover 100% of our expected US Dollar operating needs. Currently, approx. 85% covered.Covered around 80% of Jafra’s acquisition price. | Achieve operational efficiencies with our automated Pick-and-Pack Tower during 2022 |
As we start 2022 with a much stronger base of distributors and associates, our churn rates are trending towards normal levels, and the company´s operating structure is now sufficient to achieve the expected growth for the oncoming years to reach a 40% household penetration, which should provide for incremental operating leverage as revenues remain growing.
**2022 Guidance**
We remain confident in our ability to navigate well during the year ahead given our strategic advantages and initiatives in place that position our Company to diversify our supply chain, broaden our categories and product offering, as well as retain and grow distributors and associates.
That said, and given the uncertainties still present, we believe it is prudent to provide guidance for fiscal 2022 that includes Net Revenue and EBITDA in line with Fiscal 2021, assuming no significant deterioration in the external environment. This guidance implies that in 2H 2022 we will show YoY growth.
**Dividend**
Aligned to the Company’s ability to generate strong cash flow after investments, its Board of Directors has proposed to pay the fourth installment of its dividend of Ps. 350M, which implies an annualized dividend yield of approximately 8.7%. The 4Q 2021 dividend is subject to approval at the next Ordinary General Shareholders’ Meeting to be held on February 11, 2022.
For the long term, we remain on track to increase our household penetration to reach our target 40% by 2025, while expanding our share of wallet through successful product innovation and increased participation in new market niches.
**JAFRA Acquisition**
On January 18, 2022, Betterware announced the acquisition of JAFRA’s operations in Mexico and the United States, which is considered to be a transformational deal. The transaction is expected to close in 1H 2022, subject to antitrust and regulatory approval in Mexico.
The rationale for the transaction is:
- Acquisition price of US$255mm, equivalent to Ps. 5,355mm, on a debt-free, cash-free basis, to be funded mainly with debt. With implied pre-synergies multiple of ~5.5x 2022E EBITDA, 4.8x 2022E EBITDA considering the mid-point of the synergies.
- Accretive since the first year, expected to add US$0.34/share to EPS in 2022 and over US$45 mm pre-synergies. The EPS and EBITDA added would be US$0.48 and US$54mm, respectively, considering the mid-point of the synergies.
- Increased diversification of Betterware’s current operations by category and by geography, including a faster and more efficient way to enter the vast US market.
- Elevated JAFRA’s revenue growth and profit potential.
- Accelerated digital transformation of JAFRA by leveraging Betterware’s omni-channel capabilities and capitalize on the significant e-commerce opportunity and strong direct selling online market trends.
We are very excited about the acquisition of JAFRA, which reflects our continued assessment of opportunities to build operational and financial efficiencies into our business. We look forward to supporting JAFRA and beginning to implement our strategies once the transaction is authorized and closed.
JAFRA’s know-how and presence in the US market of over 65 years, will pave the way for Betterware to enter the attractive US market by the 2Q 2023 and continue expanding our business.
| **Betterware de México, S.A.P.I. de C.V.** **Consolidated Statements of Financial Position** **As of December 2021, and December 2020** **(In Thousands of Mexican Pesos)** |
|---|
| | **Dec 2021** | **Dec 2020** |
| **Assets** | | |
| Cash and cash equivalents | 1,175,198 | 649,820 |
| Trade accounts receivable, net | 836,744 | 757,806 |
| Accounts receivable from related parties | 24 | – |
| Inventories | 1,339,378 | 1,274,026 |
| Prepaid expenses | 90,104 | 94,501 |
| Derivative financial instruments | 28,193 | – |
| Other assets | 83,105 | 130,417 |
| **Total current assets** | **3,552,746** | **2,906,570** |
| Property, plant and equipment, net | 1,069,492 | 791,127 |
| Right of use assets, net | 17,384 | 24,882 |
| Deferred income tax | – | 17,605 |
| Investment in associates | 497 | – |
| Intangible assets, net | 369,760 | 319,361 |
| Goodwill | 371,075 | 348,441 |
| Other assets | 4,274 | 5,774 |
| **Total non-current assets** | **1,832,482** | **1,507,190** |
| **Total assets** | **5,385,228** | **4,413,760** |
| **Liabilities and Stockholders’ Equity** | | |
| Short term debt and borrowings | 28,124 | 105,910 |
| Accounts payable to suppliers | 1,984,932 | 2,078,628 |
| Accrued expenses | 171,047 | 109,767 |
| Provisions | 115,192 | 151,008 |
| Income tax payable | 101,994 | 85,221 |
| Value added tax payable | – | 26,703 |
| Statutory employee profit sharing | 55,305 | 7,354 |
| Lease liability | 6,102 | 7,691 |
| Derivative financial instruments | – | 295,115 |
| **Total current liabilities** | **2,462,696** | **2,867,397** |
| Employee benefits | 1,506 | 1,678 |
| Derivative financial instruments | – | 25,179 |
| Deferred income tax | 98,515 | 56,959 |
| Lease liability | 11,778 | 16,687 |
| Long term debt and borrowings | 1,482,261 | 523,967 |
| **Total non-current liabilities** | **1,594,060** | **624,470** |
| **Total Liabilities** | **4,056,756** | **3,491,867** |
| | | |
| Stockholders’ Equity | 1,313,817 | 921,893 |
| Non-controlling interest | 14,655 | – |
| **Total Stockholders’ Equity** | **1,328,472** | **921,893** |
| **Total Liabilities and Stockholders’ Equity** | **5,385,228** | **4,413,760** |
| **Betterware de México, S.A.P.I. de C.V.** **Consolidated Statements of Profit or Loss and Other Comprehensive Income** **For the three-months ended on December 31, 2021, and December 31, 2020** **(In Thousands of Mexican Pesos)** |
|---|
| |
| | **Q4 2021** | **Q4 2020** | **∆%** |
|---|---|---|---|
| Net revenue | 2,182,069 | 2,601,167 | (16.1%) |
| Cost of sales | 1,010,815 | 1,147,641 | (11.9%) |
| **Gross profit** | **1,171,254** | **1,453,526** | **(19.4%)** |
| | | | |
| Administrative expenses | 274,051 | 262,696 | 4.3% |
| Selling expenses | 439,824 | 293,681 | 49.8% |
| Distribution expenses | 60,327 | 107,534 | (43.9%) |
| **Total expenses** | **774,202** | **663,911** | **16.6%** |
| **Operating income** | **397,052** | **789,615** | **(49.7%)** |
| | | | |
| Interest expense | (27,503) | (9,426) | 191.8% |
| Interest income | 9,230 | 1,344 | 586.8% |
| Unrealized loss in valuation of financial derivative instruments | (29,808) | (318,362) | (90.6%) |
| Changes in fair value of warrants | – | (266,148) | (100.0%) |
| Foreign exchange gain (loss), net | (8,236) | 5,811 | (241.7%) |
| **Financing cost, net** | **(56,317)** | **(586,781)** | **(90.4%)** |
| | | | |
| **Income before income taxes** | **340,735** | **202,834** | **68.0%** |
| | | | |
| Income taxes | 130,426 | 152,164 | (14.3%) |
| | | | |
| **Net income including minority interest** | **210,309** | **50,670** | **315.1%** |
| **Non-controlling interest loss** | **3,706** | **–** | **(100.0%)** |
| **Net income** | **214,015** | **50,670** | **322.4%** |
| |
| **EBITDA breakdown (Ps. 420.1 million)** |
| **Concept** | **Q4 2021** | **Q4 2020** | **∆%** |
| Net income including minority interest | 210,309 | 50,670 | 315.1% |
| (+) Income taxes | 130,426 | 152,164 | (14.3%) |
| (+) Financing cost, net | 56,317 | 586,781 | (90.4%) |
| (+) Depreciation and amortization | 23,717 | 17,132 | 38.4% |
| **EBITDA** | **420,769** | **806,747** | **(47.8%)** |
| **EBITDA margin** | **19.3%** | **31.0%** | **(11.7%)** |
| **Betterware de México, S.A.P.I. de C.V.** **Consolidated Statements of Profit or Loss and Other Comprehensive Income** **For the twelve months ended on December 31, 2021, and December 31, 2020** **(In Thousands of Mexican Pesos)** |
|---|
| | **Dec 2021** | **Dec 2020** | **∆%** |
| Net revenue | 10,039,668 | 7,260,408 | 38.3% |
| Cost of sales | 4,399,164 | 3,290,994 | 33.7% |
| **Gross profit** | **5,640,504** | **3,969,414** | **42.1%** |
| | | | |
| Administrative expenses | 1,195,509 | 664,677 | 79.9% |
| Selling expenses | 1,264,581 | 853,355 | 48.2% |
| Distribution expenses | 463,779 | 331,023 | 40.1% |
| **Total expenses** | **2,923,869** | **1,849,055** | **58.1%** |
| **Operating income** | **2,716,635** | **2,120,359** | **28.1%** |
| | | | |
| Interest expense | (74,626) | (80,253) | (7.0%) |
| Interest income | 25,872 | 10,930 | 136.7% |
| Unrealized gain (loss) in valuation of financial derivative instruments | 330,315 | (287,985) | (214.7%) |
| Changes in fair value of warrants | – | (851,520) | (100.0%) |
| Foreign exchange gain (loss), net | (319,739) | (30,402) | 951.7% |
| **Financing cost, net** | **(38,178)** | **(1,239,230)** | **(96.9%)** |
| | | | |
| **Income before income taxes** | **2,678,457** | **881,129** | **204.0%** |
| | | | |
| Income taxes | 855,377 | 542,768 | 57.6% |
| | | | |
| **Net income including minority interest** | **1,823,080** | **338,361** | **438.8%** |
| **Non-controlling interest loss** | **3,706** | **–** | **(100.0%)** |
| **Net income** | **1,826,786** | **338,361** | **439.9%** |
| |
| **EBITDA breakdown (Ps. $2,798.5 million)** |
| **Concept** | **Dec 2021** | **Dec 2020** | **∆%** |
| Net income including minority interest | 1,823,080 | 338,361 | 438.8% |
| (+) Income taxes | 855,377 | 542,768 | 57.6% |
| (+) Financing cost, net | 38,178 | 1,239,230 | (96.9%) |
| (+) Depreciation and amortization | 81,905 | 43,688 | 87.5% |
| **EBITDA** | **2,798,540** | **2,164,047** | **29.3%** |
| **EBITDA margin** | **27.9%** | **29.8%** | **(1.9%)** |
| **Betterware de México, S.A.P.I. de C.V.** **Consolidated Statements of Cash Flows** **For the twelve months ended on December 31, 2021, and December 31, 2020** **(In Thousands of Mexican Pesos)** |
|---|
| | **Dec 2021** | **Dec 2020** |
| **Cash flows from operating activities:** | | |
| Profit for the period | 1,823,080 | 338,361 |
| **Adjustments for:** | | |
| Income tax expense recognized in profit of the year | 855,377 | 542,768 |
| Depreciation and amortization of non-current assets | 81,905 | 43,688 |
| Accounting effects for changing reporting period | (22,466) | – |
| Investment in subsidiaries | 10,356 | – |
| Interest income recognized in profit or loss | (25,872) | (10,930) |
| Interest expense recognized in profit or loss | 74,626 | 80,253 |
| Gain of property, plant, equipment sale | – | 9,216 |
| Unrealized (gain)/ loss in valuation of financial derivative instruments | (330,315) | 287,985 |
| Share premium account | (18,304) | 32,910 |
| Changes in fair value of warrants | – | 851,520 |
| **Movements in working capital:** | | |
| Trade accounts receivable | (70,612) | (510,719) |
| Trade accounts receivable from related parties | (16,203) | 610 |
| Inventory, net | (63,114) | (928,472) |
| Prepaid expenses and other assets | 68,913 | (95,532) |
| Accounts payable to suppliers, accrued expenses and provisions | (46,064) | 1,604,591 |
| Provisions | (35,843) | 104,319 |
| Value added tax payable | (32,573) | (3,596) |
| Statutory employee profit sharing | 47,951 | 2,348 |
| Income taxes paid | (779,444) | (526,321) |
| Employee benefits | 411 | (743) |
| **Net cash generated by operating activities** | **1,521,809** | **1,822,256** |
| **Cash flows from investing activities:** | | |
| Investment in associates | (8,811) | – |
| Payments for property, plant and equipment, net | (421,482) | (617,686) |
| Proceeds from disposal of property, plant and equipment, net | 24,409 | 18,270 |
| Restricted cash | – | (42,915) |
| Interest received | 29,853 | 10,930 |
| **Net cash used in investing activities** | **(376,031)** | **(631,401)** |
| **Cash flows from financing activities:** | | |
| Repayment of financial derivative instruments | (18,172) | – |
| Repayment of borrowings | (646,554) | (1,757,112) |
| Proceeds from borrowings | 20,000 | 1,712,207 |
| Long term debt | 1,480,664 | – |
| Interest paid | (49,840) | (121,297) |
| Lease payment | (6,498) | (8,825) |
| Cash received for issuance of shares | – | 250,295 |
| Dividends paid | (1,400,000) | (830,000) |
| **Net cash used in financing activities** | **(620,400)** | **(754,732)** |
| **Net increase in cash and cash equivalents** | **525,378** | **436,123** |
| **Cash and cash equivalents at the beginning of the period** | **649,820** | **213,697** |
| **Cash and cash equivalents at the end of the period** | **1,175,198** | **649,820** |
**Use of Non-IFRS Financial Measures**
This announcement includes certain references to EBITDA, EBITDA Margin, Net Debt:
**EBITDA:** defined as profit for the year adding back the depreciation of property, plant and equipment and right of use assets, amortization of intangible assets, financing cost, net and total income taxes
**EBITDA Margin:** is calculated by dividing EBITDA by net revenues
EBITDA and EBITDA Margin are not measures recognized under IFRS and should not be considered as an alternative to, or more meaningful than, consolidated net income for the year as determined in accordance with IFRS or as indicators of our operating performance from continuing operations. Accordingly, readers are cautioned not to place undue reliance on this information and should note that these measures as calculated by the Company, may differ materially from similarly titled measures reported by other companies.
Betterware believes that these non-IFRS financial measures are useful to investors because (i) Betterware uses these measures to analyze its financial results internally and believes they represent a measure of operating profitability and (ii) these measures will serve investors to understand and evaluate Betterware’s EBITDA and provide more tools for their analysis as it makes Betterware’s results comparable to industry peers that also prepare these measures.
**About Betterware de México, S.A.P.I. de C.V.**
Founded in 1995, Betterware de Mexico is the leading direct-to-consumer company in Mexico focused on creating innovative products that solve specific needs regarding organization, practicality, space saving and hygiene within the household. Betterware’s wide product portfolio includes home organization, kitchen, commuting, laundry and cleaning, as well as other categories that include products and solutions for every corner of the household.
The Company has a differentiated two-tier network of distributors and associates that sell their products through twelve catalogues per year. All products are designed by the Company and under the Betterware brand name through its different sources of product innovation. The Company’s state-of-the-art infrastructure allows it to safely and timely deliver its products to every part of the country, backed by the strategic location of its national distribution center. Today, the Company distributes its products in Mexico and Guatemala, and has plans of additional international expansion.
Supported by its asset light business model and its three strategic pillars of Product Innovation, Business Intelligence and Technology, Betterware has been able to achieve sustainable double-digit growth rates by successfully expanding its household penetration and share of wallet.
**Forward-Looking Statements**
*This press release includes certain statements that are not historical facts but are forward-looking statements for purposes of the safe harbor provisions under the United States Private Securities Litigation Reform Act of 1995. Forward-looking statements generally are accompanied by words such as “believe,” “may,” “will”, “estimate”, “continue”, “anticipate”, “intend”, “expect”, “should”, “would”, “plan”, “predict”, “potential”, “seem”, “seek,” “future,” “outlook”, and similar expressions that predict or indicate future events or trends or that are not statements of historical matters. The reader should understand that the results obtained may differ from the projections contained in this document and that many factors could cause our actual activities or results to differ materially from the activities and results anticipated in forward looking statements. For this reason, the Company assumes no responsibility for any indirect factors or elements beyond its control that might occur inside Mexico or abroad and which might affect the outcome of these projections and encourages you to review the ‘Cautionary Statement’ and the ‘Risk Factor’ sections of our annual report on Form 20-F for the year ended December 31, 2020 and any of the Company’s other applicable filings with the Securities and Exchange Commission for additional information concerning factors that could cause those differences.*
*The Company undertakes no obligation and does not intend to update these forward-looking statements to reflect events or circumstances occurring after the date hereof. You are cautioned not to place undue reliance on these forward-looking statements, which speak only as of the date hereof. Further information on risks and uncertainties that may affect the Company’s operations and financial performance, and the forward statements contained herein, is available in the Company’s filings with the SEC. All forward-looking statements are qualified in their entirety by this cautionary statement.*
**Categories:** Global News
---
### [Benestar Brands, a Highlander Partners Portfolio Company, Announces Acquisition of 4505 Meats](https://df.media/benestar-brands-a-highlander-partners-portfolio-company-announces-acquisition-of-4505-meats/)
**Published:** July 26, 2023
**Author:** Daily Finance
**Content:**
CHARLOTTE, N.C., Feb. 1, 2022 /PRNewswire/ — Benestar Brands, a leading salty snacks company with operations across the US and Mexico, today announced the acquisition of 4505 Meats (“4505”). With a stringent focus on superior ingredients and quality, 4505 has emerged as the leader in the premium pork rinds segment, and is now rapidly expanding into other snack categories. The acquisition adds to Benestar’s expanding roster of brands, including Mac’s, PORQ, Turkey Creek, Pretzilla, Chicas and Cazo de Oro, and bolsters Benestar as the clear leader in the pork rinds and meat snacks markets.
[](https://web.archive.org/web/20221128205303/https://mma.prnewswire.com/media/85592/highlander_partners_logo.html)
4505 was founded by butcher and chef Ryan Farr in the Mission District of San Francisco, where he found chicharrones in many of the small neighborhood markets. Today 4505 is a high growth brand that can be found in leading retailers across the US. 4505’s brand proposition has always centered around prioritizing quality and using all-natural ingredients and responsibly raised meats that lead to a healthier snack. 4505 products are both keto-friendly and paleo-certified and use only humanely raised and antibiotic free (ABF) pork. The Company is continuously focused on innovation as demonstrated by the recently launched new line of premium sausage snacks, 4505 Butcher’s Snacks, which are available in three authentic flavors and packed with 18-24 grams of protein per serving, keto-certified, paleo-friendly and gluten-free.
Bruce Myers, President of Benestar Brands, commented, “We are very excited to be partnering with Ryan, Erik (Havlick, CEO of 4505) and the rest of the 4505 team. 4505 has quickly established itself as one of the most innovative and exciting brands in the salty snack industry.” Erik Havlick, who will continue to lead 4505, added, “Teaming up with Benestar Brands and Highlander Partners represents an exciting new chapter for 4505 Meats, and is perfectly timed at an inflection point for our brand. We believe that joining Benestar Brands will enable 4505 to accelerate even faster as a leader in premium snacks.”
Jeff L. Hull, President and CEO of Highlander Partners, commented, “When we created Benestar, we established an active M&A platform in the salty snack space targeting brands with exceptional growth prospects, unique products and strong brand equity. 4505 fits these criteria perfectly and we are thrilled to welcome 4505 into Benestar.” Jeff Partridge, current Executive Chairman of Benestar and a Partner at Highlander, added, “4505 created the premium pork rind category and established better-for-you standards that previously didn’t exist. This addition to our portfolio of brands couldn’t be a more appropriate fit.”
**About Benestar**
Benestar is a leader in the salty snacks space. The company manufactures pork rinds under the Mac’s, PORQ and Turkey Creek brands. Benestar also manufactures tortilla chips under the Chicas and Cazo de Oro brands and is the leader in pretzel bread and snack segments under the Pretzilla brand. Founded in 1947, the company operates seven production facilities (located in Chicago, IL; Arlington, TX; Portsmouth, OH; City of Industry, CA; Milwaukee WI; and Saltillo, Mexico).
**About Highlander Partners** Highlander Partners, L.P. is a Dallas-based private investment firm with over $2 billion of assets under management. The firm focuses on making investments in businesses in targeted industries in which the principals of the firm have significant operating and investing experience, including basic manufacturing, food, chemicals, consumer products, and others. Highlander Partners uses a buy and build investment approach, creating value by helping companies grow both organically and through acquisitions.

**Categories:** Global News
---
### [Automobile Fuel Injection System Sourcing and Procurement Report | Top Spending Regions, Forecast, Analysis and Market Price Trends | SpendEdge](https://df.media/automobile-fuel-injection-system-sourcing-and-procurement-report-top-spending-regions-forecast-analysis-and-market-price-trends-spendedge/)
**Published:** July 26, 2023
**Author:** Daily Finance
**Content:**
NEW YORK, Dec. 25, 2021 /PRNewswire/ — The Procurement Automobile Fuel Injection System will grow at a **CAGR of 4.40%** by 2024. Prices will **increase by 2%- 5%** during the forecast period and suppliers will have a moderate bargaining power in this market. This report offers key advisory and intelligence to help buyers identify and shortlist the most suitable suppliers for their Procurement Automobile Fuel Injection System requirements.
[](https://web.archive.org/web/20221126150057/https://mma.prnewswire.com/media/1714919/SpendEdge_Automobile_Fuel_Injection.html)
**Procurement Automobile Fuel Injection System Procurement report explains key category management objectives that should form the base for sourcing strategy, including:**
- Top-line growth
- Scalability of inputs
- Green initiatives
- Category innovations
- Supply base rationalization
- Demand forecasting and governance
- Minimalization of ad hoc purchases
- Adherence to regulatory nuances
- Cost savings
- Customer retention
- Reduction of TCO
- Supply assurance
This report evaluates suppliers based on provision for applicable insurance policy, real-time analysis, pipeline software solutions, and conduct pipeline surveys. In addition, suppliers are also shortlisted based on business needs, technical specifications, operational requirements, security compliance, regulatory mandates, legal requirements, quality control, change management procedures, pricing models, penalty clauses, SLA nuances, acceptance criteria, and evaluation criteria.
**Top Selling Report’s Include:**
1. **Asset Recovery Services – Forecast and Analysis:** The asset recovery services will grow at a CAGR of 9.49% during 2021-2025. Asia Asset Recovery Pte Ltd., TES-Amm Singapore Pte Ltd., and Iron Mountain Inc. are among the prominent suppliers in asset recovery services market. Click the above link to download the free sample of this report.
2. **Vulnerability Management Sourcing and Procurement Report:** Vulnerability Management Procurement Market, prices will increase by 4%-6% during the forecast period and suppliers will have a Moderate bargaining power in this market. Click the above link to download the free sample of this report.
3. **Celebrity Talent Management Services – Sourcing and Procurement Intelligence Report:** This report offers key advisory and intelligence to help buyers identify and shortlist the most suitable suppliers for their celebrity talent management services requirements. Click the above link to download the free sample of this report.
**Table of Content**
- **Executive Summary**
- **Market Insights**
- **Category Pricing Insights**
- **Cost-saving Opportunities**
- **Best Practices**
- **Category Ecosystem**
- **Category Management Strategy**
- **Category Management Enablers**
- **Suppliers Selection**
- **Suppliers under Coverage**
- **US Market Insights**
- **Category scope**
**About SpendEdge:
SpendEdge** shares your passion for driving sourcing and procurement excellence. We are the preferred procurement market intelligence partner for 120+ Fortune 500 firms and other leading companies across numerous industries. Our strength lies in delivering robust, real-time procurement market intelligence reports and solutions.
**Categories:** Global News
---
### [As Needed Inhaled Glucocorticoid Plus Usual Controller Therapy Reduces Severe Asthma Exacerbations, Improves Asthma Control in African American & Hispanic/Latinx Patients](https://df.media/as-needed-inhaled-glucocorticoid-plus-usual-controller-therapy-reduces-severe-asthma-exacerbations-improves-asthma-control-in-african-american-hispanic-latinx-patients/)
**Published:** July 26, 2023
**Author:** Daily Finance
**Content:**
PHOENIX, Feb. 26, 2022 /PRNewswire-PRWeb/ — A patient-activated, reliever-triggered inhaled glucocorticoid strategy, combined with usual care, reduces asthma exacerbations and improves asthma control and quality of life in African American and Hispanic/Latinx adult patients with poorly controlled asthma. The results of the Person Empowered Asthma Relief (PREPARE) trial are being presented at the 2022 Annual Meeting of the American Academy of Allergy, Asthma & Immunology (AAAAI) and are being simultaneously published in The New England Journal of Medicine.
The resulting paper, Reliever-Triggered Inhaled Glucocorticoid in Black and Latinx Adults with Asthma, funded by the Patient Centered Outcomes Research Institute through a grant to the Brigham and Women’s Hospital, compared the addition of a patient-activated reliever-triggered inhaled
glucocorticoid strategy (hereafter referred to as intervention group) to usual care alone. The real-world study recruited 603 African American and 598 Hispanic/Latinx patients with clinically diagnosed asthma, aged 18-75 years old. The study was conducted in primary care and specialty practices across the continental United States and in Puerto Rico.
Patients who were recruited had to meet one of the following stipulations: be prescribed daily inhaled glucocorticoids with or without long-acting β2-agonist (LABA) and an Asthma Control Test (ACT) score of 19 or lower, which indicates asthma is not well controlled, or an asthma exacerbation leading to overnight hospitalization or use of systemic glucocorticoids within the past year. The annualized rate of severe asthma exacerbations was used as the primary endpoint in the study. Patients received one instructional visit and monthly questionnaires over a period of 15 months.
The annualized rate of severe asthma exacerbations was 0.69 in the intervention group compared to 0.82 in the usual care group, which translates to a 15.4% lower risk of severe asthma exacerbations in the intervention group. In the intervention group, ACT scores improved 3.4 points compared to 2.5 in the usual care group. Asthma Symptom Utility Index (ASUI) scores, which indicate asthma-related quality of life, also increased by 0.12 points for the intervention group compared to 0.08 points in the usual care group. Additionally, the rate of work/school/usual activity days missed was 13.4 in the intervention group and 16.8 in the usual care group.
“What’s unique about this study is we’ve focused exclusively on patient populations that face significant disparities in asthma outcomes,” said Juan Carlos Cardet, MD, who is presenting this study on behalf of the research team at the AAAAI meeting. Elliot Israel, MD, FAAAAI, Professor of Medicine at Harvard Medical School and the principal investigator and author of the study, pointed out that “the study is particularly important because it involves a simple intervention with low barriers to implementation for providers and patients that does not require changes in the patient’s underlying therapy.”
Patients only needed to attend a single visit for the study, and the effectiveness of the intervention group persisted for 15 months. The strategy being studied with this research could be easy to implement in populations with disproportionately high asthma morbidity, compared to other strategies that require a greater amount of time and resources.
Of the patients in the study, 12.2% experienced serious adverse events. Adverse events were experienced at a similar rate between the two different groups, with the most common adverse events being asthma, infection or infestation, and cardiac events. In the intervention group, 11.8% of participants were hospitalized compared to 11.5% in the usual care group. The study did not find any statistically significant safety signals in the intervention group.
Post hoc analyses were performed looking at medication use and survey results from the study period. The data showed that in the intervention group, patients used 1.1 more inhalers containing inhaled glucocorticoid in a year compared to the usual care group. In the intervention group, patients refilled fewer quick-reliever metered-dose inhalers than usual group patients, and reported fewer months using quick-reliever nebulizers compared to usual care patients.
Research presented at the AAAAI Annual Meeting, February 25-28 in Phoenix, Arizona, is published in an online supplement to The Journal of Allergy and Clinical Immunology.
The American Academy of Allergy, Asthma & Immunology (AAAAI) represents allergists, asthma specialists, clinical immunologists, allied health professionals and others with a special interest in the research and treatment of allergic and immunologic diseases. Established in 1943, the AAAAI has more than 7,100 members in the United States, Canada and 72 other countries. The AAAAI’s Find an Allergist/Immunologist service is a trusted resource to help you find a specialist close to home.
**Categories:** Global News
---
### [ARTIS REAL ESTATE INVESTMENT TRUST RELEASES 2021 ANNUAL RESULTS](https://df.media/artis-real-estate-investment-trust-releases-2021-annual-results/)
**Published:** July 26, 2023
**Author:** Daily Finance
**Content:**
WINNIPEG, MB, March 3, 2022 /CNW/ – Artis Real Estate Investment Trust (“Artis” or the “REIT”) (TSX: AX.UN) (TSX: AX.PR.A) (TSX: AX.PR.E) (TSX: AX.PR.I) announced today its financial results for year ended December 31, 2021. The annual results in this press release should be read in conjunction with the REIT’s consolidated financial statements and Management’s Discussion and Analysis (“MD&A”) for the year ended December 31, 2021. All amounts are in thousands of Canadian dollars, unless otherwise noted.
[](https://web.archive.org/web/20221130210339/https://mma.prnewswire.com/media/1759252/Artis_Real_Estate_Investment_Trust_Artis_Real_Estate_Investment.html)
“This has been a transformational year for Artis. Since we announced our new vision and strategy last March, we’ve made significant progress in all aspects of our Business Transformation Plan”, said Samir Manji, President and CEO of Artis. “The sale of $858.6 million of assets in 2021 was instrumental in providing us with the resources to meaningfully reduce debt and the financial flexibility to execute on our value-investing strategies, which are well under way. Our total debt to gross book value at the end of the year was 42.9%, a significant improvement from 49.3% and net asset value per unit, a key performance indicator for the REIT, increased to $17.37 from $15.03, both on a year-over-year basis. Other components of our strategy, including the allocation of capital to unit buybacks and to accretive development projects continue to be a priority for us and a benefit to our unitholders. We’re pleased with the progress we’ve made so far, but there is a significant amount of work still ahead. We look forward to 2022 with strong conviction in our strategy and optimism for the opportunities that lie ahead.”
**2021 ANNUAL HIGHLIGHTS**
**Business Strategy Update and Board and Management Changes**
- Announced a new vision and strategy to become a best-in-class real estate asset management and investment platform focused on growing net asset value (“NAV”) per unit and distributions for investors through value investing.
- Entered into an agreement with Sandpiper Asset Management, Inc. (“Sandpiper”) to provide certain services to support the REIT’s strategy to acquire meaningful and influential active ownership positions in undervalued publicly-listed real estate entities.
- Appointed Ben Rodney as Chair of the Board of Trustees effective March 9, 2021.
- Appointed Samir Manji as Interim Chief Executive Officer effective January 1, 2021, and subsequently appointed to permanent Chief Executive Officer effective March 9, 2021.
- Appointed Kim Riley to Chief Operating Officer (a newly created position at Artis) effective April 1, 2021, and appointed Jaclyn Koenig to Chief Financial Officer effective May 24, 2021.
- Completed the disposition of the GTA Industrial Portfolio, comprised of 27 industrial properties in the Greater Toronto Area, Ontario, for sale proceeds of $724.3 million. This transaction represented a significant milestone in the implementation of the Business Transformation Plan.
- Announced the REIT’s participation in a consortium that acquired all of the outstanding units of Cominar Real Estate Investment Trust (“Cominar”) for consideration of $11.75 per unit in cash under a Plan of Arrangement (the “Cominar Transaction”). Artis contributed $112.0 million to acquire approximately 32.64% of the total common equity units in the newly formed entity and also acquired $100.0 million of junior preferred units that carry a distribution rate of 18.0% per annum. The Cominar Transaction closed on March 1, 2022.
**Portfolio Activity**
- Disposed of 29 industrial, six office and six retail properties and a portion of a retail property, located in Canada for an aggregate sale price of $858.6 million. These dispositions include the GTA Industrial Portfolio and the REIT’s remaining five office properties located in Calgary, Alberta.
- At December 31, 2021, Artis had a portfolio comprised of two office properties located in the Greater Toronto Area, Ontario under an unconditional sale agreement for a sale price of $35.5 million. The disposition closed January 20, 2022.
- Subsequent to the end of the year, entered into an unconditional sale agreement for an industrial property located in the Greater Toronto Area, Ontario for a sale price of $29.2 million. The disposition is anticipated to close in March 2022.
- Completed the conversion of 2145-2155 Dunwin Drive to commercial condominiums and sold all 21 units for aggregate consideration of $17.9 million.
- Acquired two parcels of industrial development land in the Twin Cities Area, Minnesota. The two parcels of land were purchased for an aggregate price of US$3.7 million.
**Balance Sheet and Liquidity**
- Increased NAV per unit (1) to $17.37 at December 31, 2021, compared to $15.03 at December 31, 2020.
- Improved total debt to GBV (1) to 42.9% at December 31, 2021, compared to 49.3% at December 31, 2020.
- Improved total debt to Adjusted EBITDA (1) to 8.2 at December 31, 2021, compared to 9.1 at December 31, 2020.
- Improved Adjusted EBITDA interest coverage ratio (1) to 3.80 for 2021, compared to 3.48 for 2020.
- Repaid the outstanding face value of the Series C senior unsecured debentures upon maturity in the amount of $250.0 million.
- Utilized the normal course issuer bid (“NCIB”) to purchase 11,137,764 common units at a weighted-average price of $11.29 and 149,188 preferred units at a weighted-average price of $23.36.
- Invested in equity securities for an aggregate cost of $71.9 million.
**Financial and Operational**
- Announced an increase to common unit distributions to $0.60 per unit annually, effective for the March 31, 2021 distribution payable on April 15, 2021.
- Declared a special distribution of $2.39 per common unit (the “Special Distribution”) comprised of $0.32 per common unit payable in cash and $2.07 per common unit payable in common units. Immediately following the issuance of the common units pursuant to the Special Distribution, the outstanding common units of Artis were consolidated such that each common unitholder holds, after the consolidation, the same number of common units as such common unitholder held before the Special Distribution.
- Reported a conservative AFFO payout ratio (1) of 61.5% for 2021, compared to 52.9% for 2020.
- Reported FFO per unit (1) of $1.34 for 2021, compared to $1.41 for 2020, and reported AFFO per unit (1) of $0.96 for 2021, compared to $1.02 for 2020.
- Same Property NOI (1) in Canadian dollars for 2021 decreased 4.1% compared to 2020.
- Reported portfolio occupancy of 89.4% (91.5% including commitments) at December 31, 2021, compared to 90.6% (92.2% including commitments) at December 30, 2020.
- Renewals totalling 1,920,609 square feet and new leases totalling 690,839 square feet commenced during 2021.
- Weighted-average rental rate on renewals that commenced during 2021 increased 4.1%.
| (1) Represents a non-GAAP measure, ratio or other supplementary financial measure. Refer to the Notice with Respect to Non-GAAP & Supplementary Financial Measures Disclosure. |
|---|
**BALANCE SHEET AND LIQUIDITY**
The REIT’s balance sheet highlights and metrics, are as follows:
| | **December 31,** | | **December 31,** |
|---|---|---|---|
| | **2021** | | **2020** |
| | | | | | |
| Total investment properties | $ | 3,999,609 | | $ | 4,531,847 |
| Unencumbered assets | 1,902,748 | | 1,901,073 |
| NAV per unit (1) | | 17.37 | | | 15.03 |
| Total debt to GBV (1) | 42.9 % | | 49.3 % |
| Total debt to Adjusted EBITDA (1) | | 8.2 | | | 9.1 |
| Adjusted EBITDA interest coverage ratio (1) | | 3.80 | | | 3.48 |
| Unencumbered assets to unsecured debt (1) | 2.20 | | 1.73 |
| (1) Represents a non-GAAP measure, ratio or other supplementary financial measure. Refer to the Notice with Respect to Non-GAAP & Supplementary Financial Measures Disclosure. |
|---|
At December 31, 2021, NAV per unit was $17.37, increased from $15.03 at December 31, 2020. Artis’ debt metrics improved during 2021 and the REIT reported decreases to total debt to GBV to 42.9% and total debt to Adjusted EBITDA to 8.2, respectively, at December 31, 2021.
At December 31, 2021, Artis had $221.5 million of cash on hand and $568.1 million available on its revolving term credit facilities. Under the terms of the revolving credit facilities, the REIT must maintain certain financial covenants which limit the total borrowing capacity of the revolving credit facilities to $635.3 million.
Liquidity and capital resources may be impacted by financing activities, portfolio acquisition, disposition and development activities, debt repayments, or other activities in accordance with the Business Transformation Plan occurring subsequent to December 31, 2021.
**FINANCIAL AND OPERATIONAL RESULTS**
| | | | | | | | |
|---|---|---|---|---|---|---|---|
| | **Three months ended December 31,** | | | | | **Year ended December 31,** | |
| *$000’s, except per unit amounts* | **2021** | | **2020** | **% Change** | | **2021** | | **2020** | **% Change** |
| | | | | | | | | | |
| Revenue | $ | 97,665 | | $ | 113,010 | (13.6) % | | $ | 419,499 | | $ | 458,917 | (8.6) % |
| Net operating income | 55,427 | | 64,967 | (14.7) % | | 237,785 | | 269,275 | (11.7) % |
| Net income | 60,404 | | 32,424 | 86.3 % | | 389,175 | | 21,543 | 1,706.5 % |
| Total comprehensive (loss) | 52,935 | | (32,479) | (263.0) % | | 387,702 | | (6,274) | (6,279.5) % |
| Distributions per common unit | 2.54 | | 0.14 | 1714.3 % | | 2.98 | | 0.54 | 451.9 % |
| | | | | | | | | | |
| FFO (1) | $ | 40,323 | | $ | 45,796 | (12.0) % | | $ | 174,343 | | $ | 192,411 | (9.4) % |
| FFO per unit (1) | 0.32 | | 0.34 | (5.9) % | | 1.34 | | 1.41 | (5.0) % |
| FFO payout ratio (1) (2) | 46.9 % | | 41.2 % | 5.7 % | | 44.0 % | | 38.3 % | 5.7 % |
| | | | | | | | | | |
| AFFO (1) | $ | 27,919 | | $ | 31,721 | (12.0) % | | $ | 124,476 | | $ | 139,552 | (10.8) % |
| AFFO per unit (1) | 0.22 | | 0.23 | (4.3) % | | 0.96 | | 1.02 | (5.9) % |
| AFFO payout ratio (1) (2) | 68.2 % | | 60.9 % | 7.3 % | | 61.5 % | | 52.9 % | 8.6 % |
| (1) Represents a non-GAAP measure, ratio or other supplementary financial measure. Refer to the Notice with Respect to Non-GAAP & Supplementary Financial Measures Disclosure. |
|---|
| (2) FFO payout ratio and AFFO payout ratio are calculated excluding the Special Distribution declared in December 2021. |
Artis reported portfolio occupancy of 89.4% at December 31, 2021, compared to 90.6% at December 31, 2020. Weighted-average rental rate on renewals that commenced during 2021 increased 4.1%.
Artis’ portfolio has a stable lease expiry profile with 43.3% of gross leasable area expiring in 2026 or later. Weighted-average in-place rents for the total portfolio are $13.32 per square foot and are estimated to be 0.2% below market rents. Information about Artis’ lease expiry profile is as follows:
| | **Current vacancy** | **Monthly Tenants** | **2022** | **2023** | **2024** | **2025** | **2026& later** | **Total portfolio** |
|---|---|---|---|---|---|---|---|---|
| | | | | | | | | |
| Expiring square footage | 10.7 % | 0.2 % | 13.2 % | 13.1 % | 11.7 % | 7.8 % | 43.3 % | 100.0 % |
| In-place rents | N/A | N/A | $ | 12.62 | $ | 14.71 | $ | 11.85 | $ | 15.12 | $ | 13.19 | $ | 13.32 |
| Market rents | N/A | N/A | $ | 12.44 | $ | 14.69 | $ | 11.71 | $ | 15.27 | $ | 13.31 | $ | 13.35 |
**PORTFOLIO ACTIVITY**
**Acquisitions**
On January 26, 2021, Artis acquired an additional 5% interest in Park 8Ninety IV, an industrial property located in the Greater Houston Area, Texas. As a result of this acquisition, the REIT owns 100% of the property.
On May 7, 2021, the REIT acquired a parcel of industrial development land in Twin Cities Area, Minnesota for a purchase price of US$1.5 million.
On September 24, 2021, the REIT acquired a parcel of industrial development land in the Twin Cities Area, Minnesota, for a purchase price of US$2.2 million.
**Dispositions**
During 2021, Artis sold 29 industrial properties, six office properties, six retail properties as well as a portion of a retail property for an aggregate sale price of $858.6 million. The sale proceeds, net of costs of $6.8 million, notes receivable of $16.0 million and related debt of $44.1 million, were $791.7 million.
At December 31, 2021, the REIT had entered into an agreement to sell a portfolio comprising two office properties located in the Greater Toronto Area, Ontario, for a sale price of $35.5 million. This disposition closed on January 20, 2022.
Subsequent to December 31, 2021, the REIT entered into an unconditional sale agreement for an industrial property located in the Greater Toronto Area, Ontario, for a sale price of $29.2 million. The sale is anticipated to close in March 2022.
**Condominium Sales**
During 2021, Artis completed the conversion of 2145-2155 Dunwin Drive, an industrial property located in the Greater Toronto Area, Ontario, to commercial condominiums and sold 21 units for aggregate consideration of $17.9 million.
**New Developments**
At December 31, 2021, the REIT had three ongoing development projects: 300 Main, Blaine 35 I and Blaine 35 II.
300 Main is a mixed-used commercial and residential/multi-family property located in Winnipeg, Manitoba. Blaine 35 is a two-phase industrial development project located in the Twin Cities Area, Minnesota, with prominent interstate frontage at the intersection of I-35W and 85th Ave N. The first phase of the project, Blaine 35 I, consists of one building anticipated to total approximately 118,500 square feet of leasable area. The second phase, Blaine 35 II, will comprise two buildings expected to total approximately 198,900 square feet of leasable area.
**IMPACT OF COVID-19**
As a diversified REIT, Artis’ portfolio comprises industrial, office and retail properties which, at December 31, 2021, were 89.4% leased (91.5% including commitments on vacant space) to high-quality tenants across Canada and the U.S. with a weighted-average remaining lease term of 5.1 years.
Rent collection has been a key focus during this time. As at December 31, 2021, 98.2% of rent charges (both excluding and including deferred rent charges) have been collected for the three months ended December 31, 2021.
Due to government-mandated capacity restrictions and temporary closures of certain non-essential businesses throughout the course of the COVID-19 pandemic, a number of tenants had to limit operations. To support tenants through this difficult time, qualifying tenants who were in need of assistance were given the option to defer a portion of their rent, with an agreement to repay the amount at a specified later date. As at December 31, 2021, the outstanding balance of rent deferrals granted to tenants was $1.0 million, compared to $4.9 million at December 31, 2020.
The REIT anticipates that the majority of rent deferrals and rents receivable will be collected, however, there are certain tenants that may not be able to pay their outstanding rent. As at December 31, 2021, an allowance for doubtful accounts in the amount of $1.7 million has been recorded, compared to $2.0 million at December 31, 2020.
Overall, Artis’ first priority is to maintain a safe environment for its tenants, employees and the community. During this unprecedented and uncertain time, Artis is committed to minimizing the impact on its business, and as a diversified REIT, Artis is confident that it is well-positioned to handle the economic challenges that may lie ahead.
**UPCOMING WEBCAST AND CONFERENCE CALL**
A conference call with management will be held on Friday, March 4, 2022, at 12:00 p.m. CT (1:00 p.m. ET). In order to participate, please dial 1-416-764-8688 or 1-888-390-0546. You will be required to identify yourself at the time of registration.
If you cannot participate on Friday, March 4, 2022, a replay of the conference call will be available by dialing 1-416-764-8677 or 1-888-390-0541 and entering passcode 828246#. The replay will be available until Monday, April 4, 2022. The webcast will be archived 24 hours after the end of the conference call and will be accessible for 90 days.
**CAUTIONARY STATEMENTS**
This press release contains forward-looking statements within the meaning of applicable Canadian securities laws. For this purpose, any statements contained herein that are not statements of historical fact may be deemed to be forward-looking statements. Without limiting the foregoing, the words “outlook”, “objective”, “expects”, “anticipates”, “intends”, “estimates”, “projects”, “believes”, “plans”, “seeks”, and similar expressions or variations of such words and phrases suggesting future outcomes or events, or which state that certain actions, events or results ”may”, ”would”, “should” or ”will” occur or be achieved are intended to identify forward-looking statements. Such forward-looking information reflects management’s current beliefs and is based on information currently available to management.
Particularly, statements regarding the Business Transformation Plan, the steps required to implement the Business Transformation Plan, Artis’ return of capital and value investing strategies, building Artis into a best-in-class asset management and investment platform focused on value investing in real estate, the REIT’s ability to execute its strategy, the REIT’s ability to maximize long-term value and anticipated returns, expected distributions by the REIT, planned divestitures, the use of proceeds from divestitures, prospective investments and investment strategy, Artis’ plans to optimize the value and performance of its assets, Artis’ goals to grow net asset value (“NAV”) per unit and distributions, efficiencies and cost savings, the tax treatment of Artis, Artis’ status(es) under the Tax Act, the tax treatment of divestitures, are forward looking statements.
Forward-looking statements are based on a number of factors and assumptions which are subject to numerous risks and uncertainties, which have been used to develop such statements, but which may prove to be incorrect. Although Artis believes that the expectations reflected in the forward-looking statements are reasonable, it cannot guarantee future results, levels of activity, performance or achievement since such expectations are inherently subject to significant business, economic, competitive, political and social uncertainties and contingencies. Assumptions have been made regarding, among other things: the general stability of the economic and political environment in which Artis operates, treatment under governmental regulatory regimes, securities laws and tax laws, the ability of Artis and its service providers to obtain and retain qualified staff, equipment and services in a timely and cost efficient manner, currency, exchange and interest rates, global economic, financial markets and economic conditions in Canada and the United States will not, in the long term, be adversely impacted by the COVID-19 pandemic, disruptions resulting from the temporary restrictions that governments imposed on businesses to address the COVID-19 pandemic will not be long term.
Artis is subject to significant risks and uncertainties which may cause the actual results, performance or achievements of the REIT to be materially different from any future results, performance or achievements expressed or implied in these forward-looking statements. Such risk factors include, but are not limited to risk related to tax matters; and, credit, market, currency, operational, liquidity and funding risks generally and relating specifically to the Cominar Transaction; the COVID-19 pandemic, real property ownership, geographic concentration, current economic conditions, strategic initiatives, debt financing, interest rate fluctuations, foreign currency, tenants, SIFT rules, other tax-related factors, illiquidity, competition, reliance on key personnel, future property transactions, general uninsured losses, dependence on information technology, cyber security, environmental matters and climate change, land and air rights leases, public markets, market price of common units, changes in legislation and investment eligibility, availability of cash flow, fluctuations in cash distributions, nature of units, legal rights attaching to units, preferred units, debentures, dilution, unitholder liability, failure to obtain additional financing, potential conflicts of interest, developments and trustees. Further, the Business Transformation Plan has additional risk factors including, but not limited to: failure to execute the Business Transformation Plan in part or at all, the ability to achieve certain efficiencies to generate savings in general and administrative expenses, pace of completing investments and divestitures, the ability of Sandpiper Asset Management Inc. (“Sandpiper”) to provide services to Artis, risk of not obtaining control or significant influence in portfolio companies, risks associated with minority investments, reliance on the performance of underlying assets, operating and financial risks of investments, ranking of Artis’ investments and structural subordination, follow-on investments, investments in private issuers, valuation methodologies involve subjective judgments, risks associated with owning illiquid assets, competitive market for investment opportunities, risks upon disposition of investments, reputation of Artis and Sandpiper, unknown merits and risks of future investments, resources could be wasted in researching investment opportunities that are not ultimately completed, credit risk, tax risk, regulatory changes, foreign security risk, foreign exchange risk, potential conflicts of interest with Sandpiper and market discount.
For more information on the risks, uncertainties and assumptions that could cause the Artis’ actual results to materially differ from current expectations, refer to the section entitled “Risk Factors” of Artis’ Annual Information Form for the year ended December 31, 2021.
Artis cannot assure investors that actual results will be consistent with any forward-looking statements and Artis assumes no obligation to update or revise such forward-looking statements to reflect actual events or new circumstances other than as required by applicable securities laws. All forward-looking statements contained in this press release are qualified by this cautionary statement.
**NOTICE WITH RESPECT TO NON-GAAP & SUPPLEMENTARY FINANCIAL MEASURES DISCLOSURE**
In addition to reported IFRS measures, certain non-GAAP and supplementary financial measures are commonly used by Canadian real estate investment trusts as an indicator of financial performance. “GAAP” means the generally accepted accounting principles described by the CPA Canada Handbook – Accounting, which are applicable as at the date on which any calculation using GAAP is to be made. Artis applies IFRS, which is the section of GAAP applicable to publicly accountable enterprises.
Non-GAAP measures and ratios include Same Property Net Operating Income (“Same Property NOI”), Funds From Operations (“FFO”), Adjusted Funds from Operations (“AFFO”), FFO per Unit, AFFO per Unit, FFO Payout Ratio, AFFO Payout Ratio, NAV per Unit, Total Debt to GBV, Adjusted EBITDA Interest Coverage Ratio and Total Debt to Adjusted EBITDA.
Supplementary financial measures includes unencumbered assets to unsecured debt.
Management believes that these measures are helpful to investors because they are widely recognized measures of Artis’ performance and provide a relevant basis for comparison among real estate entities.
These non-GAAP and supplementary financial measures are not defined under IFRS and are not intended to represent financial performance, financial position or cash flows for the period, nor should any of these measures be viewed as an alternative to net income, cash flow from operations or other measures of financial performance calculated in accordance with IFRS.
The above measures are not standardized financial measures under the financial reporting framework used to prepare the financial statements of Artis. Readers should be further cautioned that the above measures as calculated by Artis may not be comparable to similar measures presented by other issuers. Refer to the Notice With Respect to Non-GAAP & Supplementary Financial Measures Disclosure of Artis’ 2021 Annual MD&A, which is incorporated by reference herein.
The reconciliation for each non-GAAP measure or ratio and other supplementary financial measures included in this Press Release is outlined below.
**NAV per Unit**
| | **December 31, 2021** | | **December 31,** **2020** |
|---|---|---|---|
| | | | |
| Unitholders’ equity | $ | 2,455,353 | | $ | 2,333,897 |
| | | | |
| Less face value of preferred equity | (299,017) | | (302,746) |
| | | | |
| NAV attributable to common unitholders | $ | 2,156,336 | | $ | 2,031,151 |
| | | | |
| Total number of dilutive units outstanding: | | | |
| Common units | 123,544,536 | | 134,643,175 |
| Restricted units | 462,891 | | 404,937 |
| Deferred units | 133,552 | | 92,908 |
| | | | |
| | 124,140,979 | | 135,141,020 |
| | | | |
| NAV per unit | $ | 17.37 | | $ | 15.03 |
**Total Debt to GBV**
| | **December 31, 2021** | | **December 31,** **2020** |
|---|---|---|---|
| | | | |
| Total assets | $ | 4,576,024 | | $ | 4,859,841 |
| Add: accumulated depreciation | 9,275 | | 7,915 |
| | | | |
| Gross book value | 4,585,299 | | 4,867,756 |
| | | | |
| Secured mortgages and loans | 1,085,039 | | 1,273,522 |
| Preferred shares liability | 889 | | 610 |
| Carrying value of debentures | 249,346 | | 498,919 |
| Credit facilities | 631,253 | | 624,461 |
| | | | |
| Total debt | $ | 1,966,527 | | $ | 2,397,512 |
| | | | |
| Total debt to GBV | 42.9 % | | 49.3 % |
**Unencumbered Assets to Unsecured Debt**
| | **December 31, 2021** | | **December 31,** **2020** |
|---|---|---|---|
| | | | |
| Unencumbered assets | $ | 1,902,748 | | $ | 1,901,073 |
| Unencumbered assets in properties held under joint venture arrangements | 36,805 | | 40,886 |
| | | | |
| Total unencumbered assets | 1,939,553 | | 1,941,959 |
| | | | |
| Senior unsecured debentures | 249,346 | | 498,919 |
| Unsecured credit facilities | 631,253 | | 624,461 |
| | | | |
| Total unsecured debt | $ | 880,599 | | $ | 1,123,380 |
| | | | |
| Unencumbered assets to unsecured debt | 2.20 | | 1.73 |
**Adjusted EBITDA Interest Coverage Ratio**
| | **Three months ended** | | **Year ended** |
|---|---|---|---|
| | **December 31,** | | **December 31,** |
| | **2021** | | **2020** | | **2021** | | **2020** |
| | | | | | | | |
| Net income | $ | 60,404 | | $ | 32,424 | | $ | 389,175 | | $ | 21,543 |
| Add (deduct): | | | | | | | |
| Tenant inducements amortized to revenue | 5,938 | | 6,424 | | 24,765 | | 24,854 |
| Straight-line rent adjustments | (303) | | (1,535) | | (3,405) | | (4,923) |
| Interest expense | 16,460 | | 20,247 | | 69,648 | | 86,106 |
| Net income from equity accounted investments | (3,276) | | (17,724) | | (16,795) | | (24,851) |
| Distributions from equity accounted investments (1) | 839 | | 1,847 | | 4,577 | | 5,958 |
| Fair value (gain) loss on investment properties | (9,247) | | 8,985 | | (197,511) | | 140,876 |
| Foreign currency translation (gain) loss | (473) | | (3,105) | | 3,244 | | (530) |
| Transaction costs | — | | — | | 11 | | — |
| Proxy matter expenses | — | | 17,423 | | — | | 17,423 |
| Strategic initiative expenses | — | | 810 | | 18 | | 4,029 |
| Fair value (gain) loss on financial instruments | (11,302) | | (265) | | (21,224) | | 16,538 |
| Depreciation of property and equipment | 343 | | 397 | | 1,362 | | 1,422 |
| Income tax expense | 398 | | 146 | | 1,289 | | 733 |
| | | | | | | | |
| Adjusted EBITDA | 59,781 | | 66,074 | | 255,154 | | 289,178 |
| | | | | | | | |
| Interest expense | 16,460 | | 20,247 | | 69,648 | | 86,106 |
| Add (deduct): | | | | | | | |
| Amortization of financing costs | (814) | | (966) | | (3,334) | | (3,744) |
| Amortization of above- and below-market mortgages, net | 216 | | 183 | | 799 | | 752 |
| | | | | | | | |
| Adjusted interest expense | $ | 15,862 | | $ | 19,464 | | $ | 67,113 | | $ | 83,114 |
| | | | | | | | |
| Adjusted EBITDA interest coverage ratio | 3.77 | | 3.39 | | 3.80 | | 3.48 |
| (1) Excludes distributions from proceeds of the sale of investment properties. |
|---|
**Total Debt to Adjusted EBITDA**
| | **December 31,** **2021** | | **December 31,** **2020** |
|---|---|---|---|
| | | | |
| Secured mortgages and loans | $ | 1,085,039 | | $ | 1,273,522 |
| Preferred shares liability | 889 | | 610 |
| Carrying value of debentures | 249,346 | | 498,919 |
| Credit facilities | 631,253 | | 624,461 |
| | | | |
| Total debt | 1,966,527 | | 2,397,512 |
| | | | |
| EBITDA per above | 59,781 | | 66,074 |
| Annualized adjusted EBITDA | 239,124 | | 264,296 |
| | | | |
| Total Debt to Adjusted EBITDA | 8.2 | | 9.1 |
**Same Property NOI**
| | **Year ended** | | |
|---|---|---|---|
| | **December 31,** | | **%Change** |
| | **2021** | **2020** | **Change** |
| | | | | |
| Net operating income | $ | 237,785 | $ | 269,275 | | |
| Add (deduct) net operating income from: | | | | |
| Equity accounted investments | 8,847 | 11,138 | | |
| Dispositions and unconditional dispositions | (7,509) | (32,630) | | |
| (Re)development properties | (191) | (61) | | |
| Lease termination income adjustments | (2,444) | 348 | | |
| Disposition of condominium units | (1,823) | — | | |
| Other | (3,896) | (1,984) | | |
| | | | | |
| | (7,016) | (23,189) | | |
| | | | | |
| Straight-line rent adjustments (1) | (3,965) | (5,565) | | |
| Tenant inducements amortized to revenue (1) | 24,545 | 21,635 | | |
| | | | | |
| Same Property NOI | $ | 251,349 | $ | 262,156 | $ | (10,807) | (4.1) % |
| (1) Includes equity accounted investments. |
|---|
**FFO and AFFO**
| | **Three months ended** | | **Year ended** |
|---|---|---|---|
| | **December 31,** | | **December 31,** |
| | **2021** | | **2020** | | **2021** | | **2020** |
| | | | | | | | |
| Net income | $ | 60,404 | | $ | 32,424 | | $ | 389,175 | | $ | 21,543 |
| Add (deduct): | | | | | | | |
| Fair value (gain) loss on investment properties | (9,247) | | 8,985 | | (197,511) | | 140,876 |
| Tenant inducements amortized to revenue | 5,938 | | 6,424 | | 24,765 | | 24,854 |
| Transaction costs on acquisitions | — | | — | | 11 | | — |
| Adjustments for equity accounted investments | (1,492) | | (16,133) | | (9,945) | | (17,271) |
| Proxy matter expenses | — | | 17,423 | | — | | 17,423 |
| Strategic initiative expenses | — | | 810 | | 18 | | 4,029 |
| Foreign currency translation (gain) loss | (473) | | (3,105) | | 3,244 | | (530) |
| Fair value (gain) loss on financial instruments | (11,302) | | (265) | | (21,224) | | 16,538 |
| Deferred income tax recovery | (38) | | (18) | | (43) | | (43) |
| Remeasurement component of unit-based compensation | 28 | | 2,774 | | (63) | | (935) |
| Distributions on preferred shares treated as interest expense | 50 | | 45 | | 176 | | 181 |
| Incremental leasing costs | 749 | | 779 | | 3,000 | | 3,166 |
| Preferred unit distributions | (4,294) | | (4,347) | | (17,260) | | (17,420) |
| | | | | | | | |
| FFO | $ | 40,323 | | $ | 45,796 | | $ | 174,343 | | $ | 192,411 |
| | | | | | | | |
| Add (deduct): | | | | | | | |
| Amortization of recoverable capital expenditures | $ | (2,953) | | $ | (3,508) | | $ | (9,848) | | $ | (11,204) |
| Straight-line rent adjustments | (303) | | (1,535) | | (3,405) | | (4,923) |
| Adjustments for equity accounted investments | (148) | | (32) | | (614) | | (1,032) |
| Non-recoverable property maintenance reserve | (1,100) | | (1,100) | | (4,400) | | (4,400) |
| Leasing costs reserve | (7,900) | | (7,900) | | (31,600) | | (31,300) |
| | | | | | | | |
| AFFO | $ | 27,919 | | $ | 31,721 | | $ | 124,476 | | $ | 139,552 |
**FFO and AFFO Per Unit**
| | **Three months ended** | | **Year ended** |
|---|---|---|---|
| | **December 31,** | | **December 31,** |
| | **2021** | | **2020** | | **2021** | | **2020** |
| | | | | | | | |
| Basic units | 124,637,757 | | 135,400,559 | | 129,553,433 | | 136,206,856 |
| Add: | | | | | | | |
| Restricted units | 414,281 | | 355,902 | | 366,757 | | 320,049 |
| Deferred units | 133,552 | | 92,908 | | 105,727 | | 80,016 |
| | | | | | | | |
| Diluted units | 125,185,590 | | 135,849,369 | | 130,025,917 | | 136,606,921 |
| | **Three months ended** | | **Year ended** |
|---|---|---|---|
| | **December 31,** | | **December 31,** |
| | **2021** | | **2020** | | **2021** | | **2020** |
| | | | | | | | |
| FFO per unit: | | | | | | | |
| Basic | $ | 0.32 | | $ | 0.34 | | $ | 1.35 | | $ | 1.41 |
| Diluted | 0.32 | | 0.34 | | 1.34 | | 1.41 |
| | | | | | | | |
| AFFO per unit: | | | | | | | |
| Basic | $ | 0.22 | | $ | 0.23 | | $ | 0.96 | | $ | 1.02 |
| Diluted | 0.22 | | 0.23 | | 0.96 | | 1.02 |
**FFO and AFFO Payout Ratios**
| | **Three months ended** | | **Year ended** |
|---|---|---|---|
| | **December 31,** | | **December 31,** |
| | **2021** | | **2020** | | **2021** | | **2020** |
| | | | | | | | |
| Distributions per common unit (1) | $ | 0.15 | | $ | 0.14 | | $ | 0.59 | | $ | 0.54 |
| FFO per unit | 0.32 | | 0.34 | | 1.34 | | 1.41 |
| | | | | | | | |
| FFO payout ratio | 46.9 % | | 41.2 % | | 44.0 % | | 38.3 % |
| | | | | | | | |
| Distributions per common unit (1) | $ | 0.15 | | $ | 0.14 | | $ | 0.59 | | $ | 0.54 |
| AFFO per unit | 0.22 | | 0.23 | | 0.96 | | 1.02 |
| | | | | | | | |
| AFFO payout ratio | 68.2 % | | 60.9 % | | 61.5 % | | 52.9 % |
| (1) Excludes Special Distribution declared in December 2021. |
|---|
**ABOUT ARTIS REAL ESTATE INVESTMENT TRUST**
Artis is a diversified Canadian real estate investment trust with a portfolio of industrial, office and retail properties in Canada and the United States. Artis’ vision is to build a best-in-class asset management and investment platform focused on growing net asset value per unit and distributions for investors through value investing in real estate.
**Categories:** Business, Finance
---
### [Argonaut Gold Announces Record Annual Production of 244,156 Gold Equivalent Ounces, Leading to Record Annual Revenue of $437 Million and Record Annual Cash Flow(1) of $125 Million](https://df.media/argonaut-gold-announces-record-annual-production-of-244156-gold-equivalent-ounces-leading-to-record-annual-revenue-of-437-million-and-record-annual-cash-flow1-of-125-million/)
**Published:** July 26, 2023
**Author:** Daily Finance
**Content:**
TORONTO, March 1, 2022 /CNW/ – **Argonaut Gold Inc.** (TSX: AR) (the “Company”, “Argonaut Gold” or “Argonaut”) is pleased to announce its operating and financial results for the fourth quarter and year ended December 31, 2021. For 2021, the Company reports record annual production of 244,156 gold equivalent ounces2 (“GEO” or “GEOs”), record annual revenue of $436.9 million and record annual cash flow from operating activities before changes in non-cash operating working capital and other items of $124.9 million, net income of $26.5 million or earnings per basic share of $0.09 and adjusted net income3 of $57.1 million or adjusted earnings per basic share3 of $0.19. For the fourth quarter 2021, the Company reports production of 61,926 GEOs, revenue of $102.9 million, cash flow from operating activities before changes in non-cash operating working capital and other items of $18.3 million, net loss of $37.3 million or loss per share of $0.12, and adjusted net income3 of $10.2 million or adjusted earning per basic share3 of $0.03. All dollar amounts are expressed in United States dollars, unless otherwise specified (C$ refers to Canadian dollars).
[](https://web.archive.org/web/20221128221435/https://mma.prnewswire.com/media/1757260/Argonaut_Gold_Inc__Argonaut_Gold_Announces_Record_Annual_Product.html)
Dan Symons, Vice President, Corporate Development & Investor Relations stated: “2022 was a solid year operationally, as we achieved record annual production, which led to record annual revenue and record annual cash flow. We achieved above our production guidance at La Colorada, near the top of production guidance at El Castillo and San Agustin and near the mid-point of our production guidance at Florida Canyon. On a consolidated basis, we achieved near the mid-point of our cost guidance. At the Magino construction project, we continue to make good progress and remain on schedule. We anticipate having secured the required financing, primarily in the form of debt financing, by the second quarter of 2022 to fund the remainder of the Magino construction capital.”
The table below outlines the Company’s performance compared to 2021 guidance. Capital guidance was revised concurrent with the publication of second quarter 2021 results on August 10, 2021 and Magino construction capital was revised in the December 14, 2021 press release. Full year 2021 capital is reported as incurred capital.
| | **Full Year 2021** | **2021 Guidance** |
|---|---|---|
| GEO production2 | 244,156 | 210,000 – 250,000 |
| Cash cost per gold ounce sold3 | $1,006 | $950 – $1,050 |
| AISC per gold ounce sold3 | $1,311 | $1,250 – $1,350 |
| Capital (including exploration but excluding Magino construction capital) | $73.3 million | $65 million – $75 million |
| Magino construction capital | $236.8 million | $245 million – $255 million |
| 1 “Cash Flow” refers to “Cash flow from operating activities before changes in non-cash operating working capital and other items”. |
|---|
| 2 GEOs are based on a conversation ratio of 80:1 for silver to gold for 2022, 85:1 for 2021 and 80:1 for 2020. The silver to gold conversation ratio is based on the three-year trailing average silver to gold ratios. These are the referenced ratios for each year throughout the press release. |
| 3 This is a Non-IFRS Measure. Please refer to the section entitled “Non-IFRS Measures” for a discussion of these Non-IFRS Measures. |
Key operating and financial statistics for the fourth quarter and year ended December 31, 2021 are outlined in the following table:
| | **3 Months EndedDecember 31** | **12 Months EndedDecember 31** |
|---|---|---|
| | **2021** | **2020** | **Change** | **2021** | **2020** | **Change** |
| **Financial Data (in millions except for earning per share)** | | | | | | |
| Revenue | $102.9 | $100.8 | 2% | $436.9 | $319.7 | 37% |
| Gross profit | $17.8 | $32.8 | (46%) | $114.4 | $96.0 | 19% |
| Net income (loss) | $(37.3) | $18.0 | (307%) | $26.5 | $14.2 | 87% |
| Earnings (loss) per share – basic | $(0.12) | $0.06 | (300%) | $0.09 | $0.06 | 50% |
| Adjusted net income1 | $10.2 | $18.6 | (45%) | $57.1 | $44.6 | 28% |
| Adjusted earnings per share – basic1 | $0.03 | $0.06 | (50%) | $0.19 | $0.19 | —% |
| Cash flow from operating activities before changes in non-cash operating working capital and other items | $18.3 | $39.5 | (54%) | $124.9 | $95.0 | 31% |
| Cash and cash equivalents | $199.2 | $214.2 | (7%) | $199.2 | $214.2 | (7%) |
| Net cash | $119.2 | $214.2 | (44%) | $119.2 | $214.2 | (44%) |
| **Gold Production and Cost Data** | | | | | | |
| GEOs loaded to the pads2 | 102,524 | 113,463 | (10%) | 458,342 | 371,344 | 23% |
| GEOs projected recoverable2,3 | 59,386 | 65,426 | (9%) | 258,474 | 191,039 | 35% |
| GEOs produced2,4 | 61,926 | 56,985 | 9% | 244,156 | 179,003 | 36% |
| GEOs sold2 | 56,961 | 53,478 | 7% | 242,333 | 179,168 | 35% |
| Average realized sales price | $1,799 | $1,882 | (4%) | $1,791 | $1,789 | —% |
| Cash cost per gold ounce sold1 | $1,172 | $913 | 28% | $1,006 | $946 | 6% |
| All-in sustaining cost per gold ounce sold1 | $1,514 | $1,200 | 26% | $1,311 | $1,261 | 4% |
| 1 This is a Non-IFRS Measure. Please refer to the section below entitled “Non-IFRS Measures” for a discussion of these Non-IFRS Measures. |
|---|
| 2GEOs are based on a conversion ratio of 85:1 for silver to gold for 2021 and 80:1 for 2020. The silver to gold conversion ratio is based on the three-year trailing average silver to gold ratio. |
| 3Expected recoverable GEOs are based on the assumptions and parameters as set forth in the El Castillo Gold Mine Technical Report dated February 14, 2022, the San Agustin Gold/Silver Mine Technical Report dated February 14, 2022, the La Colorada Gold/Silver Mine Technical Report dated February 14, 2022 and the Florida Canyon Technical Report dated July 8, 2020. In periods where the Company mines and processes material not specifically defined in a technical report (for example: low grade stockpile material or run-of-mine ore), management uses its best estimate of recovery based on the information available. |
| 4Produced ounces are calculated as ounces loaded to carbon. |
**2021 and Recent Company Highlights:**
- Corporate Highlights:
- **Full year 2021:**
- Record annual production of 244,156 GEOs.
- Record annual revenue of $437 million.
- Record annual cash flow before changes in working capital and other items of $125 million.
- Year-over-year lost time injury frequency rate (“LTIFR”) reduction of 7%.
- **Fourth quarter 2021:**
- Acquired key mineral concessions surrounding the San Agustin mine for $5.75 million that more than quadruples the mineral tenure in the San Agustin district (see press release dated October 12, 2021).
- Strengthened the management team in Mexico with the appointment of Alfredo Phillips as Vice President, Corporate Affairs & Country Manager. In this role, Mr. Phillips will be responsible for leading government relations and ESG strategy and execution in Mexico.
- Departure of President and CEO, Pete Dougherty, and engagement of Korn Ferry, a leading executive recruitment firm, to conduct an immediate search for a replacement.
- **Subsequent to year end 2021:**
- Announced the promotion of Lowe Billingsley to Chief Operating Officer.
- Launched a C$45 million flow through equity financing to fund 2022 eligible Canadian Development Expenditures and Canadian Exploration Expenditures at Magino.
- Social and Environmental Responsibility
- Received nationally awarded Environmental Socially Responsible Company recognition for the 10th consecutive year for its Mexican operations.
- Installation of solar panels to power pumps for water wells for a school in the community near San Agustin.
- Donation of school and craft supplies to children and youth in the community near El Castillo.
- Sponsored the Minnovacion event in the municipality of La Colorada, which included an innovative collaboration with a well known local photographer showcasing the La Colorada mine in contrast to dancers in a project called “Contrastes”, an exhibit inaugurated by the Governor of Sonora.
- Assisted in road repairs for the local community church in Cerro del Gallo.
- Continued meetings and monthly updates for the Magino construction project with the Indigenous community leaders.
- El Castillo
- Production of 48,861 GEOs for the year, an increase of 6% compared to 2020.
- San Agustin
- Production of 74,116 GEOs for the year, an increase of 16% compared to 2020.
- Declared initial sulphide inferred Mineral Resource, which has the potential to extend mine life by six to ten years with further drilling and metallurgical work.
- Zero lost time accidents in 2021.
- La Colorada
- Production of 66,964 GEOs for the year, an increase of 44% compared to 2020.
- Reduction in cash cost per gold ounce sold of 22% in 2021 compared to 2020 (This is a Non-IFRS Measure. Please see “Non-IFRS Measures” section).
- Discovered high-grade gold mineralization below the El Crestón pit.
- Year-over-year 68% reduction in LTIFR annual rate.
- Florida Canyon
- Production of 54,215 GEOs for the year.
- Received Air Quality permit modification and installed new conveying and stacking system.
- Magino
- **Construction**
- Commenced construction and provided monthly newsletter updates detailing construction highlights. Major milestones included:
- Placed orders on long lead time components;
- Logged project area;
- Constructed camp facilities;
- Made significant progress at process facility site;
- Made significant progress at Tailings Management Facility;
- Commenced open pit mining to generate waste rock;
- Made significant progress at Water Quality Control Pond;
- Commenced fish habitat work; and
- Continued operational readiness preparation.
- During the fourth quarter and year ended December 31, 2021, Argonaut incurred $65.6 million and $236.8 million in capital costs, respectively, related to construction of the Magino project. Of this amount incurred, the majority was for securing long lead time components for the mineral processing plant and for site development, camp construction and earthworks.
- **Exploration**
- Continue to discover high-grade gold mineralization in six distinct zones below and adjacent to the planned pit: Elbow, Central, Scotland, #42, Sandy and South.
- Announced updated technical report results (see press release dated February 14, 2022).
**Financial Results – Fourth Quarter 2021** Revenue for the fourth quarter of 2021 was $102.9 million, an increase from $100.8 million for the fourth quarter of 2020. During the fourth quarter of 2021, the Company sold 55,094 gold ounces at an average realized price per ounce of $1,799, compared to 51,497 gold ounces sold at an average realized price per ounce of $1,882 during the same period of 2020. Gold ounces sold for the fourth quarter of 2021 increased 7% compared to the same period in 2020 primarily due to increases in gold ounces produced at all four mines, including higher gold grades at El Castillo, La Colorada and Florida Canyon.
Net loss for the fourth quarter of 2021 was $37.3 million or loss per share of $0.12, compared with net income of $18.0 million or earnings per basic share of $0.07 for the fourth quarter of 2020 due to a non-cash impairment of mineral properties, plant and equipment of $64.9 million, primarily due to non-cash impairments of $57.5 million related to the Florida Canyon mine and $7.3 million related to the Ana Paula project.
Adjusted net income for the fourth quarter of 2021 was $10.2 million or $0.03 per basic share, a decrease from adjusted net income of $18.6 million or $0.06 per basic share for the fourth quarter of 2020, primarily due to higher operating costs and a lower realized gold price. (This is a Non-IFRS Measure. Please see “Non-IFRS Measure” section).
Cash flows from operating activities before changes in non-cash operating working capital and other items totaled $18.3 million during the fourth quarter of 2021, a decrease from $39.5 million in the fourth quarter of 2020, primarily due to higher operating costs and a lower realized gold price.
**Financial Results – 2021** Argonaut achieved record annual revenue for 2021 of $436.9 million, an increase from $319.7 million in 2020. During 2021, gold ounces sold totaled 233,349 at an average realized price per ounce of $1,791, compared to 172,024 gold ounces sold at an average realized price per ounce of $1,789 during 2020. Gold ounces sold for 2021 increased compared to the same period in 2020 primarily due to the addition of the gold ounces sold from the Florida Canyon mine (acquired July 1, 2020), higher gold grade at the La Colorada mine, increases in gold ounces produced at the Mexican mines due to the temporary suspension in mining activities during the second quarter of 2020 at the onset of the global pandemic.
Net income for 2021 was $26.5 million or earnings of $0.09 per basic share, an increase from net income of $14.2 million or $0.06 per basic for 2020, representing an 87% increase in net income primarily as a result of increased GEOs sold.
Adjusted net income for 2021 was $57.1 million or $0.19 per basic share, an increase from adjusted net income of $44.6 million or $0.19 per basic share for 2020, representing an 41% increase in adjusted net income primarily as a result of increased GEOs sold (This is a Non-IFRS Measure. Please see “Non-IFRS Measures” section).
Cash flows from operating activities before changes in non-cash operating working capital and other items totaled $124.9 million during 2021, an increase from $95.0 million in 2020, primarily due to a 35% increase in GEOs sold.
**Operational Results – Fourth Quarter 2021** During the fourth quarter 2021, the Company achieved production of 61,926 GEOs at a cash cost of $1,172 per gold ounce sold and all-in sustaining cost of $1,514 per gold ounce sold compared to 56,985 GEOs at a cash cost of $913 per gold ounce sold and an all-in sustaining cost of $1,200 per gold ounce sold (“AISC”) during the fourth quarter 2020 (This is a Non-IFRS Measure. Please see “Non-IFRS Measures” section). The 9% increase in GEO production was primarily related to higher gold grades processed at El Castillo, La Colorada and Florida Canyon. Higher costs were primarily related to a year-to-date production adjustment at Florida Canyon (discussed further in the Florida Canyon operating statistics section) and inflationary pressures on consumables and reagents.
**FOURTH QUARTER 2021 EL CASTILLO COMPLEX OPERATING STATISTICS**
| | **3 Months EndedDecember 31** | **12 Months EndedDecember 31** |
|---|---|---|
| | **2021** | **2020** | **% Change** | **2021** | **2020** | **% Change** |
| **Mining (in 000s except waste/ore ratio)** | | | | | | |
| Tonnes ore El Castillo | 2,116 | 2,910 | (27%) | 9,159 | 8,608 | 6% |
| Tonnes ore San Agustin | 2,815 | 2,807 | —% | 11,001 | 9,261 | 19% |
| **Tonnes ore** | **4,931** | **5,717** | **(14%)** | **20,160** | **17,869** | **13%** |
| Tonnes waste El Castillo | 2,752 | 3,107 | (11%) | 10,220 | 9,531 | 7% |
| Tonnes waste San Agustin | 1,834 | 1,904 | (4%) | 6,865 | 6,171 | 11% |
| **Tonnes waste** | **4,586** | **5,011** | **(8%)** | **17,085** | **15,702** | **9%** |
| Tonnes mined El Castillo | 4,868 | 6,017 | (19%) | 19,379 | 18,139 | 7% |
| Tonnes mined San Agustin | 4,649 | 4,711 | (1%) | 17,866 | 15,432 | 16% |
| **Tonnes mined** | **9,517** | **10,728** | **(11%)** | **37,245** | **33,571** | **11%** |
| Tonnes per day El Castillo | 53 | 65 | (18%) | 53 | 50 | 7% |
| Tonnes per day San Agustin | 51 | 51 | —% | 49 | 42 | 17% |
| **Tonnes per day** | **105** | **116** | **(10%)** | **103** | **92** | **12%** |
| Waste/ore ratio El Castillo | 1.30 | 1.07 | 21% | 1.12 | 1.11 | 1% |
| Waste/ore ratio San Agustin | 0.65 | 0.68 | (4%) | 0.62 | 0.67 | (7%) |
| **Waste/ore ratio** | **0.93** | **0.88** | **6%** | **0.85** | **0.88** | **(4%)** |
| **Leach Pads (in 000s)** | | | | | | |
| Tonnes crushed to East leach pads El Castillo | 0 | 0 | —% | 0 | 337 | (100%) |
| Tonnes crushed to West leach pads El Castillo | 0 | 0 | —% | 0 | 3 | (100%) |
| Tonnes direct to leach pads El Castillo | 2,125 | 2,911 | (27%) | 9,168 | 8,420 | 9% |
| Tonnes crushed to leach pads San Agustin | 2,627 | 2,888 | (9%) | 11,210 | 9,428 | 19% |
| **Tonnes to leach pads** | **4,752** | **5,799** | **(18%)** | **20,378** | **18,188** | **12%** |
| **Production** | | | | | | |
| Gold grade loaded to leach pads El Castillo (g/t)1 | 0.32 | 0.25 | 28% | 0.28 | 0.37 | (24%) |
| Gold grade loaded to leach pads San Agustin (g/t)1 | 0.30 | 0.31 | (3%) | 0.30 | 0.32 | (6%) |
| **Gold grade loaded to leach pads (g/t)1** | **0.31** | **0.28** | **11%** | **0.29** | **0.35** | **(17%)** |
| Gold loaded to leach pads El Castillo (oz)2 | 22,034 | 23,148 | (5%) | 83,638 | 105,286 | (21%) |
| Gold loaded to leach pads San Agustin (oz)2 | 25,485 | 28,778 | (11%) | 106,783 | 98,431 | 8% |
| **Gold loaded to leach pads (oz)2** | **47,519** | **51,926** | **(8%)** | **190,421** | **203,717** | **(7%)** |
| Projected recoverable GEOs loaded El Castillo4 | 12,405 | 11,852 | 5% | 43,261 | 43,731 | (1%) |
| Projected recoverable GEOs loaded San Agustin4 | 18,134 | 21,349 | (15%) | 76,873 | 72,430 | 6% |
| **Projected recoverable GEOs loaded4** | **30,538** | **33,201** | **(8%)** | **120,134** | **116,161** | **3%** |
| Gold produced El Castillo (oz)2,3 | 12,313 | 12,390 | (1%) | 48,131 | 45,305 | 6% |
| Gold produced San Agustin (oz)2,3 | 16,498 | 17,265 | (4%) | 68,132 | 59,695 | 14% |
| **Gold produced (oz)2** | **28,811** | **29,655** | **(3%)** | **116,263** | **105,000** | **11%** |
| Silver produced El Castillo (oz)2,3 | 12,369 | 14,213 | (13%) | 62,057 | 70,180 | (12%) |
| Silver produced San Agustin (oz)2,3 | 111,451 | 108,553 | 3% | 508,661 | 333,713 | 52% |
| **Silver produced (oz)2,3** | **123,820** | **122,766** | **1%** | **570,718** | **403,893** | **41%** |
| GEOs produced El Castillo3 | 12,458 | 12,568 | (1%) | 48,861 | 46,183 | 6% |
| GEOs produced San Agustin3 | 17,809 | 18,621 | (4%) | 74,116 | 63,866 | 16% |
| **GEOs produced3** | **30,267** | **31,189** | **(3%)** | **122,977** | **110,049** | **12%** |
| Gold sold El Castillo (oz)2 | 11,066 | 9,863 | 12% | 47,755 | 43,815 | 9% |
| Gold sold San Agustin (oz)2 | 15,672 | 16,124 | (3%) | 68,778 | 58,189 | 18% |
| **Gold sold (oz)2** | **26,738** | **25,987** | **3%** | **116,533** | **102,004** | **14%** |
| Silver sold El Castillo (oz)2 | 10,394 | 14,213 | (27%) | 62,440 | 70,180 | (11%) |
| Silver sold San Agustin (oz)2 | 103,585 | 98,029 | 6% | 499,366 | 324,576 | 54% |
| **Silver sold (oz)2** | **113,979** | **112,242** | **2%** | **561,806** | **394,755** | **42%** |
| GEOs sold El Castillo | 11,189 | 10,041 | 11% | 48,490 | 44,692 | 8% |
| GEOs sold San Agustin | 16,891 | 17,349 | (3%) | 74,653 | 62,246 | 20% |
| **GEOs sold** | **28,080** | **27,390** | **3%** | **123,143** | **106,938** | **15%** |
| Cash cost per gold ounce sold El Castillo5 | $ | 1,081 | $ | 891 | 21% | $ | 1,099 | $ | 946 | 16% |
| Cash cost per gold ounce sold San Agustin5 | $ | 1,060 | $ | 765 | 39% | $ | 915 | $ | 780 | 17% |
| **Cash cost per gold ounce sold5** | **$** | **1,069** | **$** | **806** | **33%** | **$** | **991** | **$** | **835** | **19%** |
| 1 “g/t” refers to grams per tonne. |
|---|
| 2 “oz” refers to troy ounce. |
| 3 Produced ounces are calculated as ounces loaded to carbon. |
| 4Expected recoverable GEOs are based on the assumptions and parameters as set forth in the El Castillo Gold Mine Technical Report dated February 14, 2022 and the San Agustin Gold/Silver Mine Technical Report dated February 14, 2022. In periods where the Company mines and processes material not specifically defined in a technical report (for example: run-of-mine ore), management uses its best estimate of recovery based on the information available. |
| 5 Please refer to the section below entitled “Non-IFRS Measures” for a discussion of this Non-IFRS Measure. |
**Summary of Production Results at the El Castillo Complex**
During the fourth quarter of 2021, the El Castillo Complex produced 3% fewer GEOs at a cash cost per gold ounce sold 33% higher than during the fourth quarter of 2020 (This is a Non-IFRS Measure. Please see “Non-IFRS Measures” section). GEO production at the El Castillo mine was relatively in line with the same period in 2020. GEO production at the San Agustin mine was 4% lower, primarily due to a 3% decrease in gold grade processed compared to the same period in 2020. Cash cost per gold ounce sold were higher, primarily due to a higher mobile maintenance costs and higher strip ratio at El Castillo and inflationary pressures on key consumables and reagents.
During 2021, the El Castillo Complex produced 12% more GEOs at a cash cost per gold ounce sold 19% higher than during 2020 (This is a Non-IFRS Measure. Please see “Non-IFRS Measures” section). GEO production at the El Castillo mine was 6% higher and costs were 16% higher than 2020 due to an 11% increase in total tonnes mined, a 9% increase in ore tonnes loaded to the leach pads and higher recoveries, offset by a 28% reduction in gold grade. GEO production at the San Agustin mine was 16% higher and costs were 17% higher than 2020 due to a 16% increase in total tonnes mined, a 19% increase in ore tonnes loaded to the leach pads and higher recoveries, offset by a 6% reduction in gold grade.
**FOURTH QUARTER 2021 LA COLORADA OPERATING STATISTICS**
| | **3 Months EndedDecember 31** | **12 Months EndedDecember 31** |
|---|---|---|
| | **2021** | **2020** | **% Change** | **2021** | **2020** | **% Change** |
| **Mining (in 000s except for waste/ore ratio)** | | | | | | |
| Tonnes ore | 1,233 | 1,363 | (10%) | 4,834 | 4,019 | 20% |
| Tonnes waste | 3,228 | 3,974 | (19%) | 11,389 | 14,303 | (20%) |
| Tonnes mined | 4,461 | 5,337 | (16%) | 16,223 | 18,322 | (11%) |
| Tonnes per day | 49 | 58 | (15%) | 45 | 50 | (11%) |
| Waste/ore ratio | 2.62 | 2.92 | (10%) | 2.36 | 3.56 | (34%) |
| **Leach Pads (in 000s)** | | | | | | |
| Tonnes crushed to leach pads | 1,246 | 1,332 | (6%) | 5,014 | 4,058 | 24% |
| **Production** | | | | | | |
| Gold loaded to leach pads (g/t)1 | 0.54 | 0.45 | 20% | 0.63 | 0.43 | 47% |
| Gold loaded to leach pads (oz)2 | 21,726 | 19,872 | 9% | 101,146 | 56,274 | 80% |
| Projected recoverable GEOs loaded4 | 16,480 | 16,929 | (3%) | 80,281 | 45,514 | 76% |
| Gold produced (oz)2,3 | 16,885 | 14,045 | 20% | 64,860 | 44,340 | 46% |
| Silver produced (oz)2,3 | 40,174 | 36,570 | 10% | 178,821 | 162,499 | 10% |
| GEOs produced3 | 17,358 | 14,502 | 20% | 66,964 | 46,371 | 44% |
| Gold sold (oz)2 | 15,825 | 14,049 | 13% | 62,486 | 44,820 | 39% |
| Silver sold (oz)2 | 36,635 | 39,105 | (6%) | 169,634 | 161,644 | 5% |
| GEOs sold | 16,256 | 14,538 | 12% | 64,482 | 46,841 | 38% |
| Cash cost per gold ounce sold5 | $ | 869 | $ | 756 | 15% | $ | 730 | $ | 937 | (22%) |
| 1 “g/t” refers to grams per tonne. |
|---|
| 2 “oz” refers to troy ounce. |
| 3 Produced ounces are calculated as ounces loaded to carbon. |
| 4 Expected recoverable GEOs are based on the assumptions and parameters as set forth in the La Colorada Gold/Silver Mine Technical Report dated February 14, 2022. In periods where the Company mines material not specifically defined in a technical report (for example: low grade stockpile material), management uses its best estimate of recovery based on the information available. |
| 5 Please refer to the section below entitled “Non-IFRS Measures” for a discussion of this Non-IFRS Measure. |
**Summary of Production Results at La Colorada** During the fourth quarter of 2021, the La Colorada mine produced 20% more GEOs at a cash cost per gold ounce sold 15% more than during the fourth quarter of 2020 (This is a Non-IFRS Measure. Please see “Non-IFRS Measures” section). Higher GEO production was primarily due to a 20% increase in gold grade processed compared to the same period in 2020. Higher costs were primarily related to a lower tax credit on diesel consumption and inflationary pressures on key consumables and reagents, partially offset by the higher grade processed and a 10% reduction in strip ratio.
During 2021, the La Colorada mine produced 44% more GEOs at a cash cost per gold ounce sold 22% lower than 2020 (This is a Non-IFRS Measure. Please see “Non-IFRS Measures” section). Higher GEO production was primarily due to a 47% increase in gold grade and a 34% reduction in strip ratio, partially offset by lower recoveries.
**FOURTH QUARTER 2021 FLORIDA CANYON OPERATING STATISTICS**
| | **3 Months EndedDecember 31** | **12 Months EndedDecember 31** |
|---|---|---|
| | **2021** | **2020** | **% Change** | **2021** |
| **Mining (in 000s except for waste/ore ratio)** | | | | |
| Tonnes ore | 1,845 | 2,251 | (18%) | 8,475 |
| Tonnes waste | 2,687 | 3,060 | (12%) | 12,274 |
| Tonnes mined | 4,532 | 5,311 | (15%) | 20,749 |
| Tonnes per day | 49 | 57 | (15%) | 56 |
| Waste/ore ratio | 1.46 | 1.36 | 7% | 1.45 |
| **Leach Pads (in 000s)** | | | | |
| Tonnes direct to leach pads | 181 | 302 | (40%) | 1,574 |
| Tonnes crushed to leach pads | 1,522 | 1,965 | (23%) | 6,786 |
| **Production** | | | | |
| Gold grade loaded to leach pads (g/t)1 | 0.35 | 0.29 | 21% | 0.33 |
| Gold loaded to leach pads (oz)2 | 18,947 | 21,484 | (12%) | 89,584 |
| Projected recoverable GEOs loaded4 | 12,367 | 15,296 | (19%) | 58,058 |
| Gold produced (oz)2,3 | 14,205 | 11,202 | 27% | 53,889 |
| Silver produced (oz)2,3 | 8,159 | 7,356 | 11% | 27,681 |
| GEOs produced3 | 14,301 | 11,294 | 27% | 54,215 |
| Gold sold (oz)2 | 12,531 | 11,461 | 9% | 54,330 |
| Silver sold (oz)2 | 8,040 | 7,109 | 13% | 32,147 |
| GEOs sold | 12,625 | 11,550 | 9% | 54,708 |
| Cash cost per gold ounce sold5 | $1,774 | $1,335 | 33% | $1,356 |
| 1 “g/t” refers to grams per tonne. |
|---|
| 2 “oz” refers to troy ounce. |
| 3 Produced ounces are calculated as ounces loaded to carbon. |
| 4 Expected recoverable GEOs are based on the assumptions and parameters as set forth in the Florida Canyon Mine Technical Report dated July 8,2020. In periods where the Company mines material not specifically defined in a technical report (for example: run-of-mine or low grade stockpile material), management uses its best estimate of recovery based on the information available. |
| 5 Please refer to the section below entitled “Non-IFRS Measures” for a discussion of this Non-IFRS Measure. |
**Summary of Production Results at Florida Canyon** As Argonaut did not own nor operate the Florida Canyon mine until July 1, 2020, it is only making comparisons between the three months ended December 31, 2021 and 2020 periods and is not making comparisons between the full year 2021 and 2020 periods in the table above.
During the fourth quarter of 2021, the Florida Canyon mine produced 27% more GEOs at a cash cost per gold ounce sold 33% higher than during the fourth quarter of 2020 (This is a Non-IFRS Measure. Please see “Non-IFRS Measures” section). Higher GEO production was primarily related to the production adjustment in December 2021 (discussed below). Higher costs are primarily related to a year-to-date production adjustment (discussed below) and inflationary pressures on key consumable and reagents.
Florida Canyon, similar to other heap leach mines, calculates its daily production based on samples taken from the effluent at the bottom of the leach pads. These samples are used to estimate the monthly produced ounces. For El Castillo, San Agustin and La Colorada, this information is then reconciled with other known information, including inventory and sales, to obtain the adjusted production number reported at the end of each month. Florida Canyon did not previously have this process in place, but has adopted it as of the fourth quarter 2021. As this reconciliation was not calculated monthly throughout 2021, the full 2021 adjustment to produced gold ounces was recognized during the fourth quarter of 2021. As a result of the adjustment, additional costs were recognized in the fourth quarter of 2021 that would have been recognized in prior quarters of 2021. Since the number of gold ounces sold does not change, the cash cost per gold ounce sold was affected (This is a Non-IFRS Measure. Please see “Non-IFRS Measures” section). The resulting higher costs appear abnormal for the quarter, but when compared to the full year 2021, appear reasonable and consistent with expectations.
**2022 Production and Cost Guidance** Argonaut anticipates it will produce between 200,000 and 230,000 GEOs during 2022 at a cash cost of between $1,100 and $1,190 per gold ounce sold and an AISC of between $1,415 and $1,525 per gold ounce sold (see “Non-IFRS Measures” section). The Company also anticipates higher cash taxes will impact cash flow in 2022, particularly during the first quarter of 2022 when most of the final tax payments for 2021 are made, as a result of Argonaut’s highly profitable operations in 2021 combined with the exhaustion of net operating losses at its Mexican subsidiaries.
**2022 GEO Production and Cost Guidance**
| | | **El Castillo** | **San Agustin** | **La Colorada** | **Florida Canyon** | **Consolidated** |
|---|---|---|---|---|---|---|
| **GEO production** | *In 000s* | 38 – 45 | 62 – 70 | 48 – 55 | 52 – 60 | **200 – 230** |
| **Cash costs1** | *$ per oz Au* | 1,400 – 1,475 | 1,000 – 1,075 | 950 – 1,050 | 1,150 – 1,250 | **1,100 – 1,190** |
| **AISC1** | *$ per oz Au* | 1,500 – 1,600 | 1,050 – 1,150 | 1,200 – 1,300 | 1,700 – 1,800 | **1,415 – 1,525** |
| 1 *This is a Non-IFRS Measure. Please see “Non-IFRS Measures” section.* |
|---|
Lower GEO production and higher AISC in 2022 are primarily driven by lower expected GEO production at La Colorada due to a higher strip ratio and lower grade and recovery, as mining transitions from the El Crestón pit to the Veta Madre pit. Lower GEO production and higher cost at El Castillo is primarily related to processing less oxide ore and more transition and sulphide ore as El Castillo anticipates entering into its final full year of mining operations. Costs are also impacted by higher costs for consumables and reagents across all operations due to the current inflationary environment.
As Argonaut is currently evaluating several viable financing options to fund the remainder of the Magino construction project, it intends to provide full year 2022 capital guidance after financing is in place. The largest component of the projected 2022 capital spend will be the Magino construction project where Argonaut forecasts it will invest approximately $340 million (C$424 million) during 2022. In the event that financing is not available promptly and upon acceptable terms, the Company may need to amend or adjust its plans for construction of the Magino project.
**Argonaut Gold Fourth Quarter and Year Ended 2021 Operational and Financial Results Conference Call and Webcast:**
The Company will host a conference call and webcast to discuss its fourth quarter and year ended December 31, 2021 operating and financial results at 9:00 am EST on March 2, 2022.
**Q4 and Year Ended 2021 Conference Call Information**
| Toll Free (North America): | 1-888-664-6392 |
|---|---|
| International: | 1-416-764-8659 |
| Conference ID: | 82995499 |
| | |
**Q4 and Year Ended 2021 Conference Call Replay**
| Toll Free Replay Call (North America): | 1-888-390-0541 |
|---|---|
| International Replay Call: | 1-416-764-8677 |
| Replay Entry Code: | 995499# |
The conference call and replay will be available from 12:00 pm EST on March 2, 2022 until 11:59 pm EST on March 9, 2022.
**Non-IFRS Measures** The Company has included certain non-IFRS measures including “Cash cost per gold ounce sold”, “All-in sustaining cost per gold ounce sold”, “Adjusted net income”, “Adjusted earnings per share – basic” and “Net cash” in this press release to supplement its financial statements, which are presented in accordance with International Financial Reporting Standards (“IFRS”). Cash cost per gold ounce sold is equal to production costs less silver sales divided by gold ounces sold. All-in sustaining cost per gold ounce sold is equal to production costs less silver sales plus general and administrative, exploration, accretion and other expenses and sustaining capital expenditures divided by gold ounces sold. Adjusted net income is equal to net income less foreign exchange impacts on deferred income taxes, foreign exchange (gains) losses, non-cash impairment write down (reversal) of work-in-process inventory, non-cash impairment write down (reversal) of mineral, properties, plant and equipment, unrealized (gains) losses on commodity derivatives and care and maintenance expenses. Adjusted earnings per share – basic is equal to adjusted net income divided by the basic weighted average number of common shares outstanding. Net cash is calculated as the sum of the cash and cash equivalents balance net of debt as at the statement of financial position date. The Company believes that these measures provide investors with an alternative view to evaluate the performance of the Company. Non-IFRS measures do not have any standardized meaning prescribed under IFRS. Therefore they may not be comparable to similar measures employed by other companies. The data is intended to provide additional information and should not be considered in isolation or as a substitute for measures of performance prepared in accordance with IFRS.
Please see under the heading “Non-IFRS Measures” in the management’s discussion and analysis (“MD&A”) for full disclosure on non-IFRS measures. The disclosure under the heading “Non-IFRS Measures” in the MD&A is incorporated by reference herein.
This press release should be read in conjunction with the Company’s audited annual consolidated financial statements for the year ended December 31, 2021.
**Cautionary Note Regarding Forward-looking Statements** This press release contains certain “forward-looking statements” and “forward-looking information” under applicable Canadian securities laws concerning the business, operations and financial performance and condition of Argonaut Gold. Forward-looking statements and forward-looking information include, but are not limited to statements with respect to: the Magino construction capital estimate; the ability to finance additional construction costs on terms acceptable to Argonaut; the realization of mineral reserve estimates; the timing and amount of estimated future production; the impact of inflation on costs of exploration, development and production; estimated production and mine life of the various mineral projects of Argonaut; timing of approval for modifications to existing permits; permitting and legal processes in relation to mining permitting and approval; the benefits of the development potential of the properties of Argonaut; the future price of gold, copper, and silver; the estimation of mineral reserves and resources; success of exploration activities; the impact of COVID-19, the response of governments to COVID-19 and the effectiveness of such responses; and currency exchange rate fluctuations. Except for statements of historical fact relating to Argonaut, certain information contained herein constitutes forward-looking statements. Forward-looking statements are frequently characterized by words such as “plan,” “expect,” “project,” “intend,” “believe,” “anticipate”, “estimate” and other similar words, or statements that certain events or conditions “may”, “should” or “will” occur. Forward-looking statements are based on the opinions and estimates of management at the date the statements are made, and are based on a number of assumptions and subject to a variety of risks and uncertainties and other factors that could cause actual events or results to differ materially from those projected in the forward-looking statements. Many of these assumptions are based on factors and events that are not within the control of Argonaut and there is no assurance they will prove to be correct.
Factors that could cause actual results to vary materially from results anticipated by such forward-looking statements include the availability and changing terms of financing, variations in ore grade or recovery rates, changes in market conditions, changes in inflation, risks relating to the availability and timeliness of permitting and governmental approvals; risks relating to international operations, fluctuating metal prices and currency exchange rates, changes in project parameters, the possibility of project cost overruns or unanticipated costs and expenses, the impact of COVID-19 and the impact and effectiveness of governmental responses to COVID-19, labour disputes and other risks of the mining industry, failure of plant, equipment or processes to operate as anticipated.
These factors are discussed in greater detail in Argonaut’s most recent Annual Information Form and in the most recent Management’s Discussion and Analysis filed on SEDAR, which also provide additional general assumptions in connection with these statements. Argonaut cautions that the foregoing list of important factors is not exhaustive. Investors and others who base themselves on forward-looking statements should carefully consider the above factors as well as the uncertainties they represent and the risk they entail. Argonaut believes that the expectations reflected in those forward-looking statements are reasonable, but no assurance can be given that these expectations will prove to be correct and such forward-looking statements included in this press release should not be unduly relied upon. These statements speak only as of the date of this press release.
Although Argonaut has attempted to identify important factors that could cause actual actions, events or results to differ materially from those described in forward-looking statements, there may be other factors that cause actions, events or results not to be anticipated, estimated or intended. There can be no assurance that forward-looking statements will prove to be accurate, as actual results and future events could differ materially from those anticipated in such statements. Argonaut undertakes no obligation to update forward-looking statements if circumstances or management’s estimates or opinions should change except as required by applicable securities laws. The reader is cautioned not to place undue reliance on forward-looking statements. Statements concerning mineral reserve and resource estimates may also be deemed to constitute forward-looking statements to the extent they involve estimates of the mineralization that will be encountered if the property is developed. Comparative market information is as of a date prior to the date of this document.
**Qualified Person, Technical Information and Mineral Properties Reports** Technical information included in this release was supervised and approved by Brian Arkell, Argonaut’s Vice President, Exploration and a Qualified Person under NI 43-101.
| El Castillo Gold Mine | El Castillo Gold Mine, Durango, Mexico NI 43-101 Technical Report dated February 14, 2022 (effective date of October 1, 2021) |
|---|---|
| San Agustin Gold/Silver Mine | San Agustin Gold/Silver Mine, Durango, Mexico, NI 43-101 Technical Report dated February 14, 2022 (effective date of August 1, 2021) |
| La Colorada Gold/Silver Mine | La Colorada Gold/Silver Mine, Sonara, Mexico, NI 43-101 Technical Report dated February 14, 2022 (effective date of October 1, 2021) |
| Florida Canyon Gold Mine | NI 43-101 Technical Report on Mineral Resource and Mineral Reserve Florida Canyon Gold Mine Pershing County, Nevada, USA dated July 8, 2020 (effective date June 1, 2020) |
| Cerro del Gallo Project | Pre-Feasibility Study Technical Report on the Cerro del Gallo Project, Guanajuato, Mexico dated January 31, 2020 (effective date of October 24, 2019) |
The key assumptions, parameters and methods used in the Magino technical report are described in the press release dated February 14, 2022. These will be further described in the full technical report being prepared for the Magino Project pursuant to NI 43-101 under Argonaut’s issuer profile within 45 days from the February 14, 2022 press release announcement. The Company is not aware of any known legal, political, environmental or other risks that could materially affect the potential development of the Mineral Resources or Mineral Reserves beyond those contemplated in the prior technical report for Magino, as will be updated in the report to be filed.
**About Argonaut Gold**
Argonaut Gold is a Canadian gold company engaged in exploration, mine development and production. Its primary assets are the El Castillo mine and San Agustin mine, which together form the El Castillo Complex in Durango, Mexico, the La Colorada mine in Sonora, Mexico and the Florida Canyon mine in Nevada, USA. The Company also holds the construction stage Magino project, the advanced exploration stage Cerro del Gallo project and several other exploration stage projects, all of which are located in North America.
**Categories:** Finance
---
### [ARC RESOURCES LTD. REPORTS RECORD YEAR-END RESULTS AND RESERVES](https://df.media/arc-resources-ltd-reports-record-year-end-results-and-reserves/)
**Published:** July 26, 2023
**Author:** Daily Finance
**Content:**
CALGARY, AB, Feb. 9, 2023 /CNW/ – (TSX: ARX) ARC Resources Ltd. (“ARC” or the “Company”) today reported its fourth quarter and year-end 2022 financial and operational results as well as its year-end 2022 reserves.
[](https://web.archive.org/web/20230209223017/https://mma.prnewswire.com/media/1998787/ARC_Resources_Ltd__ARC_RESOURCES_LTD__REPORTS_RECORD%C2%A0YEAR_END_RE.html)
ARC generated record production and funds from operations per share in the fourth quarter of 2022. In 2022, annual average production, net income, funds from operations, and free funds flow were the highest of any year in ARC’s 26-year history.
**HIGHLIGHTS**
**Fourth Quarter 2022 Results**
- ARC delivered record average production of 359,730 boe(1)(2) per day (61 per cent natural gas and 39 per cent crude oil and liquids). Production per share(3) increased 16 per cent year-over-year and was in-line with Company guidance despite weather related downtime in December.
- ARC generated free funds flow of $603 million(4) ($0.96 per share)(5), funds from operations of $986 million(6) ($1.56 per share)(7) and cash flow from operating activities of $878 million in the fourth quarter. ARC invested $383 million into capital expenditures(4), in-line with Company guidance.
- ARC’s market diversification strategy resulted in an average realized natural gas price of $8.31 per Mcf(7); $2.73 per Mcf, or 49 per cent, greater than the average AECO 7A Monthly Index price.
- ARC distributed 68 per cent or $411 million ($0.65 per share) of free funds flow for the period to shareholders through base dividends and share repurchases, with the remainder used to reduce net debt to $1.3 billion(6) or 0.4 times funds from operations(6).
- ARC repurchased 17 million shares during the fourth quarter. Since renewing its NCIB on August 30, 2022, ARC has repurchased 35 million common shares, representing 53 per cent of its allotment under the current NCIB.
- ARC recognized net income of $741 million ($1.18 per share), compared to net income of $678 million ($0.96 per share) in the fourth quarter of 2021.
**Year-end 2022 Results**
- ARC generated record free funds flow in 2022 of $2.3 billion ($3.42 per share), representing a 58 per cent increase compared to 2021 free funds flow per share. ARC distributed 71 per cent or $1.6 billion ($2.43 per share) of free funds flow to shareholders with the remainder used to further strengthen ARC’s balance sheet by reducing debt by $0.7 billion and net debt by $0.5 billion.
- In the second quarter of 2022, ARC entered into a long-term natural gas supply agreement with Cheniere Energy, Inc. (“Cheniere”). The agreement commences with the commercial operation of Train 7 of the Corpus Christi Stage III expansion which is expected in 2027. ARC will deliver natural gas to Cheniere through existing pipeline capacity and will receive a liquefied natural gas (“LNG”) price based on Platts JKMTM (Japan Korea Marker), after deductions for fixed LNG shipping costs and a fixed liquefaction fee.
- ARC recognized net income of $2.3 billion ($3.47 per share) compared to net income of $787 million ($1.25 per share) in 2021. Cash flow from operating activities was $3.8 billion and funds from operations were $3.7 billion ($5.60 per share).
- ARC executed its 2022 capital program safely and efficiently. Cash flow used in investing activities totaled $1.4 billion, with capital expenditures of $1.4 billion delivering record average production of 345,613 boe per day (61 per cent natural gas and 39 per cent crude oil and liquids) in 2022.
- Market diversification resulted in an average annual realized natural gas price of $8.15 per Mcf; $2.59 per Mcf, or 47 per cent greater than the average AECO 7A Monthly Index price for the period.
- In January 2023, ARC received certification under Equitable Origin’s EO100TM Standard for Responsible Development for its Ante Creek asset. With this certification and prior certifications received in 2022 for Kakwa and the Company’s northeast BC assets, 100 per cent of the Company’s assets are now certified under this global standard, representing the largest certified production base in Canada.
**Year-end 2022 Reserves(1)(8)**
- ARC’s before-tax net present value (“NPV”) of proved plus probable (“2P”) reserves, discounted at 10 per cent, increased 49 per cent to $34.00 per share(9) or $21.1 billion at December 31, 2022. The increase was driven by positive technical revisions and extensions and improved recovery, particularly at Kakwa, along with stronger commodity prices and reduced share count.
- ARC grew its reserves per share in all categories between 14 per cent and 22 per cent. Proved producing (“PDP”) reserves increased 22 per cent per share to 549 MMboe, primarily due to out performance at Kakwa where PDP reserves increased by 17 per cent. PDP finding, development and acquisition (“FD&A”) costs including future development costs (“FDC”) of $8.31 per boe(10) equated to a 5.2 times(10) PDP recycle ratio.
- 2P reserve replacement from development has been 140 per cent of production or greater for 15 consecutive years, and at year-end 2022 just 17 per cent of ARC’s total drilling inventory was booked in the 2P category. ARC’s Attachie asset, which will drive the next phase of production and reserve growth, comprised less than four per cent of total 2P locations with just 34 undeveloped drilling locations booked.
*ARC’s consolidated financial statements and notes (the “financial statements”) and Management’s Discussion and Analysis (“MD&A”) as at and for the three months and year ended December 31, 2022, are available on ARC’s website at [www.arcresources.com](https://web.archive.org/web/20230209223017/http://www.arcresources.com/) and under ARC’s SEDAR profile at [www.sedar.com](https://web.archive.org/web/20230209223017/http://www.sedar.com/). The disclosures under the sections entitled “Netback” and “Non-GAAP and Other Financial Measures” in ARC’s MD&A as at and for the three months and year ended December 31, 2022 (the “2022 Annual MD&A”) are incorporated by reference in this news release.*
| \_\_\_\_\_\_\_\_\_\_\_\_\_\_\_\_\_\_\_\_\_\_\_\_\_\_\_\_\_\_\_\_\_\_\_\_\_\_\_\_\_\_\_ |
|---|
| (1) | ARC has adopted the standard six thousand cubic feet (“Mcf”) of natural gas to one barrel (“bbl”) of crude oil ratio when converting natural gas to barrels of oil equivalent (“boe”). Boe may be misleading, particularly if used in isolation. A boe conversion ratio of 6 Mcf:1 bbl is based on an energy equivalency conversion method primarily applicable at the burner tip and does not represent a value equivalency at the wellhead. Given that the value ratio based on the current price of crude oil as compared to natural gas is significantly different than the energy equivalency of the 6:1 conversion ratio, utilizing the 6:1 conversion ratio may be misleading as an indication of value. |
| (2) | Throughout this news release, crude oil (“crude oil”) refers to light, medium, and heavy crude oil product types as defined by National Instrument 51-101 *Standards of Disclosure for Oil and Gas Activities* (“NI 51-101”). Condensate is a natural gas liquid as defined by NI 51-101. Throughout this news release, natural gas liquids (“NGLs”) comprise all natural gas liquids as defined by NI 51-101 other than condensate, which is disclosed separately. Throughout this news release, crude oil and liquids (“crude oil and liquids”) refers to crude oil, condensate, and NGLs. |
| (3) | Represents average daily production divided by the diluted weighted average common shares outstanding for the respective three months ended December 31. |
| (4) | Non-GAAP financial measure that is not a standardized financial measure under International Financial Reporting Standards (“IFRS”) and may not be comparable to similar financial measures disclosed by other issuers. See *“Non-GAAP and Other Financial Measures”* in the 2022 Annual MD&A for information relating to this non-GAAP financial measure, which information is incorporated by reference into this news release. See *“Non-GAAP and Other Financial Measures”* of this news release for the most directly comparable financial measure disclosed in ARC’s current financial statements to which such non-GAAP financial measure relates and a reconciliation to such comparable financial measure. |
| (5) | Non-GAAP ratio that is not a standardized financial measure under IFRS and may not be comparable to similar ratios disclosed by other issuers. Free funds flow, a non-GAAP financial measure, is used as a component of the non-GAAP ratio. See *“Non-GAAP and Other Financial Measures”* in the 2022 Annual MD&A for the non-GAAP ratio for the comparative period and other information relating to this non-GAAP ratio, which information is incorporated by reference into this news release. |
| (6) | See Note 16 *“Capital Management”* in the financial statements and *“Non-GAAP and Other Financial Measures”* in the 2022 Annual MD&A for information relating to this capital management measure, which information is incorporated by reference into this news release. |
| (7) | See *“Non-GAAP and Other Financial Measures”* in the 2022 Annual MD&A for an explanation of the composition of this supplementary financial measure, which information is incorporated by reference into this news release. |
| (8) | GLJ Ltd. (“GLJ”) conducted an Independent Qualified Reserves Evaluation (“Reserves Evaluation”), dated February 8, 2023 and effective December 31, 2022, which was prepared in accordance with definitions, standards, and procedures in the Canadian Oil and Gas Evaluation (“COGE”) Handbook and NI 51-101. The Reserves Evaluation was based on GLJ forecast pricing and foreign exchange rates at January 1, 2023. |
| (9) | See *“Non-GAAP and Other Financial Measures”* of this news release for an explanation of the composition of this supplementary financial measure, which information is incorporated by reference into this news release. |
| (10) | Non-GAAP ratio that is not a standardized financial measure under IFRS and may not be comparable to similar financial measures disclosed by other issuers. Netback per boe, a non-GAAP ratio, and capital expenditures and adjusted net capital acquisitions, both non-GAAP financial measures, are used as components of the non-GAAP ratio. See “Non-GAAP and Other Financial Measures” of this news release for the non-GAAP ratio for the comparative period and other information relating to this non-GAAP ratio. |
**FINANCIAL AND OPERATIONAL RESULTS**
| (Cdn$ millions, except per share amounts(1), boe amounts, | **Three Months Ended** | **Year Ended(2)** |
|---|---|---|
| and common shares outstanding) | September 30, 2022 | **December 31, 2022** | December 31, 2021 | **December 31, 2022** | December 31, 2021 |
| **FINANCIAL RESULTS** | | | | | |
| Net income | 867.8 | **741.0** | 678.0 | **2,302.3** | 786.6 |
| Per share | 1.32 | **1.18** | 0.96 | **3.47** | 1.25 |
| Cash flow from operating activities | 1,103.6 | **878.3** | 668.7 | **3,833.3** | 2,006.5 |
| Per share(3) | 1.68 | **1.39** | 0.95 | **5.78** | 3.20 |
| Funds from operations | 953.0 | **986.2** | 833.6 | **3,712.5** | 2,415.4 |
| Per share | 1.45 | **1.56** | 1.19 | **5.60** | 3.85 |
| Free funds flow | 580.1 | **602.9** | 458.7 | **2,270.6** | 1,353.6 |
| Per share | 0.89 | **0.96** | 0.65 | **3.42** | 2.16 |
| Dividends declared | 76.7 | **93.4** | 69.5 | **318.2** | 181.4 |
| Per share | 0.12 | **0.15** | 0.10 | **0.49** | 0.286 |
| Cash flow used in investing activities | 351.9 | **350.7** | 268.7 | **1,413.2** | 808.1 |
| Capital expenditures | 372.9 | **383.3** | 374.9 | **1,441.9** | 1,061.8 |
| Long-term debt | 1,126.6 | **990.0** | 1,705.3 | **990.0** | 1,705.3 |
| Net debt | 1,541.3 | **1,301.5** | 1,828.7 | **1,301.5** | 1,828.7 |
| Common shares outstanding, weighted average diluted(millions) | 655.4 | **630.3** | 703.0 | **663.1** | 627.3 |
| Common shares outstanding, end of period (millions) | 637.6 | **620.9** | 693.5 | **620.9** | 693.5 |
| **OPERATIONAL RESULTS** | | | | | |
| Production | | | | | |
| Crude oil (bbl/day) | 8,149 | **7,280** | 7,857 | **7,904** | 10,435 |
| Condensate (bbl/day) | 82,203 | **82,855** | 74,220 | **78,489** | 59,958 |
| Crude oil and condensate (bbl/day) | 90,352 | **90,135** | 82,077 | **86,393** | 70,393 |
| Natural gas (MMcf/day) | 1,227 | **1,310** | 1,293 | **1,259** | 1,149 |
| NGLs (bbl/day) | 47,108 | **51,311** | 48,299 | **49,385** | 40,084 |
| Total (boe/day) | 342,034 | **359,730** | 345,831 | **345,613** | 302,003 |
| Average realized price | | | | | |
| Crude oil ($/bbl)(3) | 111.41 | **103.58** | 92.11 | **115.66** | 75.08 |
| Condensate ($/bbl)(3) | 110.35 | **107.24** | 96.90 | **118.17** | 86.04 |
| Natural gas ($/Mcf)(3) | 9.29 | **8.31** | 6.45 | **8.15** | 4.82 |
| NGLs ($/bbl)(3) | 20.72 | **28.86** | 27.65 | **27.98** | 26.16 |
| Average realized price ($/boe)(3) | 65.37 | **61.17** | 50.87 | **63.18** | 41.48 |
| Netback | | | | | |
| Commodity sales from production ($/boe)(3) | 65.37 | **61.17** | 50.87 | **63.18** | 41.48 |
| Royalties ($/boe)(3) | (9.23) | **(10.18)** | (5.44) | **(9.59)** | (3.64) |
| Operating expense ($/boe)(3) | (4.69) | **(4.37)** | (3.50) | **(4.44)** | (3.86) |
| Transportation expense ($/boe)(3) | (6.08) | **(5.70)** | (5.47) | **(5.90)** | (4.79) |
| Netback ($/boe)(4) | 45.37 | **40.92** | 36.46 | **43.25** | 29.19 |
| **TRADING STATISTICS**(5) | | | | | |
| High price | 19.51 | **20.49** | 13.34 | **22.88** | 13.34 |
| Low price | 13.12 | **17.05** | 10.20 | **11.66** | 5.88 |
| Close price | 16.59 | **18.25** | 11.50 | **18.25** | 11.50 |
| Average daily volume (thousands of shares) | 5,315 | **4,259** | 3,173 | **6,563** | 3,160 |
| (1) | Per share amounts, with the exception of dividends, are based on weighted average diluted common shares. |
|---|---|
| (2) | Comparative figures represent ARC’s results prior to the closing of the business combination with Seven Generations on April 6, 2021, and therefore do not reflect historical data from Seven Generations. |
| (3) | See *“Non-GAAP and Other Financial Measures”* in the 2022 Annual MD&A for an explanation of the composition of this supplementary financial measure, which information is incorporated by reference into this news release. |
| (4) | Non-GAAP ratio that is not a standardized financial measure under IFRS and may not be comparable to similar ratios disclosed by other issuers. Netback, a non-GAAP financial measure, is used as a component of the non-GAAP ratio. See “Netback” and *“Non-GAAP and Other Financial Measures”* in the 2022 Annual MD&A for the non-GAAP ratio for the comparative period and other information relating to this non-GAAP ratio, which information is incorporated by reference into this news release. |
| (5) | Trading prices are stated in Canadian dollars on a per share basis and are based on intra-day trading on the Toronto Stock Exchange. |
**OUTLOOK**
ARC is well positioned to build on its 2022 record performance over the next several years. Kakwa continues to exhibit strong performance and ARC has regained operational momentum in British Columbia (“BC”) following the receipt of permits on freehold lands in late 2022.
- ARC has resumed activity in BC. With more than 95 per cent of its existing BC production base on freehold land, the Company is well positioned as it continues to receive freehold permits required to fully execute its 2023 capital program. This includes the 80 MMcf/day natural gas expansion at Sunrise, one of ARC’s most profitable assets with near zero emissions.
- In January 2023, the BC government and several of the Treaty 8 First Nations reached agreements regarding future resource development in the province. ARC is evaluating the details of the agreements while engaging and collaborating with its neighbouring Indigenous communities in BC. After understanding the new regulatory process, the Company will be in a position to make a decision as it relates to sanctioning of Attachie West Phase I.
- Total project costs for Attachie West Phase I remain unchanged and are estimated to be approximately $700 million. This includes capital required for the construction of the facility and initial wells required to fill it. Phase I is estimated to pay out in approximately two years based on US$70 per barrel WTI and $3.50 per GJ AECO.
2023 Guidance
ARC’s 2023 preliminary corporate guidance is unchanged since its announcement in November 2022. ARC continues to monitor inflation and work proactively with its partners across the supply chain to ensure it has sufficient access to services to safely and efficiently execute its program.
- In 2023, ARC intends to invest $1.8 billion(1) in capital expenditures and deliver average production of approximately 345,000 to 350,000 boe per day (60 per cent natural gas and 40 per cent crude oil and liquids).
- In 2024, capital expenditures are expected to decrease to between $1.5 billion and $1.6 billion with average production forecasted to average approximately 350,000 boe per day (60 per cent natural gas and 40 per cent crude oil and liquids).
- Lower anticipated capital requirements in 2024 to sustain a higher level of production is expected to be a result of i) lower base declines at Kakwa, ii) lower investment in infrastructure at Kakwa, and iii) the absence of the one-time investment required in 2023 to restore BC production.
| (1) | Refer to the section entitled *“About ARC Resources Ltd.”* contained within the 2022 Annual MD&A for historical capital expenditures, which information is incorporated by reference into this news release. |
|---|---|
ARC’s 2022 and 2023 annual guidance and a review of 2022 actual results are outlined below:
| | **2022 Guidance** | **2022 Actuals** | **% Variance from 2022 Guidance** | **2023 Guidance** |
|---|---|---|---|---|
| Crude oil (bbl/day) | 8,000 – 9,000 | **7,904** | (1) | 8,500 – 9,000 |
| Condensate (bbl/day) | 77,000 – 81,000 | **78,489** | — | 79,000 – 81,000 |
| Crude oil and condensate (bbl/day) | 85,000 – 90,000 | **86,393** | — | 87,500 – 90,000 |
| Natural gas (MMcf/day) | 1,240 – 1,260 | **1,259** | — | 1,260 – 1,270 |
| NGLs (bbl/day) | 48,000 – 50,000 | **49,385** | — | 47,000 – 49,000 |
| Total (boe/day) | 340,000 – 350,000 | **345,613** | — | 345,000 – 350,000 |
| Expenses ($/boe)(1) | | | | |
| Operating | 4.00 – 4.50 | **4.44** | — | 4.60 – 5.00 |
| Transportation | 5.35 – 5.75 | **5.90** | 3 | 5.50 – 6.00 |
| General and administrative (“G&A”) expense before share-based compensation expense | 0.80 – 0.90 | **1.00** | 11 | 0.85 – 0.95 |
| G&A – share-based compensation expense(2) | 0.60 – 0.70 | **0.69** | — | 0.25 – 0.35 |
| Interest and financing(3) | 0.55 – 0.65 | **0.68** | 5 | 0.65 – 0.75 |
| Current income tax expense as a per cent of funds from operations(1) | 3 – 8 | **8** | — | 10 – 15 |
| Capital expenditures ($ billions) | 1.35 – 1.45 | **1.4** | — | 1.8 |
| (1) | See *“Non-GAAP and Other Financial Measures”* in the 2022 Annual MD&A for an explanation of the composition of these supplementary financial measures, which information is incorporated by reference into this news release. |
|---|---|
| (2) | Comprises expense recognized under all share-based compensation plans. |
| (3) | Excludes accretion of ARC’s asset retirement obligation. |
- ARC’s 2022 financial and operational results were largely within guidance. ARC’s G&A expense before share-based compensation expense per boe was above guidance as a result of increased employee compensation and corporate costs. Transportation expense per boe was three per cent above guidance reflecting higher fuel gas expense from stronger commodity prices. Interest and financing was slightly above the guidance range as short-term borrowing rates increased throughout 2022.
Free Funds Flow Allocation
ARC’s goal is to provide shareholders with an attractive total return while adhering to the Company’s guiding principles of balance sheet strength, capital discipline, and a focus on profitability. This is achieved through profitable investments in its assets, complemented by a meaningful return of capital that grows over time.
In 2023, ARC anticipates that the proportion of free funds flow allocated to shareholders will increase towards the upper half of its free funds allocation range of between 50 to 100 per cent. Greater operating momentum in BC along with further strengthening of the balance sheet supports an increasing proportion of free funds flow returned to shareholders.
- Base dividend and base dividend growth compounded by share repurchases below intrinsic value remain the optimal mechanism to return capital.
- In 2022, ARC repurchased 10 per cent of its issued and outstanding shares through the NCIB and increased the base dividend by 50 per cent. ARC intends to continue to grow the base dividend with the underlying profitability of the business, and increase it on a per share basis as shares are retired through the NCIB or other means.
- The current dividend level remains sustainable through the current commodity cycle.
**FINANCIAL AND OPERATIONAL RESULTS**
Production and Operating Expense
*Production*
- ARC’s production averaged 359,730 boe per day during the fourth quarter of 2022 (61 per cent natural gas and 39 per cent crude oil and liquids). Production per share increased 16 per cent compared to the fourth quarter of 2021 and was in-line with Company guidance despite cold weather and unplanned downtime that impacted volumes in December.
- Production increased by five per cent in the fourth quarter compared to the third quarter of 2022. This increase was driven by growth at Kakwa, which averaged 188,183 boe per day (59 per cent crude oil and liquids and 41 per cent natural gas).
- Capital efficiencies have improved at Kakwa through wider well spacing along with a revised frac design that lowers water intensity and overall costs after adjusting for inflation.
- Full-year production averaged a record 345,613 boe per day (61 per cent natural gas and 39 per cent crude oil and liquids). Production was in-line with guidance and represented a 14 per cent increase from average daily production in 2021.
- First quarter production in 2023 is expected be lower than the fourth quarter of 2022 due to unplanned third-party outages. Production is expected to be fully restored in February 2023 and full-year production guidance is unchanged due to stronger than forecast base production offsetting the impact from these outages.
*Operating Expense*
- ARC’s fourth quarter 2022 operating expense of $4.37 per boe decreased seven per cent from the third quarter of 2022, due to lower planned maintenance activity and higher production. In 2022, ARC’s operating expense of $4.44 per boe was in-line with the Company’s guidance range of $4.00 to $4.50.
- Operating expense per boe in 2023 is anticipated to average between $4.60 and $5.00 per boe. In 2024, the water infrastructure investment at Kakwa is expected to reduce corporate operating expense by $0.50 per boe once it is commissioned by reducing trucking and third-party disposal costs, while lowering emissions.
Free Funds Flow, Funds from Operations, and Cash Flow from Operating Activities
*Free Funds Flow*
- ARC generated free funds flow of $603 million ($0.96 per share) during the fourth quarter of 2022. ARC distributed 68 per cent or $411 million ($0.65 per share) of free funds flow to shareholders through a combination of dividends and share repurchases under its NCIB.
- In 2022, ARC generated record free funds flow of $2.3 billion ($3.42 per share), of which 71 per cent or $1.6 billion ($2.43 per share) was distributed to shareholders.
*Funds from Operations and Cash Flow from Operating Activities*
- ARC generated funds from operations of $986 million ($1.56 per share) during the fourth quarter of 2022, increasing by $33 million ($0.11 per share) from the third quarter of 2022. Lower realized losses on ARC’s risk management contracts were partially offset by increased royalties.
- Fourth quarter and full-year 2022 cash flow from operating activities was $878 million and $3.8 billion, respectively.
The following table details the change in funds from operations for the fourth quarter of 2022 relative to the third quarter of 2022.
| **Funds from Operations Reconciliation** | **$ millions** | **$/share(1)** |
|---|---|---|
| Funds from operations for the three months ended September 30, 2022 | 953.0 | 1.45 |
| Production volumes | | |
| Crude oil and liquids | **5.7** | **0.01** |
| Natural gas | **70.3** | **0.11** |
| Commodity prices | | |
| Crude oil and liquids | **9.5** | **0.01** |
| Natural gas | **(118.0)** | **(0.18)** |
| Sales of commodities purchased from third parties | **92.1** | **0.14** |
| Interest and other income | **1.7** | **—** |
| Realized loss on risk management contracts | **74.4** | **0.11** |
| Royalties | **(46.3)** | **(0.07)** |
| Expenses | | |
| Commodities purchased from third parties | **(90.5)** | **(0.14)** |
| Operating | **2.8** | **—** |
| Transportation | **2.7** | **—** |
| G&A | **(6.6)** | **(0.01)** |
| Interest and financing | **(0.7)** | **—** |
| Current income tax | **6.5** | **0.01** |
| Realized gain on foreign exchange | **29.4** | **0.05** |
| Other | **0.2** | **—** |
| Weighted average shares, diluted | **—** | **0.07** |
| Funds from operations for the three months ended December 31, 2022 | **986.2** | **1.56** |
| (1) | Per share amounts are based on weighted average diluted common shares. |
|---|---|
Cash Flow Used in Investing Activities and Capital Expenditures
- In the fourth quarter 2022, ARC’s cash flow used in investing activities was $351 million. Of this, ARC invested $377 million into capital expenditures to drill 42 wells and complete 20 wells, primarily in Kakwa.
- ARC executed its 2022 capital program safely and efficiently. Cash flow used in investing activities totalled $1.4 billion and delivered record annual production. In addition to drilling 134 wells and completing 126 wells, ARC invested in infrastructure at Sunrise and the electrification of its Dawson Phase III and IV facilities.
The following table details ARC’s 2022 capital activity by area.
| | **Year Ended December 31, 2022** |
|---|---|
| **Area** | **Wells Drilled(1)(2)** | **Wells Completed(1)** |
| Kakwa | **104** | **81** |
| Greater Dawson | **6** | **16** |
| Sunrise | **5** | **9** |
| Ante Creek | **19** | **20** |
| **Total** | **134** | **126** |
| (1) | Wells drilled and completed for operated assets only. |
|---|---|
| (2) | Excludes disposal wells. |
Returns to Shareholders
*Dividends*
- In the first quarter of 2022, ARC’s board of directors (the “Board”) approved an increase of 20 per cent to the Company’s quarterly dividend, from $0.10 per share to $0.12 per share.
- Subsequently in the third quarter of 2022, ARC’s Board approved an increase of 25 per cent to the Company’s quarterly dividend, from $0.12 per share to $0.15 per share, beginning with its dividend payable on January 16, 2023 to shareholders of record on December 30, 2022.
- During the fourth quarter and full-year 2022, ARC declared dividends of $93 million ($0.15 per share) and $318 million ($0.49 per share), respectively.
- The dividend serves as a permanent mechanism to return capital to shareholders over the long term. ARC’s dividend is designed to grow with the underlying profitability of the business, and be sustainable through the commodity cycle, as the number of shares are reduced through the NCIB.
*Share Repurchases*
- Since commencing its initial NCIB in September 2021, ARC has repurchased approximately 15 per cent of total outstanding shares, or 107 million common shares, at a weighted average price of $15.55 per share.
- During the fourth quarter of 2022, ARC repurchased 17 million common shares under its NCIB at a weighted average price of $18.57 per share.
- In 2022, ARC returned 71 per cent of free funds flow to shareholders through a growing base dividend and share repurchases.
- Since renewing its NCIB on August 30, 2022, ARC has repurchased 35 million common shares, representing 53 per cent of its current NCIB allotment.
- ARC will continue to repurchase common shares when the intrinsic value of the Company’s common shares exceeds the current market trading price. ARC determines the intrinsic value using a discounted cash flow framework under lower commodity price assumptions and a range of discount rates.
Physical Marketing
- ARC’s infrastructure ownership and committed takeaway capacity to end markets played a critical role in mitigating AECO volatility and capturing additional margin in periods of price volatility in North America.
- ARC’s average realized natural gas price during the fourth quarter was $8.31 per Mcf, 49 per cent higher than the average AECO 7A Monthly Index price for the period. Market diversification included 170,000 MMBtu per day of physical exposure to Malin, where the PG&E Malin daily price averaged US$14.42 per Mcf during the fourth quarter.
- Full-year 2022 market diversification activities resulted in an average realized natural gas price of $8.15 per Mcf; $2.59 per Mcf, or 47 per cent, greater than the average AECO 7A Monthly Index price.
*Transportation Expense*
- ARC’s fourth quarter 2022 transportation expense per boe of $5.70 decreased six per cent from the third quarter of 2022. The decrease from the third quarter of 2022 reflects slightly lower fuel gas expense.
- ARC’s transportation expense per boe of $5.90 for 2022 increased 23 per cent compared to the full-year 2021. The increase reflects higher fuel gas expense with a corresponding increase to commodity sales from production.
Net Debt
- As of December 31, 2022, ARC’s long-term debt balance was $1.0 billion, and its net debt balance was $1.3 billion, or 0.4 times funds from operations.
- ARC targets its net debt to be in the range of 1.0 to 1.5 times funds from operations at mid-cycle commodity prices.
- Long-term debt is comprised solely of $1.0 billion of senior notes outstanding. There were no borrowings under the Company’s credit facility as of December 31, 2022.
- During the year, ARC reduced its long-term debt by $0.7 billion and its net debt by $0.5 billion.
- In the fourth quarter of 2022, ARC renewed its credit facility, extending the maturity date by one year to October 2026, and elected to reduce the credit facility capacity from $2.0 billion to $1.8 billion.
- ARC holds an investment-grade credit rating, which allows the Company to have access to capital and to manage a low-cost capital structure. ARC is committed to protecting its strong financial position by maintaining significant financial flexibility with its balance sheet.
Net Income
- ARC recognized net income of $741 million ($1.18 per share) during the fourth quarter of 2022, an increase of $63 million ($0.22 per share) from the same period in the prior year.
- In 2022, ARC recognized net income of $2.3 billion ($3.47 per share), compared to net income of $787 million ($1.25 per share) in 2021.
- The increase in net income compared to the prior year was primarily due to higher commodity sales from production.
**ESG INITIATIVES**
ARC continues to be recognized for its industry-leading ESG performance. The application of emissions reduction technologies has been the primary driver behind the Company’s top-tier environmental performance advancement of technologies through the lifecycle will remain a key priority.
- **EO100™ Certification** – In January 2023, ARC achieved certification of its Ante Creek asset under Equitable Origin’s EO100™ Standard for Responsible Energy Development. With this certification and prior certifications received in 2022 for Kakwa and the Company’s northeast BC assets, 100 per cent of the Company’s assets are now certified under this global standard, representing the largest certified production base in Canada.
- **Dawson Electrification** – ARC’s emissions intensity in BC is among the lowest in North America. In 2023, ARC will invest approximately $16 million to continue the electrification of its Dawson phase III and IV facilities. Once complete, electrification will result in an emissions reduction of approximately 140,000 tonnes, which is equivalent to removing 28,000 cars or one per cent of passenger vehicles in BC off the road each year.
- **Carbon Capture & Sequestration Hub** – In 2022, ARC was awarded an evaluation permit from the Government of Alberta that allows ARC to evaluate the feasibility of a carbon capture and sequestration (“CCS”) hub near Kakwa. The evaluation permit preserves ARC’s access to pore space in the region, while providing the opportunity to evaluate the technical, economic and commercial feasibility of a CCS hub.
**2022 RESERVES**
Highlights
For the 15th consecutive year, 2P reserve replacement from development has been 140 per cent of produced reserves or greater since the Company’s flagship Dawson asset was commissioned in 2008. At year-end 2022, ARC’s $34.00 per share before-tax NPV of 2P reserves registers as the highest in its 26-year history, and is based on the development of just 17 per cent of ARC’s internal estimate of drilling inventory.
- ARC’s before-tax NPV for 2P reserves, discounted at 10 per cent, was $21.1 billion, or approximately $34.00 per share at December 31, 2022, increasing 49 per cent from ARC’s 2P NPV per share at December 31, 2021. This is based on the development of approximately 900 gross 2P locations, which represents just 17 per cent of the Company’s total gross internal inventory estimates.
- ARC’s before-tax NPV of $34.00 per share is based on the development of approximately 900 gross 2P locations, which represents just 17 per cent of the Company’s total gross internal inventory estimates. 2P locations at Attachie account for less than four per cent of total 2P locations with just 34 undeveloped locations booked at year-end 2022.
- ARC’s before-tax NPV for PDP reserves was $8.1 billion, or $13.00 per share, an increase of 61 per cent per share compared to 2021.
- ARC’s reserves increased between 14 per cent and 22 per cent on a per share basis, reinvesting 39 per cent of funds from operations.
- PDP reserves increased nine per cent (22 per cent per share) with notable positive technical revisions as a result of strong well performance, particularly at Kakwa. Positive technical revisions accounted for a nine per cent increase in PDP volumes, with Kakwa seeing the largest volume add with an 11 per cent increase in PDP volumes.
- PDP FD&A including FDC costs of $8.31 per boe resulted in a 5.2 times PDP recycle ratio.
- ARC’s reserve life index increased on a PDP, Total Proved, and 2P basis in 2022, driven by strong technical revisions and drilling extensions.
- ARC’s NPV was determined using GLJ forecast pricing and foreign exchange rates at January 1, 2023, with a 10-year average WTI price of US$80 per barrel and a 10-year average AECO price of $4.66 per million British thermal units (“MMBtu”).
- FDC for 2P reserves totaled $9.1 billion at December 31, 2022 as compared to $7.4 billion at December 31, 2021. The increase in FDC is primarily due to higher inflation expectations; 2P FDC equates to five times 2023 capital expenditure guidance or 2.5 times 2022 funds from operations.
Reserves Reconciliation
| **Reserves ReconciliationCompany Gross**(1) | **Oil**(2)(Mbbl) | **NGLs**(3)(Mbbl) | **Total Oiland NGLs**(4)(Mbbl) | **NaturalGas**(5)(MMcf) | **Oil Equivalent**(Mboe) |
|---|---|---|---|---|---|
| **Proved Producing** | | | | | |
| Opening Balance, December 31, 2021 | 10,450 | 158,983 | 169,433 | 2,000,085 | 502,780 |
| Extensions and Improved Recovery(6) | **2,108** | **50,038** | **52,146** | **420,021** | **122,150** |
| Technical Revisions | **165** | **18,173** | **18,338** | **165,179** | **45,868** |
| Acquisitions | **—** | **—** | **—** | **—** | **—** |
| Dispositions | **—** | **(184)** | **(184)** | **(2,291)** | **(566)** |
| Economic Factors | **292** | **1,081** | **1,373** | **18,588** | **4,471** |
| Production | **(2,822)** | **(46,668)** | **(49,490)** | **(459,317)** | **(126,043)** |
| **Ending Balance, December 31, 2022** | **10,192** | **181,423** | **191,615** | **2,142,265** | **548,659** |
| **Total Proved** | | | | | |
| Opening Balance, December 31, 2021 | 18,905 | 391,476 | 410,381 | 4,647,242 | 1,184,922 |
| Extensions and Improved Recovery(6) | **1,827** | **38,374** | **40,201** | **417,970** | **109,863** |
| Technical Revisions | **213** | **5,020** | **5,233** | **159,650** | **31,842** |
| Acquisitions | **—** | **—** | **—** | **—** | **—** |
| Dispositions | **—** | **(184)** | **(184)** | **(2,291)** | **(566)** |
| Economic Factors | **575** | **3,320** | **3,895** | **31,325** | **9,116** |
| Production | **(2,822)** | **(46,668)** | **(49,490)** | **(459,317)** | **(126,043)** |
| **Ending Balance, December 31, 2022** | **18,698** | **391,339** | **410,037** | **4,794,579** | **1,209,133** |
| **Proved plus Probable** | | | | | |
| Opening Balance, December 31, 2021 | 31,252 | 576,364 | 607,616 | 6,918,191 | 1,760,648 |
| Extensions and Improved Recovery(6) | **2,809** | **72,436** | **75,244** | **573,838** | **170,884** |
| Technical Revisions | **214** | **8,150** | **8,364** | **38,012** | **14,700** |
| Acquisitions | **—** | **—** | **—** | **—** | **—** |
| Dispositions | **—** | **(234)** | **(234)** | **(3,153)** | **(760)** |
| Economic Factors | **579** | **1,899** | **2,477** | **39,868** | **9,122** |
| Production | **(2,822)** | **(46,668)** | **(49,490)** | **(459,317)** | **(126,043)** |
| **Ending Balance, December 31, 2022** | **32,031** | **611,947** | **643,978** | **7,107,440** | **1,828,551** |
| (1) | Amounts may not add due to rounding. |
|---|---|
| (2) | Oil includes Light, Medium, Heavy and Tight Oil. Tight Oil makes up 98 per cent of the total Oil. |
| (3) | Condensate and pentanes plus represented 62 per cent of PDP NGLs reserves, 66 per cent of TP NGLs reserves, and 67 per cent of 2P NGLs reserves for the respective opening balances at December 31, 2021. Condensate and pentanes plus represent 63 per cent of PDP NGLs reserves, 66 per cent of TP NGLs reserves, and 69 per cent of 2P NGLs reserves for the respective ending balances at December 31, 2022. |
| (4) | Total Oil and NGLs represents the summation of Light, Medium, Heavy Oil, and Tight Oil, and NGLs. |
| (5) | Natural Gas includes shale gas and conventional natural gas product types, as conventional natural gas makes up less than one per cent of total gas and is therefore considered to be immaterial. |
| (6) | Reserves additions for discoveries, infill drilling, improved recovery, and extensions are combined and reported as “Extensions and Improved Recovery”. |
Net Present Value Summary
For a summary of the GLJ forecast pricing and foreign exchange rates used to evaluate ARC’s reserves, see *“2022 Independent Qualified Reserves Evaluation”* of this news release.
| ($ millions) | **Undiscounted** | **Discounted at 10%** |
|---|---|---|
| **Before-tax NPV**(1)(2) | | |
| Proved Producing | **11,742** | **8,096** |
| Proved Developed Non-producing | **2,627** | **1,766** |
| Proved Undeveloped | **11,193** | **4,798** |
| Total Proved | **25,562** | **14,660** |
| Probable | **17,559** | **6,484** |
| Proved plus Probable | **43,121** | **21,144** |
| **After-tax NPV**(1)(2)(3)(4) | | |
| Proved Producing | **9,863** | **6,903** |
| Proved Developed Non-producing | **1,999** | **1,332** |
| Proved Undeveloped | **8,445** | **3,419** |
| Total Proved | **20,308** | **11,655** |
| Probable | **13,323** | **4,847** |
| Proved plus Probable | **33,631** | **16,501** |
| (1) | Amounts may not add due to rounding. |
|---|---|
| (2) | Based on NI 51-101 company net interest reserves and GLJ forecast pricing and foreign exchange rates and costs at January 1, 2023. |
| (3) | Based on ARC’s estimated tax pools at December 31, 2022. |
| (4) | The after-tax NPV of the future net revenue attributed to ARC’s crude oil and natural gas properties reflects the tax burden on the properties on a standalone basis and does not necessarily reflect the business entity tax-level situation or tax planning. For information at the business entity level, see*Taxes* in the 2022 Annual MD&A. |
Finding, Development and Acquisition Costs
- ARC delivered a 2P finding and development (“F&D”) cost, including FDC, of $16.18 per boe(1) ($7.42 per boe excluding FDC) from development additions in 2022, continuing to demonstrate the high-quality nature of its Montney assets and the Company’s ability to consistently deliver strong well results through efficient development planning and operational execution. Including net acquisitions and dispositions, ARC’s 2P FD&A cost, including FDC, was $16.18 per boe(1) ($7.39 per boe excluding FDC).
- The year-over-year increase in F&D costs including FDC reflects significant increase in FDC driven by inflation.
- FD&A costs are provided including and excluding the change in FDC in the table below.
| **Including FDC** | **F&D Cost**(2)($/boe) | **FD&A Cost**(2)($/boe) | **F&D RecycleRatio**(2) | **FD&A Recycle Ratio**(2) |
|---|---|---|---|---|
| **Proved Producing**(3) | | | | |
| 2022 | **8.35** | **8.31** | **5.2** | **5.2** |
| 2021 | 8.48 | 16.75 | 3.4 | 1.7 |
| 2020 | 4.29 | 4.33 | 2.7 | 2.6 |
| Three-year Average(4) | 7.63 | 12.80 | 4.1 | 2.5 |
| **Total Proved**(3) | | | | |
| 2022 | **16.92** | **16.90** | **2.6** | **2.6** |
| 2021 | 7.78 | 12.68 | 3.8 | 2.3 |
| 2020 | 2.60 | 2.07 | 4.4 | 5.5 |
| Three-year Average(4) | 10.24 | 12.60 | 3.1 | 2.5 |
| **Proved plus Probable**(3) | | | | |
| 2022 | **16.18** | **16.18** | **2.7** | **2.7** |
| 2021 | 7.28 | 10.39 | 4.0 | 2.8 |
| 2020 | 2.34 | 1.89 | 4.9 | 6.1 |
| Three-year Average(4) | 9.70 | 10.77 | 3.3 | 2.9 |
| **Excluding FDC** | **F&D Cost**(2)($/boe) | **FD&A Cost**(2)($/boe) | **F&D RecycleRatio**(2) | **FD&A Recycle Ratio**(2) |
|---|---|---|---|---|
| **Proved Producing**(3) | | | | |
| 2022 | **8.37** | **8.33** | **5.2** | **5.2** |
| 2021 | 8.08 | 16.27 | 3.6 | 1.8 |
| 2020 | 4.88 | 4.94 | 2.3 | 2.3 |
| Three-year Average(4) | 7.62 | 12.60 | 4.2 | 2.5 |
| **Total Proved**(3) | | | | |
| 2022 | **9.58** | **9.54** | **4.5** | **4.5** |
| 2021 | 7.31 | 8.11 | 4.0 | 3.6 |
| 2020 | 4.04 | 5.11 | 2.8 | 2.2 |
| Three-year Average(4) | 7.47 | 8.12 | 4.2 | 3.9 |
| **Proved plus Probable**(3) | | | | |
| 2022 | **7.42** | **7.39** | **5.8** | **5.9** |
| 2021 | 6.76 | 5.96 | 4.3 | 4.9 |
| 2020 | 2.87 | 4.37 | 4.0 | 2.6 |
| Three-year Average(4) | 6.04 | 6.08 | 5.2 | 5.2 |
| (1) | Non-GAAP ratio that is not a standardized financial measure under IFRS and may not be comparable to similar ratios disclosed by other issuers. Capital expenditures and adjusted net capital acquisitions, both non-GAAP financial measures, are used as components of the non-GAAP ratio. See *“Non-GAAP and Other Financial Measures”* of this news release for the non-GAAP ratio for the comparative period and other information relating to this non-GAAP ratio. |
|---|---|
| (2) | F&D and FD&A costs and recycle ratios take into account reserves revisions during the year on a per boe basis, and include FDC. |
| (3) | The aggregate of the exploration and development costs incurred in the financial year and the changes during that year in estimated FDC may not reflect the total F&D and FD&A costs related to reserves additions for that year. |
| (4) | Three-year average F&D and FD&A costs are calculated as the total capital expenditures over the three prior years divided by the total reserves additions over the three prior years. The three-year average recycle ratio is calculated as the three-year F&D or FD&A costs divided by the three-year average netback per boe. |
**CONFERENCE CALL**
ARC’s senior leadership team will be hosting a conference call to discuss the Company’s fourth quarter and full-year 2022 results on Friday, February 10, 2022, at 8:00 a.m. Mountain Time (“MT”).
| Date | Friday, February 10, 2023 |
|---|---|
| Time | 8:00 a.m. MT |
| Dial-in Numbers | |
| Calgary | 587-880-2171 |
| Toronto | 416-764-8659 |
| Toll-free | 1-888-664-6392 |
| Conference ID | 22313485 |
| Webcast URL | https://app.webinar.net/9knZ8rXoJG0 |
| | |
Callers are encouraged to dial in 15 minutes before the start time to register for the event.
**CONSOLIDATED BALANCE SHEETS** (unaudited)
As at
| Cdn$ millions | **December 31, 2022** | December 31, 2021 |
|---|---|---|
| | | |
| **ASSETS** | | |
| Current assets | | |
| Cash and cash equivalents | **57.1** | — |
| Inventory | **6.7** | 22.3 |
| Accounts receivable | **863.2** | 672.0 |
| Prepaid expense | **52.5** | 35.6 |
| Risk management contracts | **0.9** | 0.1 |
| Assets held for sale | **6.1** | — |
| | **986.5** | 730.0 |
| Risk management contracts | **13.3** | — |
| Long-term investment | **14.5** | 2.5 |
| Exploration and evaluation assets | **290.9** | 277.9 |
| Property, plant and equipment | **9,300.3** | 9,265.6 |
| Right-of-use assets | **770.2** | 856.1 |
| Goodwill | **248.2** | 248.2 |
| Total assets | **11,623.9** | 11,380.3 |
| | | |
| **LIABILITIES** | | |
| Current liabilities | | |
| Accounts payable and accrued liabilities | **1,190.9** | 761.5 |
| Current portion of lease obligations | **92.4** | 109.3 |
| Current portion of other deferred liabilities | **20.0** | 90.5 |
| Current portion of asset retirement obligation | **16.0** | 15.0 |
| Dividends payable | **93.4** | 69.5 |
| Risk management contracts | **303.0** | 465.3 |
| | **1,715.7** | 1,511.1 |
| | | |
| Risk management contracts | **38.1** | 171.9 |
| Long-term portion of lease obligations | **702.9** | 760.0 |
| Long-term debt | **990.0** | 1,705.3 |
| Long-term incentive compensation liability | **48.1** | 40.8 |
| Other deferred liabilities | **135.7** | 154.2 |
| Asset retirement obligation | **378.3** | 535.3 |
| Deferred taxes | **961.6** | 574.2 |
| Total liabilities | **4,970.4** | 5,452.8 |
| | | |
| **SHAREHOLDERS’ EQUITY** | | |
| Shareholders’ capital | **6,497.6** | 7,221.1 |
| Contributed surplus | **39.9** | 46.3 |
| Retained earnings (deficit) | **139.1** | (1,337.4) |
| Accumulated other comprehensive loss | **(23.1)** | (2.5) |
| Total shareholders’ equity | **6,653.5** | 5,927.5 |
| Total liabilities and shareholders’ equity | **11,623.9** | 11,380.3 |
Refer to the accompanying notes to ARC’s consolidated financial statements as at and for the year ended December 31, 2022.
**CONSOLIDATED STATEMENTS OF INCOME** (unaudited)
For the three months and years ended December 31
| | **Three Months Ended** | **Year Ended** |
|---|---|---|
| (Cdn$ millions, except per share amounts) | **2022** | 2021 | **2022** | 2021 |
| | | | | |
| Commodity sales from production | **2,024.4** | 1,618.5 | **7,969.9** | 4,572.6 |
| Royalties | **(336.8)** | (172.7) | **(1,209.2)** | (400.7) |
| Sales of commodities purchased from third parties | **458.1** | 329.9 | **1,880.5** | 938.9 |
| Revenue from commodity sales | **2,145.7** | 1,775.7 | **8,641.2** | 5,110.8 |
| | | | | |
| Interest and other income | **3.7** | 3.6 | **20.1** | 17.5 |
| Gain (loss) on risk management contracts | **39.6** | 103.4 | **(999.0)** | (1,041.6) |
| Total revenue, interest and other income, and gain (loss) on risk management contracts | **2,189.0** | 1,882.7 | **7,662.3** | 4,086.7 |
| | | | | |
| Commodities purchased from third parties | **422.4** | 322.4 | **1,783.3** | 903.9 |
| Operating | **144.7** | 111.5 | **559.9** | 425.4 |
| Transportation | **188.6** | 174.2 | **744.2** | 528.3 |
| General and administrative | **56.0** | 46.0 | **213.2** | 167.0 |
| Transaction costs | **—** | — | **—** | 22.1 |
| Interest and financing | **25.5** | 24.2 | **97.2** | 126.1 |
| Impairment of financial assets | **4.2** | 2.0 | **6.7** | 4.0 |
| Depletion, depreciation and amortization | **364.2** | 320.1 | **1,317.3** | 1,063.6 |
| Reversal of impairment of property, plant and equipment | **—** | — | **(3.6)** | (137.5) |
| Loss (gain) on foreign exchange | **4.7** | (5.5) | **(34.1)** | (11.3) |
| Total expenses | **1,210.3** | 994.9 | **4,684.1** | 3,091.6 |
| Net income before income taxes | **978.7** | 887.8 | **2,978.2** | 995.1 |
| | | | | |
| Provision for (recovery of) income taxes | | | | |
| Current | **68.5** | (14.0) | **288.5** | 33.7 |
| Deferred | **169.2** | 223.8 | **387.4** | 174.8 |
| Total income taxes | **237.7** | 209.8 | **675.9** | 208.5 |
| | | | | |
| Net income | **741.0** | 678.0 | **2,302.3** | 786.6 |
| | | | | |
| Net income per share | | | | |
| Basic | **1.18** | 0.97 | **3.48** | 1.26 |
| Diluted | **1.18** | 0.96 | **3.47** | 1.25 |
Refer to the accompanying notes to ARC’s consolidated financial statements as at and for the year ended December 31, 2022.
**CONSOLIDATED STATEMENTS OF COMPREHENSIVE INCOME** (unaudited)
For the three months and years ended December 31
| | **Three Months Ended** | **Year Ended** |
|---|---|---|
| (Cdn$ millions) | **2022** | 2021 | **2022** | 2021 |
| | | | | |
| Net income | **741.0** | 678.0 | **2,302.3** | 786.6 |
| Items that may be reclassified to the consolidated statements of income in subsequent periods: | | | | |
| Net unrealized gain (loss) on foreign currency translation adjustment | **5.1** | (0.9) | **(20.6)** | (2.5) |
| Comprehensive income | **746.1** | 677.1 | **2,281.7** | 784.1 |
Refer to the accompanying notes to ARC’s consolidated financial statements as at and for the year ended December 31, 2022.
**CONSOLIDATED STATEMENTS OF CHANGES IN SHAREHOLDERS’ EQUITY** (unaudited)
For the years ended December 31
| (Cdn$ millions) | **Shareholders’ Capital** | **ContributedSurplus** | **Retained Earnings (Deficit)** | **Accumulated Other Comprehensive Loss** | **Total Shareholders’ Equity** |
|---|---|---|---|---|---|
| | | | | | |
| January 1, 2021 | 4,658.2 | 36.5 | (1,904.1) | — | 2,790.6 |
| Comprehensive income | — | — | 786.6 | (2.5) | 784.1 |
| Issued upon close of Business Combination | 2,903.5 | 10.5 | — | — | 2,914.0 |
| Recognized under share-based compensation plans | 0.3 | 3.3 | — | — | 3.6 |
| Recognized on exercise of share options | 17.7 | (4.0) | — | — | 13.7 |
| Repurchase of shares for cancellation | (321.1) | — | (24.1) | — | (345.2) |
| Change in liability for share purchase commitment | (37.5) | — | (14.4) | — | (51.9) |
| Dividends declared | — | — | (181.4) | — | (181.4) |
| December 31, 2021 | 7,221.1 | 46.3 | (1,337.4) | (2.5) | 5,927.5 |
| Comprehensive income | **—** | **—** | **2,302.3** | **(20.6)** | **2,281.7** |
| Recognized under share-based compensation plans | **(0.3)** | **1.5** | **—** | **—** | **1.2** |
| Recognized on exercise of share options | **37.3** | **(7.9)** | **—** | **—** | **29.4** |
| Repurchase of shares for cancellation | **(781.1)** | **—** | **(513.7)** | **—** | **(1,294.8)** |
| Change in liability for share purchase commitment | **20.6** | **—** | **6.1** | **—** | **26.7** |
| Dividends declared | **—** | **—** | **(318.2)** | **—** | **(318.2)** |
| December 31, 2022 | **6,497.6** | **39.9** | **139.1** | **(23.1)** | **6,653.5** |
Refer to the accompanying notes to ARC’s consolidated financial statements as at and for the year ended December 31, 2022.
**CONSOLIDATED STATEMENTS OF CASH FLOWS** (unaudited)
For the three months and years ended December 31
| | **Three Months Ended** | **Year Ended** |
|---|---|---|
| (Cdn$ millions) | **2022** | 2021 | **2022** | 2021 |
| | | | | |
| **CASH FLOW FROM OPERATING ACTIVITIES** | | | | |
| Net income | **741.0** | 678.0 | **2,302.3** | 786.6 |
| Add items not involving cash: | | | | |
| Unrealized loss (gain) on risk management contracts | **(317.6)** | (384.9) | **(280.5)** | 534.2 |
| Accretion of asset retirement obligation | **3.1** | 2.6 | **11.0** | 9.5 |
| Impairment of financial assets | **4.2** | 2.0 | **6.7** | 4.0 |
| Depletion, depreciation and amortization | **364.2** | 320.1 | **1,317.3** | 1,063.6 |
| Reversal of impairment of property, plant and equipment | **—** | — | **(3.6)** | (137.5) |
| Unrealized loss (gain) on foreign exchange | **21.2** | (7.3) | **(28.8)** | (22.2) |
| Gain on disposal of crude oil and natural gas assets | **—** | — | **(2.0)** | — |
| Deferred taxes | **169.2** | 223.8 | **387.4** | 174.8 |
| Other | **0.9** | (0.7) | **2.7** | 2.4 |
| Net change in other liabilities | **(13.9)** | (56.4) | **(129.2)** | (224.8) |
| Change in non-cash working capital | **(94.0)** | (108.5) | **250.0** | (184.1) |
| Cash flow from operating activities | **878.3** | 668.7 | **3,833.3** | 2,006.5 |
| | | | | |
| **CASH FLOW USED IN FINANCING ACTIVITIES** | | | | |
| Draw of long-term debt under revolving credit facilities | **1,396.4** | 2,605.2 | **7,027.0** | 6,628.7 |
| Issuance of senior notes | **—** | — | **—** | 1,000.0 |
| Repayment of long-term debt | **(1,533.4)** | (2,739.7) | **(7,748.2)** | (8,304.7) |
| Proceeds from exercise of share options | **2.7** | 3.4 | **29.4** | 13.9 |
| Repurchase of shares | **(317.4)** | (229.2) | **(1,292.3)** | (340.6) |
| Repayment of principal relating to lease obligations | **(20.3)** | (19.8) | **(84.6)** | (63.0) |
| Cash dividends paid | **(76.7)** | (47.1) | **(294.3)** | (133.1) |
| Cash flow used in financing activities | **(548.7)** | (427.2) | **(2,363.0)** | (1,198.8) |
| | | | | |
| **CASH FLOW USED IN INVESTING ACTIVITIES** | | | |
| Cash acquired upon close of Business Combination | **—** | — | **—** | 4.9 |
| Acquisition of crude oil and natural gas assets | **(0.1)** | (0.2) | **(2.7)** | (1.1) |
| Disposal of crude oil and natural gas assets | **—** | 0.7 | **11.9** | 79.7 |
| Property, plant and equipment development expenditures | **(373.8)** | (371.7) | **(1,419.7)** | (1,051.5) |
| Exploration and evaluation asset expenditures | **(3.6)** | (0.7) | **(6.4)** | (2.3) |
| Long-term investment | **(3.3)** | (2.5) | **(12.0)** | (2.5) |
| Change in non-cash working capital | **30.1** | 105.7 | **15.7** | 164.7 |
| Cash flow used in investing activities | **(350.7)** | (268.7) | **(1,413.2)** | (808.1) |
| | | | | |
| **INCREASE (DECREASE) IN CASH AND CASH EQUIVALENTS** | **(21.1)** | (27.2) | **57.1** | (0.4) |
| **CASH AND CASH EQUIVALENTS, BEGINNING OF PERIOD** | **78.2** | 27.2 | **—** | 0.4 |
| **CASH AND CASH EQUIVALENTS, END OF PERIOD** | **57.1** | — | **57.1** | — |
| The following are included in cash flow from operating activities: | | | | |
| Income taxes paid (received) in cash | **(2.4)** | 5.2 | **(1.8)** | 56.9 |
| Interest paid in cash | **14.3** | 14.5 | **82.8** | 118.9 |
Refer to the accompanying notes to ARC’s consolidated financial statements as at and for the year ended December 31, 2022, which are available on ARC’s website at [www.arcresources.com](https://web.archive.org/web/20230209223017/http://www.arcresources.com/) and under ARC’s SEDAR profile at [www.sedar.com](https://web.archive.org/web/20230209223017/http://www.sedar.com/).
**NON-GAAP AND OTHER FINANCIAL MEASURES**
Throughout this news release and in other materials disclosed by the Company, ARC employs certain measures to analyze its financial performance, financial position, and cash flow. These non-GAAP and other financial measures are not standardized financial measures under IFRS and may not be comparable to similar financial measures disclosed by other issuers. The non-GAAP and other financial measures should not be considered to be more meaningful than generally accepted accounting principles (“GAAP”) measures which are determined in accordance with IFRS, such as net income, cash flow from operating activities, and cash flow used in investing activities, as indicators of ARC’s performance.
Non-GAAP Financial Measures
*Capital Expenditures*
ARC uses capital expenditures to monitor its capital investments relative to those budgeted by the Company on an annual basis. ARC’s capital budget excludes acquisition or disposition activities as well as the accounting impact of any accrual changes and payments under certain lease arrangements. The most directly comparable GAAP measure to capital expenditures is cash flow used in investing activities. The following table details the composition of capital expenditures and its reconciliation to cash flow used in investing activities.
| **Capital Expenditures** | **Three Months Ended** | **Year Ended** |
|---|---|---|
| ($ millions) | September 30, 2022 | **December 31, 2022** | December 31, 2021 | **December 31, 2022** | December 31, 2021 |
| Cash flow used in investing activities | 351.9 | **350.7** | 268.7 | **1,413.2** | 808.1 |
| Cash acquired upon close of Business Combination | — | **—** | — | **—** | 4.9 |
| Acquisition of crude oil and natural gas assets | (1.0) | **(0.1)** | (0.2) | **(2.7)** | (1.1) |
| Disposal of crude oil and natural gas assets | 4.5 | **—** | 0.7 | **11.9** | 79.7 |
| Long-term investments | (8.6) | **(3.3)** | (2.5) | **(12.0)** | (2.5) |
| Change in non-cash investing working capital | 22.1 | **30.1** | 105.7 | **15.7** | 164.7 |
| Other (1) | 4.0 | **5.9** | 2.5 | **15.8** | 8.0 |
| Capital expenditures | 372.9 | **383.3** | 374.9 | **1,441.9** | 1,061.8 |
| (1) | Comprises non-cash capitalized costs related to the Company’s right-of-use asset depreciation and share-based compensation. |
|---|---|
*Free Funds Flow*
ARC uses free funds flow as an indicator of the efficiency and liquidity of ARC’s business, measuring its funds after capital investment available to manage debt levels, pay dividends, and return capital to shareholders through share repurchases. ARC computes free funds flow as funds from operations generated during the period less capital expenditures. Capital expenditures is a non-GAAP financial measure. By removing the impact of current period capital expenditures from funds from operations, Management monitors its free funds flow to inform its capital allocation decisions. The most directly comparable GAAP measure to free funds flow is cash flow from operating activities. The following table details the calculation of free funds flow and its reconciliation to cash flow from operating activities.
| **Free Funds Flow** | **Three Months Ended** | **Year Ended** |
|---|---|---|
| ($ millions) | September 30, 2022 | **December 31, 2022** | December 31, 2021 | **December 31, 2022** | December 31, 2021 |
| Cash flow from operating activities | 1,103.6 | **878.3** | 668.7 | **3,833.3** | 2,006.5 |
| Net change in other liabilities | 43.3 | **13.9** | 56.4 | **129.2** | 224.8 |
| Change in non-cash operating working capital | (193.9) | **94.0** | 108.5 | **(250.0)** | 184.1 |
| Funds from operations | 953.0 | **986.2** | 833.6 | **3,712.5** | 2,415.4 |
| Capital expenditures(1) | (372.9) | **(383.3)** | (374.9) | **(1,441.9)** | (1,061.8) |
| Free funds flow | 580.1 | **602.9** | 458.7 | **2,270.6** | 1,353.6 |
| (1) | Certain additional disclosures for these specified financial measures have been incorporated by reference. See *“Cash Flow used in Investing Activities, Capital Expenditures, Acquisitions, and Dispositions”* in the 2022 Annual MD&A. |
|---|---|
*Adjusted Net Capital Acquisitions*
Adjusted net capital acquisitions is a non-GAAP financial measure used in the determination of FD&A costs, which is a non-GAAP ratio. Adjusted net capital acquisitions is useful as it provides a measure of cash, debt, and share consideration used to acquire crude oil and natural gas assets during the period, net of cash provided by the disposal of any crude oil and natural gas assets during the period. The most directly comparable GAAP measure to adjusted net capital acquisitions is acquisition of crude oil and natural gas assets. The following table details the calculation of adjusted net capital acquisitions and its reconciliation to acquisition of crude oil and natural gas assets.
| **Adjusted Net Capital Acquisitions** | **Year Ended** | Year Ended |
|---|---|---|
| ($ millions) | **December 31, 2022** | December 31, 2021 |
| Acquisition of crude oil and natural gas assets | **2.7** | 1.1 |
| Add: | | |
| Total consideration in Business Combination | **—** | 2,914.0 |
| Debt acquired in Business Combination | **—** | 1,712.7 |
| Remove: | | |
| Disposal of crude oil and natural gas assets | **(11.9)** | (79.7) |
| Adjusted net capital acquisitions | **(9.2)** | 4,548.1 |
## Non-GAAP Ratios
*Finding and Development Costs*
ARC calculates F&D costs as capital expenditures divided by the change in reserves within the applicable reserves category. ARC calculates F&D costs, including FDC, as the sum of capital expenditures and the change in FDC required to bring the reserves on production, divided by the change in reserves within the applicable reserves category. Capital expenditures, a non-GAAP financial measure, is used as a component of F&D costs. Management uses F&D costs as a measure of capital efficiency for organic reserves development.
*Finding, Development and Acquisition Costs*
ARC calculates FD&A costs as the sum of capital expenditures and adjusted net capital acquisitions divided by the change in reserves within the applicable reserves category, inclusive of changes due to acquisitions and dispositions. ARC calculates FD&A costs, including FDC, as the sum of capital expenditures, adjusted net capital acquisitions, and the change in FDC required to bring the reserves on production, divided by the change in reserves within the applicable reserves category, inclusive of changes due to acquisitions and dispositions. Capital expenditures and adjusted net capital acquisitions, both non-GAAP financial measures, are used as components of FD&A costs. Management uses FD&A costs as a measure of capital efficiency for organic and acquired reserves development.
## *Recycle Ratio*
ARC calculates recycle ratio by dividing the netback per boe by F&D or FD&A costs. Netback per boe is a non-GAAP ratio that uses netback, a non-GAAP financial measure, as a component. Capital expenditures, a non-GAAP financial measure, is used as a component of F&D costs. Capital expenditures and adjusted net capital acquisitions, both non-GAAP financial measures, are used as components of FD&A costs. Management uses recycle ratio to relate the cost of adding reserves to the expected cash flows to be generated.
## Supplementary Financial Measures
*Before-tax Proved plus Probable Net Present Value per Share*
Before-tax 2P NPV per share is comprised of the before-tax NPV for 2P reserves, discounted at 10 per cent, as determined in accordance with NI 51-101, divided by diluted weighted average common shares.
**2022 INDEPENDENT QUALIFIED RESERVES EVALUATION**
GLJ conducted a Reserves Evaluation, effective December 31, 2022, which was prepared in accordance with definitions, standards, and procedures in the COGE Handbook and NI 51-101. The Reserves Evaluation was based on GLJ forecast pricing and foreign exchange rates at January 1, 2023, as outlined in the table below. These forecasts reflect current market conditions as defined by current forward commodity prices as at December 31, 2022. This aligns with the COGE Handbook, effective April 1, 2021, which states that major benchmark commodity price forecasts, up to and including the second full forecast year, should not deviate from current forward commodity prices by more than 20 per cent.
Reserves included herein are stated on a company gross basis (working interest before deduction of royalties without the inclusion of any royalty interest) unless otherwise noted. ARC’s crude oil and natural gas reserves statement for the year ended December 31, 2022, including complete disclosure of the Company’s crude oil and natural gas reserves and other crude oil and natural gas information in accordance with NI 51-101, will be disclosed in ARC’s Annual Information Form for the year ended December 31, 2022.
| **GLJ Price Forecast**(1) | **WTICrude Oil**(US$/bbl) | **EdmontonLight Oil**(Cdn$/bbl) | **NYMEX Henry Hub Natural Gas**(US$/MMBtu) | **AECONatural Gas**(Cdn$/MMBtu) | **Foreign Exchange**(US$/Cdn$) |
|---|---|---|---|---|---|
| **2023** | 2022 | **2023** | 2022 | **2023** | 2022 | **2023** | 2022 | **2023** | 2022 |
| 2023 | **75.00** | 69.01 | **97.96** | 81.89 | **4.71** | 3.50 | **4.36** | 3.10 | **0.735** | 0.790 |
| 2024 | **75.00** | 67.24 | **95.30** | 79.32 | **4.50** | 3.15 | **4.77** | 3.15 | **0.745** | 0.790 |
| 2025 | **75.43** | 68.58 | **94.50** | 80.91 | **4.27** | 3.21 | **4.47** | 3.21 | **0.755** | 0.790 |
| 2026 | **76.94** | 69.96 | **95.14** | 82.53 | **4.35** | 3.28 | **4.49** | 3.28 | **0.765** | 0.790 |
| 2027 | **78.48** | 71.35 | **95.79** | 84.18 | **4.44** | 3.34 | **4.53** | 3.34 | **0.775** | 0.790 |
| 2028 | **80.05** | 72.78 | **97.70** | 85.86 | **4.53** | 3.41 | **4.62** | 3.41 | **0.775** | 0.790 |
| 2029 | **81.65** | 74.24 | **99.66** | 87.58 | **4.62** | 3.48 | **4.71** | 3.48 | **0.775** | 0.790 |
| 2030 | **83.28** | 75.72 | **101.65** | 89.32 | **4.71** | 3.55 | **4.80** | 3.55 | **0.775** | 0.790 |
| 2031 | **84.95** | 77.24 | **103.68** | 91.11 | **4.80** | 3.62 | **4.89** | 3.62 | **0.775** | 0.790 |
| 2032(2) | **86.65** | | **104.31** | | **4.90** | | **4.99** | | **0.775** | 0.790 |
| Escalate thereafter at | **+2.0%per year** | +2.0%per year | **+2.0%per year** | +2.0%per year | **+2.0%per year** | +2.0%per year | **+2.0%per year** | +2.0%per year | **0.775** | 0.790 |
| (1) | GLJ assigns a value to ARC’s existing physical diversification contracts for natural gas to consuming markets across North America based upon GLJ’s forecast differential to NYMEX Henry Hub, contracted volumes, and transportation expense. No incremental value was assigned to potential future contracts that were not in place on December 31, 2022. |
|---|---|
| (2) | Escalated at two per cent per year starting in 2033 in the January 1, 2023 GLJ price forecast with the exception of foreign exchange, which remains flat. |
Definitions of Oil and Gas Reserves
**Reserves** are estimated remaining quantities of crude oil and natural gas and related substances anticipated to be recoverable from known accumulations, as of a given date, based on the analysis of drilling, geological, geophysical, and engineering data; the use of established technology; and specified economic conditions, which are generally accepted as being reasonable. Reserves are classified according to the degree of certainty associated with the estimates as follows:
**Proved Reserves** are those reserves that can be estimated with a high degree of certainty to be recoverable. It is likely that the actual remaining quantities recovered will exceed the estimated proved reserves.
**Probable Reserves** are those additional reserves that are less certain to be recovered than proved reserves. It is equally likely that the actual remaining quantities recovered will be greater or less than the sum of the estimated proved plus probable reserves.
Information Regarding Disclosure on Crude Oil and Natural Gas Reserves and Operational Information
In accordance with Canadian practice, production volumes and revenues are reported on a company gross basis, before deduction of Crown and other royalties, and without including any royalty interests, unless otherwise stated. Unless otherwise specified, all reserves volumes in this news release (and all information derived therefrom) are based on company gross reserves using forecast prices and costs.
This news release contains metrics commonly used in the crude oil and natural gas industry. These metrics do not have standardized meanings and may not be comparable to similar metrics disclosed by other issuers. See *“Non-GAAP and Other Financial Measures”* of this news release and the definition of reserve replacement below. Management uses these metrics for its own performance measurements and to provide shareholders with measures to compare ARC’s performance over time; however, such measures are not reliable indicators of ARC’s future performance and future performance may not compare to the performance in previous periods.
- **Reserves replacement** is calculated by dividing the annual reserves additions, in boe, by ARC’s annual production, in boe. Management uses this measure to determine the relative change of its reserves base over a period of time.
This news release discloses drilling inventory in two categories: (i) proved plus probable locations; and (ii) unbooked locations. Proved plus probable locations are derived from the Reserves Evaluation conducted by GLJ and account for drilling locations that have associated proved plus probable reserves. Unbooked locations referenced in this news release were prepared internally by management of ARC based on the Company’s prospective acreage and an assumption as to the number of wells that can be drilled per section based on industry standard practice and internal review including evaluation of applicable geologic, seismic, engineering, production and reserves information. These unbooked locations do not have attributed reserves or resources and are therefore unbooked locations. Of the 5,200 total drilling locations identified herein, 888 are proved plus probable and 4,312 are unbooked locations. There is no certainty that ARC will drill all such unbooked locations and if drilled, there is no certainty that such locations will result in additional oil and gas reserves or production. The drilling locations which ARC will actually drill wells, including the number and timing thereof is ultimately dependent upon the availability of funding, regulatory approvals, seasonal restrictions, oil and natural gas prices, costs, actual drilling results and additional reservoir information that is obtained and other factors.
**FORWARD-LOOKING INFORMATION AND STATEMENTS**
This news release contains certain forward-looking statements and forward-looking information (collectively referred to as “forward-looking information”) within the meaning of applicable securities legislation about current expectations regarding the future based on certain assumptions made by ARC. Although ARC believes that the expectations represented by such forward-looking information are reasonable, there can be no assurance that such expectations will prove to be correct. Forward-looking information in this news release is identified by words such as “anticipate”, “believe”, “ongoing”, “may”, “expect”, “estimate”, “plan”, “will”, “project”, “continue”, “target”, “strategy”, “upholding”, or similar expressions, and includes suggestions of future outcomes. In particular, but without limiting the foregoing, this news release contains forward-looking information with respect to: ARC’s 2023 guidance, including planned capital expenditures (and the commodity prices at which such capital expenditures are fully funded by funds from operations), production guidance, production estimates and expenses; the anticipated decrease in capital expenditure and production forecast for 2024 and the anticipated timing thereof; the expectation that transportation costs will decrease over the balance of the year on a per unit basis; statements with respect to the 2023 capital budget including the planned investment and allocation of the 2023 capital budget; the long-term natural gas supply agreement with Cheniere and the anticipated timing and benefits thereof; the anticipated investments in sanctioning Attachie West Phase I, should the regulatory environment in BC support such investment; the ability of the Attachie asset to drive production and reserve growth; the expectation that ARC’s operating expense per boe will decrease due to higher production volumes; the anticipated operation expenses per boe in 2023; the anticipated reduction in corporate operating expense as a result of the water infrastructure investment at Kakwa and the anticipated timing thereof; plans to allocate surplus funds from operations to returns to shareholders; the anticipated increase in free funds flow allocations to shareholders; the continued assessment of dividends and payment thereof; ARC’s plans with respect to growing its dividend and increasing the dividend on a per share basis as shares are retired through the NCIB or other means; ARC’s investment to continue electrification of the Dawson facilities and the expected benefits therefrom; ARC’s target net debt to funds from operations ratio at mid-cycle commodity prices; ARC’s 2023 guidance estimates; and other statements. Further, statements relating to reserves are deemed to be forward-looking information, as they involve the implied assessment, based on certain estimates and assumptions, that the resources and reserves described can be profitably produced in the future. In addition, forward-looking information may include statements attributable to third-party industry sources. There can be no assurance that the plans, intentions, or expectations upon which these forward-looking statements are based will occur.
Readers are cautioned not to place undue reliance on forward-looking information as ARC’s actual results may differ materially from those expressed or implied. ARC undertakes no obligation to update or revise any forward-looking information except as required by law. Developing forward-looking information involves reliance on a number of assumptions and consideration of certain risks and uncertainties, some of which are specific to ARC and others that apply to the industry generally. The material assumptions on which the forward-looking information in this news release are based, and the material risks and uncertainties underlying such forward-looking information, include: ARC’s ability to successfully integrate and realize the anticipated benefits of completed or future acquisitions and divestitures; access to sufficient capital to pursue any development plans; ARC’s ability to issue securities and to repurchase its securities under the NCIB; ARC’s ability to meet and maintain certain targets, including with respect to emissions-related reductions and ESG performance; expectations and projections made in light of ARC’s historical experience; data contained in key modeling statistics; the potential implementation of new technologies and the cost thereof; forecast commodity prices and other pricing assumptions with respect to ARC’s 2023 capital expenditure budget; continuing uncertainty of the impact of the June 29, 2021 BC Supreme Court ruling in *Blueberry River First Nations (Yahey) v. Province of British Columbia* on BC and/or federal laws or policies affecting resource development in northeast BC and potential outcomes of the negotiations between Blueberry River First Nations and the Government of BC; assumptions with respect to global economic conditions and the accuracy of ARC’s market outlook expectations for 2023, 2024 and in the future; suspension of or changes to guidance, and the associated impact to production; the assumption that the regulatory environment will be able to support ARC’s investment in the execution of Attachie West Phase I, including that regulatory authorities in BC will resume granting approvals for oil and gas activities relating to drilling, completions, testing, processing facilities, and production and transportation infrastructure in 2023 on time frames, and terms and conditions, consistent with past practice; forecast production volumes based on business and market conditions; the accuracy of outlooks and projections contained herein; that future business, regulatory, and industry conditions will be within the parameters expected by ARC, including with respect to prices, margins, demand, supply, product availability, supplier agreements, availability, and cost of labour and interest, exchange, and effective tax rates; projected capital investment levels, the flexibility of capital spending plans, and associated sources of funding; the ability of ARC to complete capital programs and the flexibility of ARC’s capital structure; applicable royalty regimes, including expected royalty rates; future improvements in availability of product transportation capacity; opportunity for ARC to pay dividends and the approval and declaration of such dividends by the Board; the existence of alternative uses for ARC’s cash resources which may be superior to payment of dividends or effecting repurchases of outstanding common shares; cash flows, cash balances on hand, and access to ARC’s credit facility being sufficient to fund capital investments; foreign exchange rates; near-term pricing and continued volatility of the market; the ability of ARC’s existing pipeline commitments and financial risk management transactions to partially mitigate a portion of ARC’s risks against wider price differentials; business interruption, property and casualty losses, or unexpected technical difficulties; estimates of quantities of crude oil, natural gas, and liquids from properties and other sources not currently classified as proved; accounting estimates and judgments; future use and development of technology and associated expected future results; ARC’s ability to obtain necessary regulatory approvals generally; potential regulatory and industry changes stemming from the results of court actions affecting regions in which ARC holds assets; risks and uncertainties related to oil and gas interests and operations on Indigenous lands; the successful and timely implementation of capital projects or stages thereof; the ability to generate sufficient cash flow to meet current and future obligations; estimated abandonment and reclamation costs, including associated levies and regulations applicable thereto; ARC’s ability to obtain and retain qualified staff and equipment in a timely and cost-efficient manner; ARC’s ability to carry out transactions on the desired terms and within the expected timelines; forecast inflation and other assumptions inherent in the guidance of ARC; the retention of key assets; the continuance of existing tax, royalty, and regulatory regimes; GLJ Ltd.’s estimates with respect to commodity pricing; ARC’s ability to access and implement all technology necessary to efficiently and effectively operate its assets; and other assumptions, risks, and uncertainties described from time to time in the filings made by ARC with securities regulatory authorities.
The forward-looking information contained herein are expressly qualified in their entirety by this cautionary statement. The forward-looking information included in this news release are made as of the date of this news release and, except as required by applicable securities laws, ARC undertakes no obligation to publicly update such forward-looking information to reflect new information, subsequent events or otherwise.
## About ARC
ARC Resources Ltd. is a pure-play Montney producer and one of Canada’s largest dividend-paying energy companies, featuring low-cost operations and leading ESG performance. ARC’s investment-grade credit profile is supported by commodity and geographic diversity and robust risk management practices around all aspects of the business. ARC’s common shares trade on the Toronto Stock Exchange under the symbol ARX.
**Categories:** Finance
---
### [Aragon Research Recognizes Cresta as an “Innovator” in the Globe for Conversational AI in the Intelligent Contact Center](https://df.media/aragon-research-recognizes-cresta-as-an-innovator-in-the-globe-for-conversational-ai-in-the-intelligent-contact-center/)
**Published:** July 26, 2023
**Author:** Daily Finance
**Content:**
*he Evaluation Based on Cresta’s Strategy and Performance*
PALO ALTO, Calif., Jan. 17, 2023 /PRNewswire/ — Cresta, the leader in real-time intelligence for the contact center, has been listed by Aragon Research, Inc in the “Innovator” section of the Aragon Research Globe for Conversational AI in the Intelligent Contact Center Report. The report recognizes the leading providers using conversational AI technology to improve customer and employee experience.
[](https://web.archive.org/web/20230202081245/https://mma.prnewswire.com/media/1819287/cresta_logo_black_copy_Logo.html)
“Our inclusion as an Innovator in this report further cements Cresta’s position as a leader in AI for the contact center industry and demonstrates the transformative effect that contact center technology can have on business,” said Scott Kolman, Cresta CMO. “The use of AI in contact centers is helping organizations enhance the customer experience through more effective engagement. Cresta’s conversational AI is empowering businesses to forge deeper, more positive relationships with their customers while at the same time managing operational costs.”
The Cresta Real-Time Intelligence platform features four conversational AI product offerings for the intelligent contact center:
- Cresta Agent Assist enables agents to be significantly more effective through automated note taking, real-time AI-suggested responses, hints, and checklists.
- Cresta Director helps managers to better support and coach agents by providing insight into agent conversations, creating coaching plans, and developing scorecards.
- Cresta Insights empowers organizations to better understand customer trends, answer critical business questions, and uncover new unknowns to make faster, smarter decisions.
- Cresta Virtual Agent, which is modeled on the behavior of top agents, identifies conversation types best suited for automation and leverages state-of-the-art Natural Language Understanding to automate customer conversations.
“Cresta and the other noteworthy companies included in the report are leveraging conversational AI technology to positively and dramatically change the way contact centers operate,” said Jim Lundy, CEO and Founder of Aragon Research, Inc. “From Agent Assist to Director to Insights, Cresta is reshaping customer and employee experiences.”
## Required Disclaimer:
Aragon Research does not endorse vendors, or their products or services that are referenced in its research publications, and does not advise users to select those vendors that are rated the highest. Aragon Research publications consist of the opinions of Aragon Research and Advisory Services organization and should not be construed as statements of fact. Aragon Research provides its research publications and the information contained in them “AS IS,” without warranty of any kind.
**About Cresta**
Cresta makes every customer interaction excellent. Cresta turns real-time intelligence into real-time action to make the contact center smarter – and every agent and manager more productive. Powering customer experiences for companies like CarMax, Blue Nile, Earthlink, Intuit, and Porsche, Cresta is real-time AI for the real world. To learn more about Cresta.
**Categories:** Science
---
### [Applications Open for Fisher Service Award for Military Community Service](https://df.media/applications-open-for-fisher-service-award-for-military-community-service/)
**Published:** July 26, 2023
**Author:** Daily Finance
**Content:**
***Fisher House Foundation and Military Times Foundation will provide $250,000 in awards to nonprofits***
ROCKVILLE, Md., Jan. 23, 2023 /PRNewswire/ — Applications are open today through March 23, 2023, for the Fisher Service Award that recognizes and supports other nonprofits serving the military and veteran communities. Fisher House Foundation and Military Times Foundation will award $250,000 to innovative programs enhancing the quality of life for service members, veterans, and their families.
")[](https://web.archive.org/web/20230128000120/https://mma.prnewswire.com/media/1675486/Fisher_House_Logo.html)
The Fisher Service Award replaced the long-running Newman’s Own Award Program which, together, have distributed more than $2.75 million to 200 nonprofit programs over the last 23 years.
As part of the award package, recipients of the Fisher Service Award will each receive an advertising package valued at $34,000 from Military Times.
Recipients of the Newman’s Own Award have included many key players in the military nonprofit community such as Blue Star Families, Inc; Hope for the Warriors; Injured Marine Semper Fi Fund; the Tragedy and Assistance Program for Survivors; and many more. Fisher House Foundation anticipates that future recipients of the Fisher Service Award will continue this great tradition of recognizing excellence in service to our greatest national treasure, our service members, veterans, and their loved ones.
Award recipients will be chosen by a diverse and esteemed judging panel comprised of individuals who combine their knowledge to recognize programs that meet the dynamic needs of military and veteran communities. Moreover, the spouses of senior military leaders have traditionally helped judge submissions since the early 2000s, starting with Mrs. Mary Jo Myers and Mrs. Lynne Pace and most recently Mrs. Kelly Hokanson and Mrs. Mollie Raymond.
Applications for the 2023 Fisher Service Award open January 23 and close March 23.
**About Fisher House Foundation**
Fisher House Foundation is best known for its network of 94 comfort homes where military and veteran families can stay at no cost while a loved one is receiving treatment. These homes are located at major military and VA medical centers nationwide, and in Europe, close to the medical center or hospital they serve. Fisher Houses have up to 21 suites, with private bedrooms and baths. Families share a common kitchen, laundry facilities, a warm dining room, and an inviting living room. Fisher House Foundation ensures that there is never a lodging fee. Since inception, the program has saved military and veteran families an estimated $547 million in out-of-pocket costs for lodging and transportation.
**About Military Times Foundation**
Military Times Foundation is a nonprofit corporation organized and operated exclusively for charitable purposes to recognize, salute and highlight the exemplary service of active duty personnel serving in each branch of the U.S. Armed Services and support other organizations conducting activities with similar goals. Military Times Foundation has a flagship program entitled Service Members of the Year, which recognizes and awards outstanding service members and veterans each year.
**Categories:** Global News
---
### [APPH DEADLINE ALERT: ROSEN, GLOBAL INVESTOR COUNSEL, Encourages AppHarvest, Inc. Investors with Losses to Secure Counsel Before Important Tuesday Deadline in Securities Class Action – APPH](https://df.media/apph-deadline-alert-rosen-global-investor-counsel-encourages-appharvest-inc-investors-with-losses-to-secure-counsel-before-important-tuesday-deadline-in-securities-class-action-apph/)
**Published:** July 26, 2023
**Author:** Daily Finance
**Content:**
NEW YORK, Nov. 20, 2021 /PRNewswire/ —
[](https://web.archive.org/web/20221126164634/https://mma.prnewswire.com/media/405060/Rosen_Law_Logo.html)
**WHY:** Rosen Law Firm, a global investor rights law firm, reminds purchasers of the securities of AppHarvest, Inc. (NASDAQ: APPH) between May 17, 2021 and August 10, 2021, inclusive (the “Class Period”), of the important **November 23, 2021** **lead plaintiff deadline**.
**SO WHAT:** If you purchased AppHarvest securities during the Class Period you may be entitled to compensation without payment of any out of pocket fees or costs through a contingency fee arrangement.
**WHAT TO DO NEXT:** To join the AppHarvest class action, call Phillip Kim, Esq. toll-free at 866-767-3653 for information on the class action. A class action lawsuit has already been filed. If you wish to serve as lead plaintiff, you must move the Court **no later than November 23, 2021**. A lead plaintiff is a representative party acting on behalf of other class members in directing the litigation.
**WHY ROSEN LAW:** We encourage investors to select qualified counsel with a track record of success in leadership roles. Often, firms issuing notices do not have comparable experience, resources, or any meaningful peer recognition. Many of these firms do not actually litigate securities class actions. Be wise in selecting counsel. The Rosen Law Firm represents investors throughout the globe, concentrating its practice in securities class actions and shareholder derivative litigation. Rosen Law Firm has achieved the largest ever securities class action settlement against a Chinese Company. Rosen Law Firm was Ranked No. 1 by ISS Securities Class Action Services for number of securities class action settlements in 2017. The firm has been ranked in the top 4 each year since 2013 and has recovered hundreds of millions of dollars for investors. In 2019 alone the firm secured over $438 million for investors. In 2020, founding partner Laurence Rosen was named by law360 as a Titan of Plaintiffs’ Bar. Many of the firm’s attorneys have been recognized by Lawdragon and Super Lawyers.
**DETAILS OF THE CASE:** According to the lawsuit, defendants throughout the Class Period made false and/or misleading statements and/or failed to disclose that: (1) AppHarvest lacked sufficient training for its recently expanded labor force; (2) as a result, AppHarvest could not produce Grade No. 1 tomatoes consistently; (3) as a result, the Company’s financial results would be adversely impacted; and (4) as a result of the foregoing, defendants’ positive statements about AppHarvest’s business, operations, and prospects were materially misleading and/or lacked a reasonable basis. When the true details entered the market, the lawsuit claims that investors suffered damages.
No Class Has Been Certified. Until a class is certified, you are not represented by counsel unless you retain one. You may select counsel of your choice. You may also remain an absent class member and do nothing at this point. An investor’s ability to share in any potential future recovery is not dependent upon serving as lead plaintiff.
**Categories:** Consulting
---
### [AONN+ Foundation For Learning Certification Receives Nation’s Highest Nursing Recognition](https://df.media/aonn-foundation-for-learning-certification-receives-nations-highest-nursing-recognition/)
**Published:** July 26, 2023
**Author:** Daily Finance
**Content:**
CRANBURY, N.J., Nov. 14, 2021 /PRNewswire-PRWeb/ — The AONN+ Foundation for Learning (AONN+ FFL) announced that its oncology navigator certifications have received the prestigious Magnet Recognition by the American Nurses Credentialing Center (ANCC).
The ANCC’s Magnet Recognition Program distinguishes organizations that meet rigorous standards and is considered the highest recognition for nursing excellence. U.S. News & World Report’s annual showcase of “America’s Best Hospitals” includes Magnet recognition in its ranking criteria for the quality of inpatient care.
Oncology Nurse Navigator-Certified Generalist (ONN-CG) and Oncology Patient Navigator-Certified Generalist (OPN-CG), the 2 AONN+ FFL certifications, were created in response to increasing demands for a specific type of certification that distinguishes the knowledge, skills, and role of oncology navigators from that of other types of nursing certifications.
The purpose of these 2 certifications is to ensure that clinical nurse and patient navigators have the knowledge to competently demonstrate effective navigation services across the cancer care continuum within their scope of practice.
The ONN-CG and OPN-CG certifications are accredited through ANSI National Accreditation Board (ANAB), a wholly owned subsidiary of the American National Standards Institute (ANSI).
American Nurses Credentialing Center (ANCC) is a subsidiary of the American Nurses Association. ANCC accredits healthcare organizations that provide and approve continuing nursing education and accredits transition to practice programs and prepares nurses for new practice roles.
## About AONN+ Foundation for Learning, Inc.
AONN+ Foundation for Learning, Inc. (AONN+ FFL) is a specialty organization created in 2010 through affiliation with The Academy of Oncology Nurse & Patient Navigators, Inc. (AONN+). AONN+ FFL is a separate legal entity that oversees the ONN-CG and OPN-CG certification exams and manages all activities related to ANAB accreditation and oncology navigator certification.
About the Academy of Oncology Nurse & Patient Navigators, Inc.
The Academy of Oncology Nurse & Patient Navigators, Inc. (AONN+), is the largest national specialty organization dedicated to improving patient care and quality of life by defining, enhancing, and promoting the role of oncology nurse and patient navigators. The organization, which has more than 8900 members, was founded in 2009 to provide a network for all professionals involved and interested in patient navigation and survivorship care services in order to better manage the complexities of the cancer treatment process.
## About The Lynx Group
The Lynx Group (TLG) is a premier medical communications and education company acutely focused on oncology and rare disease states. TLG specializes in market access to and with advanced practice providers, patients, and their caregivers. With more than 100 years of combined senior leadership experience, TLG continually creates award-winning medical education and cultivates strong relationships within proprietary brands serving patients and their caregivers, physicians, payers, nurses, pharmacists, navigators, and practice managers.
TLG has broad and deep experience in crafting custom, award-winning solutions for life science and biotech companies. Currently, TLG partners with more than 50 of the top pharma and biotech companies globally. TLG proudly serves as co-founder and association management company of the Academy of Oncology Nurse & Patient Navigators (AONN+) and the Association for Value-Based Cancer Care (AVBCC).
**Categories:** Global News
---
### [Announcing Martal Group’s New Government Partnership](https://df.media/announcing-martal-groups-new-government-partnership/)
**Published:** July 26, 2023
**Author:** Daily Finance
**Content:**
**Colombian tech companies expedite expansion into the North American market through a new pilot program supported by Martal Group and the Government of Medellín, Colombia.**
TORONTO, Feb. 8, 2022 /PRNewswire/ – Martal Group today announced it had signed a contract with Ruta N Medellín to fulfill an internationalization initiative to increase exports in the tech sector through March 30, 2022. This strategic partnership with help Medellin-based tech companies expand into the North American market and overcome common challenges Colombian businesses face when developing overseas opportunity funnels.
The Colombian contract marks the third project entrusted to Martal Group by a government entity focused on gaining market share in the United States and Canada for B2B tech companies while maintaining jobs in the origin country.
Founder and CEO of Martal Group, Vito Vishnepolsky stated, ***“Martal Group has proven to be a great alternative for government entities supporting local tech companies outside the US. We help government incubators and accelerators ramp up their clients’ businesses in North America while keeping the jobs local. Martal’s sales as a service solution equip companies with a North American sales team without the need to invest in office space abroad or relocation expenses.”***
The majority of information and communication technology (ICT) services in Colombia are purchased domestically, making it difficult to participate in global value chains (GVCs), according to the OECD. Opening opportunities in GVCs for Colombian tech companies can significantly impact its emerging economy in the form of increased productivity, innovation, and competitiveness.
Through this pilot program initiated by Ruta N — a joint venture with the city of Medellin — Martal Group is providing outbound B2B lead generation services at no cost to the Colombian tech companies. During the three-month project, participating tech companies will be paired with an outsourced sales team who will build and execute a personalized go-to-market strategy that will nurture opportunities for potential foreign partnerships.
By the end of the pilot, each Colombian tech company will have a holistic understanding of its outbound sales process, position in the North American market, and optimal conversion opportunities.
**About Martal Group:** For over a decade, Martal Group has specialized in B2B lead generation for tech companies worldwide. Through a proprietary process and a team of expert sales executives, Martal develops and executes go-to-market strategies for businesses ready to expand or scale in North America.
**About Ruta[ N](https://web.archive.org/web/20221126150927/https://c212.net/c/link/?t=0&l=en&o=3438056-1&h=3169760193&u=https%3A%2F%2Fwww.rutanmedellin.org%2Fes%2F&a=%C2%A0N):** As a joint venture between the city of Medellin, the mission of the innovation center is to improve the quality of life for Colombian citizens by strengthening entrepreneurial endeavors in scientific and technological innovation. Ruta N has a variety of projects to encourage global collaboration and provide STi solutions for Medellin businesses.
**Categories:** Capital Markets
---
### [Amendment to December 2021 Annual Non-Cash Reinvested Distributions](https://df.media/amendment-to-december-2021-annual-non-cash-reinvested-distributions/)
**Published:** July 26, 2023
**Author:** Daily Finance
**Content:**
TORONTO, Feb. 4, 2022 /CNW/ – Horizons ETFs Management (Canada) Inc. (“**Horizons ETFs**“) is announcing the following amendment to the year-end annual non-cash reinvested distribution amounts per unit (the “**Non-Cash** **Distributions**“) disclosed for the exchange traded funds (the “**ETFs**“) in the press release dated December 31, 2021.
The Non-Cash Distribution rates are amended for the following ETF:
| **ETF Name** | **TickerSymbol** | **AmendedNon-CashDistributionRate per Unit** | **Original****Non-CashDistributionRate per Unit** |
|---|---|---|---|
| Horizons Active Global Dividend ETF (“**HAZ**“) | HAZ | $0.22017 | $nil |
The ex-dividend date for the Non-Cash Distributions was December 31, 2021, for all unitholders of record on December 31, 2021 (the “**Unitholders**“). The Non-Cash Distributions were reinvested automatically in additional units of the ETFs and immediately consolidated so that the number of units held by each Unitholder, the units outstanding of the ETFs, and the net asset value of the ETFs, did not change as a result of the Non-Cash Distributions.
No distribution of cash is being made to Unitholders of HAZ, this amended distribution will be recorded as a reinvested distribution into the creation of new units of HAZ as at December 31, 2021. Due to the fact that this distribution is effective for the 2021 tax year, the Unitholders of HAZ will be required to recognize this distribution in the 2021 calendar year for tax-reporting purposes.
**About Horizons ETFs Management (Canada) Inc.**
Horizons ETFs Management (Canada) Inc. is an innovative financial services company and offers one of the largest suites of exchange traded funds in Canada. The Horizons ETFs product suite includes a broadly diversified range of solutions for investors of all experience levels to meet their investment objectives in a variety of market conditions. Horizons ETFs currently has more than $21 billion of assets under management and 104 ETFs listed on major Canadian stock exchanges. Horizons ETFs Management (Canada) Inc. is a member of the Mirae Asset Global Investments Group.
*Commissions, management fees and expenses all may be associated with an investment in exchange traded products managed by Horizons ETFs Management (Canada) Inc. (the “Horizons Exchange Traded Products”). The Horizons Exchange Traded Products are not guaranteed, their values change frequently and past performance may not be repeated. **Please read the relevant prospectus before investing.***
**Categories:** Finance, Global News
---
### [Alpine 4 Holdings (ALPP) Reports Q3 2021 Revenue Grew by 23% Over Q2 2021 and a Net Profit of $2.48 Million For the Quarter](https://df.media/alpine-4-holdings-alpp-reports-q3-2021-revenue-grew-by-23-over-q2-2021-and-a-net-profit-of-2-48-million-for-the-quarter/)
**Published:** July 25, 2023
**Author:** Daily Finance
**Content:**
PHOENIX, Nov. 4, 2021 /PRNewswire/ — Alpine 4 Holdings, Inc. (Nasdaq: ALPP), a leading operator and owner of small market businesses, is pleased to announce that its Q3 2021 revenue grew by 23% over Q2 2021 revenue and that it posted a net profit of $2.48 million for the 3rd Quarter 2021. The company’s Assets also grew by $3.08 million for the quarter as well.
Kent Wilson, CEO / President, shared the following letter regarding the company’s Q3 results.
*“Dear Shareholders,*
*This will be my first 10Q commentary while listed on the Nasdaq, and I can say that it is a great honor that you are here with us. As we begin our next chapter in the story of Alpine 4, the Company will begin to report and break out each of its operating companies into its silos; A4 Manufacturing, Inc., A4 Construction Services, Inc., A4 Technologies, Inc., A4 Defense Services, Inc., and A4 Aerospace, Inc. We are doing this to enhance the visibility of our operating segments as a whole and also to allow institutional investors greater insight to how our holdings perform in the ebbs and flows of our economy.*
*It is important to note that the Company is making great strides in recovering from the effects of COVID-19 in our market spaces. However, employee participation in our revenue was an issue in Q3 as our operating subsidiaries Morris Sheet Metal and Alternative Laboratories had an outbreak of the novel coronavirus in August and September that reduced our ability to produce products for our growing customer base.*
*Q3 Highlights:*
***Revenue:*** *The Company’s overall revenue grew from $14.13 million in Q2 2021 to $17.39 million in Q3 2021, which represents $3.26 million in additional revenue for the quarter or growth of 23%, and the Company also grew at 99% over Q3 2020 revenue of $8.72 million. The Company as a whole is still experiencing supply chain issues in our construction services, manufacturing, and aerospace holdings. Alternative Laboratories, experienced significant delays of critical manufacturing nutrients during the quarter. These delayed deliveries and inhibited labor force, due to COVID-19, resulted in roughly $1.2 million in postponed revenue which would have driven Q3 revenue to over $18.59 million. The Company expects supply chain issues to continue into Q1 and Q2 2022.*
***Gross Profit:*** *Q3 gross profit continues its Q2 improvement over Q1 2021 and all of 2020. This rise stems from more robust gross profit performance at our A4 Manufacturing companies, Quality Circuit Assembly and Alternative Laboratories. Conversely, the A4 Construction Services portfolio of companies, Morris Sheet Metal and Excel Fabrication, continue to have suppressed gross profit due to escalating prices in steel in the first three quarters of the year. As these prices stabilize, we expect the gross profit margin in this holding group to improve, thus pushing our combined gross profit further upward. Q3 2021 gross profit was slightly down by percentage compared to Q2 2021, but it was still at 25.57%, a 66.65% improvement over Q3 2020. The importance of gross profit in our business model is that as we cross over our breakeven point at the combined level, the Company’s gross profit percentage will then fall to the bottom line. I say this to make the point that as we grow our gross profit percentage, we also will begin to push much larger dollar margins to the bottom line.*
***Net Profit:*** *Q3 2021 represented a huge leap forward in our net profitability. The Company netted out $2.48 million in profit for the quarter. The four more significant contributors to this gain in Q3 2021 were; G&A expenses dropped by $814 thousand, interest expense dropped by $678 thousand, other income grew by $408 thousand, and the debt forgiveness of our PPP loans of $4.30 million all added to this success.*
***Balance Sheet:*** *Our balance sheet continues to be a bright spot in our success as a company. Our total asset base swelled by $3.08 million in Q3 2021. The Company continues to use its cash to provide our subsidiaries with the best competitive position it can. For example, our Inventory levels grew by $1.8 million in Q3 2021 vs. Q2 2021. As many competitors struggle to bring materials in to make their products, Alpine 4 is empowering our subsidiaries to purchase in bulk where we can with the goal to make our vendors choose us as a priority customer vs. our competitors. This tactic is starting to bear fruit in a highly competitive market for resources. The Company has allowed its subsidiaries to offer more favorable terms to its customers to win new business, which represents our accounts receivable balance growing. Our liabilities only increased by $239 thousand, allowing us to still see a $2.84 million increase in the Company’s stockholders’ equity.*
*In closing, the Company is looking forward to 2022 and all it will bring. I know that I have said this before, but we are just only getting started, and our future as a company looks bright!*
*Kent Wilson*
*CEO / President / Founder”*
About Alpine 4 Holdings: Alpine 4 Holdings, Inc. (ALPP) is a NASDAQ traded conglomerate that acquires businesses that fit into its disruptive DSF business model of Drivers, Stabilizers, and Facilitators. At Alpine 4, we understand the nature of how technology and innovation can accentuate a business. Our focus is on how the adaptation of new technologies, even in brick-and-mortar businesses, can drive innovation. We also believe that our holdings should benefit synergistically from each other, have the ability to collaborate across varying industries, spawn new ideas, and create fertile ground for competitive advantages.
Four principles at the core of our business are Synergy. Innovation. Drive. Excellence. At Alpine 4, we believe synergistic innovation drives excellence. By anchoring these words to our combined experience and capabilities, we can aggressively pursue opportunities within and across vertical markets. We deliver solutions that not only drive industry standards, but also increase value for our shareholders.
## CAUTION CONCERNING FORWARD-LOOKING STATEMENTS:
The CEO letter and commentary above contain “forward-looking statements,” that is, statements related to future events that by their nature address matters that are, to different degrees, uncertain. Except for statements of historical fact, the information contained herein that constitutes forward-looking statements includes, but is not limited to, the (i) projected financial performance of the Company; (ii) the expected development of the Company’s business, projects, and joint ventures; (iii) execution of the Company’s vision and growth strategy, including with respect to future M&A activity and global growth; (iv) sources and availability of third-party financing for the Company’s projects; (v) completion of the Company’s projects that are currently underway, in development or otherwise under consideration; (vi) renewal of the Company’s current customer, supplier and other material agreements; and (vii) future liquidity, working capital, and capital requirements. This document also includes certain forward-looking projected financial information that is based on current estimates and forecasts. Actual results could differ materially. For additional information on the uncertainties that may cause our actual future results to be materially different from those expressed in the forward-looking statements, please review the Company’s annual reports on Form 10-K, quarterly reports on Form 10-Q, and other filings with the Securities and Exchange Commission that discuss the risks facing the Company. We expressly disclaim any intention or obligation to update any our forward-looking statements.
**Categories:** Finance
---
### [ALERT: Rowley Law PLLC is Investigating Proposed Acquisition of Volta Inc.](https://df.media/alert-rowley-law-pllc-is-investigating-proposed-acquisition-of-volta-inc/)
**Published:** July 25, 2023
**Author:** Daily Finance
**Content:**
NEW YORK, Jan. 18, 2023 /PRNewswire/ — Rowley Law PLLC is investigating potential securities law violations by Volta Inc. (NYSE: VLTA) and its board of directors concerning the proposed acquisition of the company by Shell (NYSE: SHEL). Stockholders will receive $0.86 for each share of Volta stock that they hold. The transaction is valued at approximately $169 million and is expected to close in the first half of 2023.
If you are a stockholder of Volta Inc. and are interested in obtaining additional information regarding this investigation. You may also contact Shane Rowley, Esq. at Rowley Law PLLC, 50 Main Street Suite 1000, White Plains, NY 10606, by telephone at 914-400-1920 or 844-400-4643 (toll-free).
Rowley Law PLLC represents shareholders nationwide in class actions and derivative lawsuits in complex corporate litigation.
**Categories:** Global News
---
### [AEP COMPLETES SALE OF RACINE HYDRO PLANT](https://df.media/aep-completes-sale-of-racine-hydro-plant/)
**Published:** July 25, 2023
**Author:** Daily Finance
**Content:**
COLUMBUS, Ohio, Dec. 30, 2021 /PRNewswire/ — American Electric Power (Nasdaq: AEP) today completed the sale of Racine Plant, a 48-megawatt (MW) hydroelectric facility in Racine, Ohio, from AEP Generation Resources, the company’s competitive generation affiliate, to Eagle Creek Renewable Energy.
AEP announced Feb. 9, 2021, that it had reached an agreement to sell the plant. The Federal Energy Regulatory Commission approved the transfer on Dec. 17. Due to the competitive nature of the transaction, the sale price will not be disclosed.
The sale of Racine Hydro furthers AEP’s ongoing focus on its regulated business operations, infrastructure and energy innovations. With the completion of this transaction, AEP Generation Resources’ only remaining competitive facility is Cardinal Plant’s 595-MW Unit 1, which is scheduled for retirement in 2028.
American Electric Power, based in Columbus, Ohio, is powering a cleaner, brighter energy future for its customers and communities. AEP’s approximately 16,700 employees operate and maintain the nation’s largest electricity transmission system and more than 224,000 miles of distribution lines to safely deliver reliable and affordable power to 5.5 million regulated customers in 11 states. AEP also is one of the nation’s largest electricity producers with approximately 31,000 megawatts of diverse generating capacity, including more than 5,900 megawatts of renewable energy. The company’s plans include growing its renewable generation portfolio to approximately 50% of total capacity by 2030. AEP is on track to reach an 80% reduction in carbon dioxide emissions from 2000 levels by 2030 and has committed to achieving net zero by 2050. AEP is recognized consistently for its focus on sustainability, community engagement, and diversity, equity and inclusion. AEP’s family of companies includes utilities AEP Ohio, AEP Texas, Appalachian Power (in Virginia and West Virginia), AEP Appalachian Power (in Tennessee), Indiana Michigan Power, Kentucky Power, Public Service Company of Oklahoma, and Southwestern Electric Power Company (in Arkansas, Louisiana, east Texas and the Texas Panhandle). AEP also owns AEP Energy, which provides innovative competitive energy solutions nationwide. For more information, visit aep.com.
[](https://web.archive.org/web/20221128205448/https://mma.prnewswire.com/media/476288/American_Electric_Power_Logo.html)
**Categories:** Global News
---
### [ALERT: Rowley Law PLLC is Investigating Proposed Acquisition of Citrix Systems, Inc](https://df.media/alert-rowley-law-pllc-is-investigating-proposed-acquisition-of-citrix-systems-inc/)
**Published:** July 25, 2023
**Author:** Daily Finance
**Content:**
NEW YORK, Jan. 31, 2022 /PRNewswire/ — Rowley Law PLLC is investigating potential securities law violations by Citrix Systems, Inc. (NASDAQ: CTXS) and its board of directors concerning the proposed acquisition of the company by Elliott Management Corp. and Vista Equity Partners. Stockholders will receive $104.00 for each share of Citrix Systems stock that they hold. The transaction is valued at approximately $16.5 billion and is expected to close in the middle of 2022.
If you are a stockholder of Citrix Systems, Inc. and are interested in obtaining additional information regarding this investigation. You may also contact Shane Rowley, Esq. at Rowley Law PLLC, 50 Main Street Suite 1000, White Plains, NY 10606, by telephone at 914-400-1920 or 844-400-4643 (toll-free).
**Categories:** Consulting, Global News
---
### [AHCO DEADLINE ALERT: ROSEN, TOP RANKED INVESTOR COUNSEL, Encourages AdaptHealth Corp. f/k/a DFB Healthcare Acquisitions Corp. Investors with Losses to Secure Counsel Before Important September 27 Deadline in Securities Class Action – AHCO, AHCOW](https://df.media/ahco-deadline-alert-rosen-top-ranked-investor-counsel-encourages-adapthealth-corp-f-k-a-dfb-healthcare-acquisitions-corp-investors-with-losses-to-secure-counsel-before-important-september-27-dead/)
**Published:** July 25, 2023
**Author:** Daily Finance
**Content:**
NEW YORK, Sept. 22, 2021 /PRNewswire/ —
[](https://web.archive.org/web/20211019112252/https://mma.prnewswire.com/media/405060/Rosen_Law_Logo.html)
**WHY:** Rosen Law Firm, a global investor rights law firm, reminds purchasers of the securities of AdaptHealth Corp. f/k/a DFB Healthcare Acquisitions Corp. (NASDAQ: AHCO, AHCOW) between November 11, 2019 and July 16, 2021, inclusive (the “Class Period”) of the important **September 27, 2021 lead plaintiff deadline**.
**SO WHAT:** If you purchased AdaptHealth securities during the Class Period you may be entitled to compensation without payment of any out of pocket fees or costs through a contingency fee arrangement.
**WHAT TO DO NEXT:** To join the AdaptHealth class action, call Phillip Kim, Esq. toll-free at 866-767-3653 for information on the class action. A class action lawsuit has already been filed. If you wish to serve as lead plaintiff, you must move the Court **no later than September 27, 2021**. A lead plaintiff is a representative party acting on behalf of other class members in directing the litigation.
**WHY ROSEN LAW:** We encourage investors to select qualified counsel with a track record of success in leadership roles. Often, firms issuing notices do not have comparable experience, resources or any meaningful peer recognition. Be wise in selecting counsel. The Rosen Law Firm represents investors throughout the globe, concentrating its practice in securities class actions and shareholder derivative litigation. Rosen Law Firm has achieved the largest ever securities class action settlement against a Chinese Company. Rosen Law Firm was Ranked No. 1 by ISS Securities Class Action Services for number of securities class action settlements in 2017. The firm has been ranked in the top 4 each year since 2013 and has recovered hundreds of millions of dollars for investors. In 2019 alone the firm secured over $438 million for investors. In 2020, founding partner Laurence Rosen was named by law360 as a Titan of Plaintiffs’ Bar. Many of the firm’s attorneys have been recognized by Lawdragon and Super Lawyers.
**DETAILS OF THE CASE:** According to the lawsuit, defendants throughout the Class Period made false and/or misleading statements and/or failed to disclose that: (1) AdaptHealth had misrepresented its organic growth trajectory by retroactively inflating past organic growth numbers without disclosing the changes, in violation of SEC regulations; (2) accordingly, AdaptHealth had materially overstated its financial prospects; and (3) as a result, defendants’ public statements were materially false and misleading at all relevant times. When the true details entered the market, the lawsuit claims that investors suffered damages.
No Class Has Been Certified. Until a class is certified, you are not represented by counsel unless you retain one. You may select counsel of your choice. You may also remain an absent class member and do nothing at this point. An investor’s ability to share in any potential future recovery is not dependent upon serving as lead plaintiff.
**Categories:** Consulting, Global News
---
### [ADVENTUS MINING AND SALAZAR RESOURCES ENTER INTO JOINT VENTURE TO DEVELOP THE CURIPAMBA COPPER-GOLD PROJECT](https://df.media/adventus-mining-and-salazar-resources-enter-into-joint-venture-to-develop-the-curipamba-copper-gold-project/)
**Published:** July 25, 2023
**Author:** Daily Finance
**Content:**
**Categories:** Finance, Global News
---
### [Addendum from Artmarket.com concerning the cryptocurrency Artprice Coin in the NFT market](https://df.media/addendum-from-artmarket-com-concerning-the-cryptocurrency-artprice-coin-in-the-nft-market/)
**Published:** July 25, 2023
**Author:** Daily Finance
**Content:**
PARIS, Dec. 12, 2021 /PRNewswire/ — Following Artmarket.com’s press release of 7 December 2021.
Artmarket.com has received requests for further details from shareholders, investors, observers and the cryptocurrency community concerning, notably, the following paragraph in that press release:
‘*The DNS artpricecoin.com, filed in December 2017 (along with all the corresponding names) illustrates Artprice by Artmarket’s early awareness of this paradigm shift to NFTs and cryptocurrencies*‘.
Artmarket.com wishes to point out that, to date, there is not yet a specific cryptocurrency for the group, but that its work groups, after intense reflection, projected different scenarios where French and/or European legislators and/or American legislators would start building workable legislative frameworks for a crypto-culture which already has a relatively long history and is currently practised by more than a billion people around the world.
The development and implementation of these frameworks (i.e. the legal adjustment to an existing reality) is a process seen repeatedly throughout history, particularly in the fields of economics and science during the 20th century.
Artmarket.com’s global strategy has long included the creation of a specific cryptocurrency for the art market, as demonstrated by the filing date of the DNS artpricecoin.com (.net .org, etc. and its corresponding names).
Artprice has been studying the historical and economic realities of the art market for many years, both at its core and on its periphery, and it wishes to remind today’s emerging cryptocurrency community of the real starting point of crypto culture: the mythical crypto anarchist Manifesto by Timothy C. May at the CypherPunk Meeting in 1992.
Groupe Serveur, an Internet pioneer in Europe since 1987 and Artprice by Artmarket’s reference shareholder, has always been sensitive to the CypherPunk community, itself a regular user of PGP (Pretty Good Privacy) since 1991.
For thierry Ehrmann, founder of the Server Group: ‘Computer scientist Philip Zimmermann is a visionary who very quickly understood the imperative need to protect personal data.’
Groupe Serveur’s culture is deeply rooted in cryptology and is very close to the Electronic Frontier Foundation. Simon Singh’s book *The Code Book* (1999) as a perfect illustration of the history of cryptology as experienced by Groupe Serveur.
With favourable legislation in Europe and/or USA, the issuance of this cryptocurrency by its American subsidiary Artprice Inc. (SoundView Press since 1992) will pursue one primary objective: to restore artists to the central place they should be occupying within the art market.
For thierry Ehrmann: *‘In historical terms, the nearest thing to the impact of NFTs on the art world was the paradigm shift we now call the ‘Renaissance’. Not since then – when Johannes Gutenberg’s printing press allowed artists to print editions of their work –* *has there been such a massive transfer of power into the hands of artists.*
*The Renaissance allowed artists to generate incomes and to control their production independently in their workshops and factories. Today with cryptocurrencies being essential to the exponentially growing NFT market, we are experiencing a similar paradigm shift.’*
thierry Ehrmann, CEO of Artmarket.com and founder of Artprice, is a sculptor and visual artist, registered for over 36 years with copyright companies, and creator of the famous Abode of Chaos, a vast CyberPunk and dystopian metaverse of 6,300 works on a 9,000m² site in Lyon France.
Acutely aware of the conditions and responsibilities facing artists today, thierry Ehrmann has been communicating daily with other creators in various artistic disciplines and organising lively debates with artist-in-residence at the Abode of Chaos for three decades.
Artmarket.com wants to liberate artists from the cogs of an unforgiving system that slows their emergence. Formerly dependent on orders from ecclesiastical hierarchies, then from royal families and aristocrats, artists today are very often confronted with insurmountable economic obstacles preventing them from making themselves known and from being fairly compensated for their work.
An authorized creation of the Artprice Coin cryptocurrency by Artmarket.com will ultimately make it possible to restore the balance between artists and other players in the art market – a balance that is often weighted against the artist – via a more equitable distribution of wealth between the parties.
Artists will then be able to watch their income and notoriety grow without damaging their reputations or their relationships with the art market’s key players.
In 2022, entire communities, whether street, land or performance artists – often economically isolated from the art market due to the particular nature of their works – will finally have the opportunity to trade directly with their audiences using exchanges of Artprice Coin by Artmarket.com.
**About Artmarket:**
**Artmarket.com** is listed on Eurolist by Euronext Paris, SRD long only and Euroclear: 7478 – Bloomberg: PRC – Reuters: ARTF.
Artmarket and its Artprice department was founded in 1997 by its CEO, thierry Ehrmann. Artmarket and its Artprice department is controlled by Groupe Serveur, created in 1987.
Artmarket is a global player in the Art Market with, among other structures, its Artprice department, world leader in the accumulation, management and exploitation of historical and current art market information in databanks containing over 30 million indices and auction results, covering more than 770,000 artists.
Artprice by Artmarket, the world leader in information on the art market, has set itself the ambition through its Global Standardized Marketplace to be the world’s leading Fine Art NFT platform.
Artprice Images® allows unlimited access to the largest Art Market image bank in the world: no less than 180 million digital images of photographs or engraved reproductions of artworks from 1700 to the present day, commented by our art historians.
Artmarket with its Artprice department accumulates data on a permanent basis from 6300 Auction Houses and produces key Art Market information for the main press and media agencies (7,200 publications). Its 5.4 million (‘members log in’+social media) users have access to ads posted by other members, a network that today represents the leading Global Standardized Marketplace® to buy and sell artworks at a fixed or bid price (auctions regulated by paragraphs 2 and 3 of Article L 321.3 of France’s Commercial Code).
Artmarket with its Artprice department, has been awarded the State label “Innovative Company” by the Public Investment Bank (BPI) (for the second time in November 2018 for a new period of 3 years) which is supporting the company in its project to consolidate its position as a global player in the market art.
**Categories:** Global News
---
### [ACTIVISION BLIZZARD 24 HOUR DEADLINE ALERT: Former Louisiana Attorney General and Kahn Swick & Foti, LLC Remind Investors with Losses in Excess of $100,000 of Deadline in Class Action Lawsuit Against Activision Blizzard, Inc. – ATVI](https://df.media/activision-blizzard-24-hour-deadline-alert-former-louisiana-attorney-general-and-kahn-swick-foti-llc-remind-investors-with-losses-in-excess-of-100000-of-deadline-in-class-action-lawsuit-agai/)
**Published:** July 25, 2023
**Author:** Daily Finance
**Content:**
NEW ORLEANS, Oct. 3, 2021 /PRNewswire/ — Kahn Swick & Foti, LLC (“KSF”) and KSF partner, the former Attorney General of Louisiana, Charles C. Foti, Jr., remind investors that they have only until **October 4, 2021** to file lead plaintiff applications in a securities class action lawsuit against Activision Blizzard, Inc. (NasdaqGS: ATVI), if they purchased the Company’s securities between August 4, 2016 and July 27, 2021, inclusive (the “Class Period”). This action is pending in the United States District Court for the Central District of California.
[](https://web.archive.org/web/20221128215539/https://mma.prnewswire.com/media/1460233/New_logo_pr_sec_Logo.html)
## What You May Do
If you purchased securities of Activision Blizzard and would like to discuss your legal rights and how this case might affect you and your right to recover for your economic loss, you may, without obligation or cost to you, contact KSF Managing Partner Lewis Kahn toll-free at 1-877-515-1850. If you wish to serve as a lead plaintiff in this class action by overseeing lead counsel with the goal of obtaining a fair and just resolution, you must request this position by application to the Court by **October 4, 2021**.
## About the Lawsuit
On July 20, 2021, the California Department of Fair Employment and Housing filed a lawsuit against the Company alleging violations of the state’s Equal Pay Act as well as the Fair Employment and Housing Act based on disturbing incidents of sexual harassment and assault. On July 27, 2021, Bloomberg reported that thousands of current and former employees of the Company had signed a petition in protest of the Company’s “abhorrent and insulting” response to the lawsuit and had planned walkout and work stoppage the following day, resulting in the Company’s CEO sending a letter to employees apologizing for the Company’s “tone deaf” response to the DFEH lawsuit and promising “swift action to be \[. . .\] compassionate\[,\] caring \[and\] to ensure a safe environment.”
On this news, shares of Activision fell $5.89, or over 6%, to close at $84.05 on July 27, 2021, on unusually heavy trading volume.
The case is *Cheng v. Activision Blizzard, Inc., et al.,* No. 1:21-cv-06240.
## About Kahn Swick & Foti, LLC
KSF, whose partners include former Louisiana Attorney General Charles C. Foti, Jr., is one of the nation’s premier boutique securities litigation law firms. KSF serves a variety of clients – including public institutional investors, hedge funds, money managers and retail investors – in seeking recoveries for investment losses emanating from corporate fraud or malfeasance by publicly traded companies. KSF has offices in New York, California and Louisiana.
**Categories:** Global News
---
### [Acteev Donates 70,000 Face Masks to Schools in Need](https://df.media/acteev-donates-70000-face-masks-to-schools-in-need/)
**Published:** July 25, 2023
**Author:** Daily Finance
**Content:**
HOUSTON, March 10, 2022 /PRNewswire/ — Acteev is coming together with the National School Boards Association’s (NSBA) Center for Safe Schools to help safeguard public schools against COVID-19. While school mask mandates have been lifted in many states, the Centers for Disease Control and Prevention (CDC) continues to recommend universal indoor masking by students, staff members, faculty, and visitors in kindergarten through grade 12 where COVID-19 cases are high or hospitals are at risk of reaching capacity.
[](https://web.archive.org/web/20221128225308/https://mma.prnewswire.com/media/1764477/acteev_nsba_mask_donation.html)
Despite federal funding, schools across the nation continue to struggle to keep quality personal protective equipment (PPE) for teachers and school personnel on-hand, especially in lower income, Title I Schools. Acteev and the NSBA’s Center for Safe Schools want to help.
“As public schools navigate the demands of staying open safely, they frequently carry the burden of added costs for personal protective equipment, increased cleanings and more. Providing access to quality, reusable masks is one area we can make a difference,” said Phil McDivitt, CEO of Ascend Performance Materials, the company that produces Acteev.
Made in the USA, reusable Acteev Protect Masks are made for long, continuous wear utilizing odor- and mildew- resistant zinc technology.
**About Acteev by Ascend Performance Materials** Ascend Performance Materials makes high-performance materials for everyday essentials and new technologies. Our focus is on improving quality of life and inspiring a better tomorrow through innovation. Based in Houston, Texas, and with regional offices in Shanghai, Brussels and Detroit, we are a fully integrated material solutions provider with eight global manufacturing facilities in the United States, Europe and China. Our 2,600-person global workforce makes materials that support safer vehicles, cleaner energy, better medical devices, smarter appliances and longer-lasting apparel and consumer goods. We are committed to safety, sustainability and the success of our customers and our communities.
**About the National School Boards Association’s Center for Safe Schools**
The Center for Safe Schools is an initiative of the National School Boards Association to support and ensure a safe and secure environment for students, staff and the community. Founded in 1940, NSBA is a federation of state associations and the U.S. territory of the Virgin Islands. Through its member state associations that represent locally elected school board officials serving approximately 51 million public school students, NSBA advocates for equity and excellence in public education through school board leadership. We believe that public education is a civil right necessary to the dignity and freedom of the American people and that each child, regardless of their disability, ethnicity, socio-economic status or citizenship, deserves equitable access to an education that maximizes their individual potential.
**Categories:** Global News
---
### [A VARIETY OF VEHICLES MAKE GLOBAL, NATIONAL AND AUTO SHOW DEBUTS IN THE WINDY CITY](https://df.media/a-variety-of-vehicles-make-global-national-and-auto-show-debuts-in-the-windy-city/)
**Published:** July 25, 2023
**Author:** Daily Finance
**Content:**
CHICAGO, Feb. 11, 2022 /PRNewswire/ — Automotive manufacturers, exhibitors and enthusiasts from all over the world are revving up for the 2022 Chicago Auto Show, running Feb. 12-21 at McCormick Place. The show is open each day from 10 a.m. to 10 p.m., except for the final day of the show (Presidents Day) when it closes at 8 p.m.
Attendees will also be among the first to see a variety of vehicles that made their global, national or auto show debut this week in Chicago, including:
- 2023 BMW ixM60
- 2022 BMW xDrive50
- 2022 BMW i4 M50
- 2023 Chevrolet Blazer
- 2024 Chevrolet Silverado EV
- 2023 Chevrolet Corvette Z06
- Ford 1978 F-100 Eluminator EV Concept
- 2022 Ford Bronco Raptor
- 2022 Ford Bronco Everglades
- Ford GT Alan Mann Heritage Edition
- 2022 GMC Hummer EV
- 2022 Hyundai IONIQ 5
- 2022 Hyundai Tucson PHEV
- 2022 Jeep Grand Cherokee 4xe
- 2022 Jeep Grand Cherokee L Limited Black Package
- 2022 Kia EV6
- 2024 Kia EV9 Concept
- 2023 Kia Sportage PHEV
- Lexus IS 500 SEMA Build
- 2022 Lexus LX 600
- 2022 Lexus NX
- Lincoln Aviator Shinola Concept
- 2023 Nissan Ariya
- Nissan Frontier Trio of Concepts – Nissan Frontier Project 72X, Frontier Project Hardbody and Frontier Project Adventure
- Nissan Rebelle Rally Frontier
- 2023 Nissan Z
- Ram 1500 “Built to Serve” Edition
- 2023 Subaru Solterra
- 2023 Subaru WRX
- 2023 Toyota bZ4X
- 2023 Toyota Sequoia and Sequoia Capstone
- Toyota Tacozilla Tacoma Camper
- 2022 Toyota Tundra Capstone
Tickets to the 2022 Chicago Auto Show are currently on sale at [ChicagoAutoShow.com](https://web.archive.org/web/20221130205931/https://c212.net/c/link/?t=0&l=en&o=3441861-1&h=2523199480&u=https%3A%2F%2Fwww.chicagoautoshow.com%2F&a=ChicagoAutoShow.com). Media information is available at [ChicagoAutoShow.com/media](https://web.archive.org/web/20221130205931/https://c212.net/c/link/?t=0&l=en&o=3441861-1&h=2774775093&u=https%3A%2F%2Fwww.chicagoautoshow.com%2Fmedia%2F&a=ChicagoAutoShow.com%2Fmedia).
**About the Chicago Auto Show** First staged in 1901, the Chicago Auto Show is the nation’s longest running auto exposition in North America. The show is produced by the Chicagoland’s new-car dealer association, the Chicago Automobile Trade Association, which has staged the show since 1935.
**Categories:** Global News
---
### [A support event for the Ukrainian people was held today at the media center of the Friends of Zion Museum in Jerusalem](https://df.media/a-support-event-for-the-ukrainian-people-was-held-today-at-the-media-center-of-the-friends-of-zion-museum-in-jerusalem/)
**Published:** July 25, 2023
**Author:** Daily Finance
**Content:**
**Among the participations were emigrants from Ukraine, the Kosovan and Slovakian Ambassadors to Israel, the Chief Rabbi of Ukraine, Benjamin Netanyahu and Nir Barkat.**
JERUSALEM, Oct. 27, 2022 /PRNewswire/ — Tonight, Thursday, October 27, 2022, an event in support of the Ukrainian people was held at the Friends of Zion Media Center in Jerusalem.
[](https://web.archive.org/web/20221027213009/https://mma.prnewswire.com/media/1931916/Friends_of_Zion.html)
The event was attended by dozens of emigrants from Ukraine who made Aliya to Israel in recent months, the Chief Rabbi of Ukraine, Rabbi Moshe Reuven Azman; the Kosovan and Slovakian Ambassadors to Israel; Former Mayor of Jerusalem, Nir Barkat; and former Prime Minister of Israel, Benjamin Netanyahu.
Nir Barkat thanked Dr. Mike Evans and Michael Evans II, founder and president (respectively) of the Friends of Zion Heritage Center, for their work on behalf of the citizens of Ukraine. “Since the outbreak of the war in February 2022, both Dr. Evans and Michael have been going to and from Ukraine, providing over 1400 tons of food, medicine, generators, and supplies for refugees in the war zones,” Barkat said. “I believe that the State of Israel should stand by Ukraine along with the Western world, the USA and European countries.”
Michael Evans II said, “When I see firsthand on the front lines the unspeakable pain that Ukrainian homeless refugees are experiencing, I know that what we are doing at Friends of Zion, as friends of the State of Israel, is so very important.”
Dr. Mike Evans is the Founder of the Friends of Zion Heritage Center in Jerusalem, a number one best-selling author, and a Nobel Peace Prize nominee for a lifetime of combating antisemitism. He and his son Michael have been working in Ukraine for more than a decade, feeding hundreds of Holocaust survivors and Jewish orphans. In the last year, Evans has been assisting in bringing Ukrainian children and Holocaust survivors to Israel.
In Jerusalem, Evans built a community center for Ukrainian Holocaust survivors, and beautiful apartments for them at the Friends of Zion Heritage Center campus. In addition, Evans and his son feed several thousand Holocaust survivors each week in Israel, along with organizing parties and events for them, including Bar and Bat Mitzvah ceremonies at the Kotel for Survivors who never had the chance to celebrate theirs. Evans also sponsored this year’s Miss Holocaust Survivor beauty pageant, at the Friends of Zion campus.
**Categories:** Global News
---
### [A Second Message From Titan International, Inc.’s Chairman](https://df.media/a-second-message-from-titan-international-inc-s-chairman/)
**Published:** July 25, 2023
**Author:** Daily Finance
**Content:**
WEST CHICAGO, Ill., Dec. 21, 2021 /PRNewswire/ — Titan International, Inc. (NYSE: TWI) (“Titan” or “TWI”) today released the following statement.
Morry Taylor, Chairman of the Board, commented, “A few days ago, I released a message on TWI, the market, and our stock. Since that time, multiple sources have reported that Yokohama has offered to buy Trelleborg’s off-highway wheel business for $2 billion. I believe Trelleborg’s wheel business for 2021 will be somewhere around $1.4 billion in sales. Yokohama may face challenges with antitrust laws because of the amount of business their operation in India ships into Europe. Looking at TWI within our Ag business, we are the market leader in steel wheels across all the major markets. Within the Ag tire business, the combined Titan and Goodyear share is number one in South America, North America and Russia. In Europe, we have a long-term plan to be a major player there as well. One thing many people overlook is this — over the past number of years the majority of new Ag wheel and tire designs have come from Titan. I believe that within fifteen years, the largest selling Ag tire will be Titan’sLSW® tire/wheel combination.
“In 2022, Titan anticipates global sales above $2 billion based on our annual plan approved by the Titan Board. Think about that, Yokohama is proposing to buy a business for $2 billion dollars with 2021 sales well below that of Titan’s. Considering the Yokohama/Trelleborg bid, that’s a $2 billion price for a business that could be number one in Europe, but nowhere else. The world’s largest Ag markets are in the U.S. and Brazil and Titan is the leader in those markets. Also, TWI has the manufacturing capacity to expand without building additional facilities. If you apply the same math to the $2 billion price offered for Trelleborg, and reduce it by our net debt, that would suggest a Titan share price above $24.
“It has taken 30 years for the politicians and some of the leaders of the largest companies in the U.S. to realize that chasing low wage countries for manufacturing is going to blow up. Plus, the situation with China has become a big problem across a number of areas. Now customers need to have supply chains for wheels and tires that can support their factories in the countries where they produce or sell their product. I have heard some customers want at least half of their wheels and tires produced in the U.S. There is no other domestic producer who has that kind of capacity beyond Titan.
“I expect that there will be some further positive updates regarding TWI after the first of the year. From myself and all of us at Titan, we hope everyone has a very Merry Christmas and a Happy New Year. Sorry if I offend anyone, but I am too old to be Woke! Cheers!”
**Safe Harbor Statement**: This press release contains forward-looking statements. These forward-looking statements are covered by the safe harbor for “forward-looking statements” provided by the Private Securities Litigation Reform Act of 1995. The words “believe,” “expect,” “anticipate,” “plan,” “would,” “could,” “potential,” “may,” “will,” and other similar expressions are intended to identify forward-looking statements, which are generally not historical in nature. These forward-looking statements are based on our current expectations and beliefs concerning future developments and their potential effect on us. Although we believe the assumptions upon which these forward-looking statements are based are reasonable, these assumptions are subject to significant risks and uncertainties, and are subject to change based on various factors, some of which are beyond Titan International, Inc.’s control. As a result, any of these assumptions could prove to be inaccurate and the forward-looking statements based on these assumptions could be incorrect. The matters discussed in these forward-looking statements are subject to risks, uncertainties, and other factors that could cause actual results and trends to differ materially from those made, projected, or implied in or by the forward-looking statements depending on a variety of uncertainties or other factors including, but not limited to, the effect of the COVID-19 pandemic on our operations and financial performance; the effect of a recession on the Company and its customers and suppliers; changes in the Company’s end-user markets into which the Company sells its products as a result of domestic and world economic or regulatory influences or otherwise; changes in the marketplace, including new products and pricing changes by the Company’s competitors; unfavorable outcomes of legal proceedings; the Company’s ability to comply with current or future regulations applicable to the Company’s business and the industry in which it competes or any actions taken or orders issued by regulatory authorities; availability and price of raw materials; levels of operating efficiencies; the effects of the Company’s indebtedness and its compliance with the terms thereof; changes in the interest rate environment and their effects on the Company’s outstanding indebtedness; unfavorable product liability and warranty claims; actions of domestic and foreign governments, including the imposition of additional tariffs; geopolitical and economic uncertainties relating to the countries in which the Company operates or does business; risks associated with acquisitions, including difficulty in integrating operations and personnel, disruption of ongoing business, and increased expenses; results of investments; the effects of potential processes to explore various strategic transactions, including potential dispositions; fluctuations in currency translations; risks associated with environmental laws and regulations; risks relating to our manufacturing facilities, including that any of our material facilities may become inoperable; risks relating to financial reporting, internal controls, tax accounting, and information systems; and the other risks and factors detailed in the Company’s periodic reports filed with the Securities and Exchange Commission, including the disclosures under “Risk Factors” in those reports. These forward-looking statements are made only as of the date hereof. The Company cautions that any forward-looking statements included in this press release are subject to a number of risks and uncertainties, and the Company undertakes no obligation to publicly update or revise any forward-looking statements, whether as a result of new information, changed circumstances or future events, or for any other reason, except as required by law.
**About Titan**: Titan International, Inc. (NYSE: TWI) is a leading global manufacturer of off-highway wheels, tires, assemblies, and undercarriage products. Headquartered in West Chicago, Illinois, the company globally produces a broad range of products to meet the specifications of original equipment manufacturers (OEMs) and aftermarket customers in the agricultural, earthmoving/construction, and consumer markets.
**Categories:** Global News
---
### [75th Annual Bronner Bros. Int’l Beauty Show Postponed Due to Recent COVID-19 Spikes in New Orleans](https://df.media/75th-annual-bronner-bros-intl-beauty-show-postponed-due-to-recent-covid-19-spikes-in-new-orleans/)
**Published:** July 25, 2023
**Author:** Daily Finance
**Content:**
ATLANTA and NEW ORLEANS, Aug. 28, 2021 /PRNewswire/ — Due to documented reports of exponential spikes in new COVID-19 cases across Louisiana, including the spread of the highly infectious Delta Variant, the 2021 Bronner Bros. Int’l Beauty Show, scheduled to take place in New Orleans (NOLA) August 28-30, 2021, has been postponed. The new date is to be determined and will be announced on the Bronner Bros. website soon. The decision was made to postpone due to the gravity of this ongoing public health emergency, particularly its negative impact on professionals in the beauty and barber industry.
The Bronner Bros team outlined initial plans in partnership with NOLA convention officials, including necessary precautions to host a safe show. However, given the current circumstances, Show management has decided to place the health and safety of all Show attendees first. Since there is no guarantee that everyone entering the venue will be fully vaccinated, free of the virus, or willing to take a COVID-19 test on site, the most effective way to keep everyone safe is to wait until the pandemic has ended or at least subsided to a better, new normal.
As recently announced New Orleans Mayor Latoya Cantrell, the city has issued a mandate that ALL visitors to hotels, restaurants and bars are required to either show proof of being fully vaccinated or proof of a negative COVID-19 test. Rapid tests are not accepted and PCR tests must be within 72 hours, which would not cover the full length of their time in New Orleans for our event.
“This was a very hard decision, as we were excited about celebrating Bronner Bros. 75th Anniversary and welcoming the world’s most diverse group of beauty professionals to New Orleans,” said James Bronner, Senior Vice President and Show Director. “At this difficult time, I can only think of my father, Nathaniel H. Bronner, and how relevant his wise words are today: ‘Health is Wealth.’ Without our ability to ensure your SAFE participation in all three days, unfortunately the Show cannot go on. Our industry has lost a number of greats to this terrible disease. Our hearts go out to everyone negatively impacted by this pandemic.”
The **REFUND PROCESS FOR SHOW ATTENDEES AND EXHIBITORS BEGAN WEDNESDAY, AUGUST 18th.** Attendees who purchased online automatically received a refund.
Bronner added, “We encourage everyone to do their part to keep our communities safe – mask up, practice social distancing and get vaccinated. Looking ahead, we are excited about celebrating with the entire beauty community— in a safe environment— at a later date.”
**About Bronner Bros., Inc.**
Headquartered in Atlanta, Bronner Bros., Inc. (BB) is a family-owned and operated company founded in 1947 by Dr. Nathaniel H. Bronner, Sr. and his brother Arthur E. Bronner, Sr. Today, the BB Enterprise consists of multicultural beauty products, UPSCALE Magazine, and professional trade shows, which attract more than 60,000 beauty professionals annually.
**Categories:** Global News
---
### [A Beginner’s Guide to Diversifying Your Stock Portfolio](https://df.media/a-beginners-guide-to-diversifying-your-stock-portfolio/)
**Published:** July 25, 2023
**Author:** Daily Finance
**Content:**
As an investor, holding just one stock in your portfolio is never ideal. If the company goes bankrupt or has a catastrophic event, you could lose your entire stake.
Instead, it’s important to make a few wise investments to protect your portfolio and give it a chance to generate returns over time. According to a new survey, over 50% of Americans are now invested in the stock market.
If you are looking to invest your money and become part of the majority of Americans earning interest on their money, keep reading this guide and learn how you can build a diversified stock portfolio.
## 1. Start With What You Know
When it comes time for you to diversify your portfolio, you should start with what you know already.
You may know some of the most popular stocks without ever even looking at a financial app or news station. That’s because many of the companies all around us are public and available to invest in.
For example, if you have an iPhone and love the other Apple devices, you may want to consider investing in Apple’s stock. Or, if you do all your shopping on Amazon, you can consider that for your next investment.
Famed investor, Warren Buffet, is a long-time believer in [buying companies](https://web.archive.org/web/20230209015804/https://www.cnbc.com/2018/09/18/warren-buffett-and-jack-bogle-recommend-buying-and-holding.html) that you can see yourself owning for at least ten years.
## 2. Select Different Types of Investments
Now that you invested in the stocks you already know, it’s time to branch out and start discovering other smart investments that can generate a financial gain.
This step is going to take some research. It’s essential to note that not all businesses are valued the same. Different industries can generate significantly different shareholder values.
You will want to diversify your investments and review your other options. A few popular investment categories include:
- Commodities (Gold, Silver, Platinum)
- Real Estate (REITs)
- Technology (Apple, Google, Facebook)
- Entertainment (Disney, Netflix, Comcast)
- Financial (Visa, PayPal, Mastercard)
- Banks (J.P Morgan, Bank of America)
- Healthcare (Johnson & Johnson, Pfizer, and Amgen)
- Energy (Chevron, ExxonMobile)
- Alternative energy (First Solar, Enphase, Sunrun)
As you can see, there are so many different types of investment to invest in to diversify your portfolio.
## 3. Evaluate Your Results
After making your first few investments, you will need to evaluate their performance and decide if they are still the right companies to have your money invested in.
If an investment is performing poorly, try to research and determine the cause. If something has changed, you will need to reevaluate your conviction on the asset.
## Get the Most Out of Your Stock Portfolio
Diversifying your stock portfolio is one of the best ways to go about growing your wealth. Start by investing in companies you already know about and branch out and find other smart investment opportunities.
The most critical part of maintaining your portfolio is staying up to date with the latest information on your invested assets. To keep up with the latest happenings in the financial world, head over to our website!
**Categories:** Finance
---
### [1.5 million SMEs facing £47billion bill but many have left cash unused throughout pandemic](https://df.media/1-5-million-smes-facing-47billion-bill-but-many-have-left-cash-unused-throughout-pandemic/)
**Published:** July 25, 2023
**Author:** Daily Finance
**Content:**
The UK’s SME sector is among the most important to the overall health of the economy with 99.9% of private sector firms falling within the category. Testament to this is the growth that many firms have seen over the course of the last 14 months as ambition trumped adversity. This optimism is matched in general sentiment throughout the sector, with 78% of SMEs in the UK, US and France expecting to be profitable by 2022 as restrictions ease.
This month, however, over 1.5million small businesses across the UK will begin to make their first repayments towards bounce-back loans taken out since the advent of lockdown restrictions. But will these firms fare when it comes to repaying their loans? There is considerable optimism here too, at the end of 2020, senior executives at Britain’s top banks estimated that nearly half of the cash loaned was sitting unused in the bank accounts of their recipients.
With rising optimism around reopening and economists predicting a booming 2021 ahead, small firms may be in a better position than thought to repay these debts alongside growth and recovery. In fact, a recent survey revealed that just 1% of SMEs do not ever expect to pay back the loans and over a fifth expect to pay it back in full in the next 12 months.
**Luke Davis, CEO of IW Capital** – an SME specialist investment house – has commented:
> *“Small businesses have been among the most resilient sections of society throughout the pandemic, whether that be pivoting business models or simply rallying round to survive one of the toughesteconomic times in recent history. As a result, many are now in a position to grow and thrive post-lockdown in a way that few expected this time last year.*
>
> *“The bounce-back loans are an example of government help that made a big difference to a lot firms but in many cases they were taken out more for insurance than dire need. So it is no surprise to see that so many have remained untouched, which bodes well for their repayment over the next few years, especially as general economic growth takes hold.*
>
> *“Multiple businesses in our portfolio have grown considerably and are now ready to get back to normal, from hospitality to sustainable industry. It is indicative of a section of the economy that thrives on creativity and ambition even during tough times and one that investors, in my experience, are looking to support.”*
**Categories:** Finance
---
## Pages
### [Editorial Policy](https://df.media/editorial-policy/)
**Published:** August 6, 2026
**Author:** Vishnu Priya
**Content:**
Daily Finance (df.media) is published by Fair Media Group. This page explains how we produce our markets and finance coverage, including our use of AI-assisted drafting, and how we handle errors when they happen.
## Who We Are
Daily Finance covers global markets, central bank policy, crypto, and macroeconomic news. The site is owned and operated by Fair Media Group, which also publishes BestStartup US and Welp Magazine. More on our team and mission is available on our [About Us](https://df.media/about-us/) page.
## How We Report Markets News
Our market recaps and breaking coverage draw on public statements, official data releases (CPI, Fed and central bank decisions, SEC filings), wire reporting, and pricing data from established financial data providers. Figures such as index levels, commodity prices, and yields are point-in-time snapshots tied to the article’s publish date and can move quickly after publication.
## Use of AI in Our Content
A significant portion of Daily Finance’s day-to-day markets coverage is drafted with the assistance of AI tools, given the volume and pace of financial news. We hold this content to the same factual standard as any other article. We have identified and removed AI-generated content in the past that did not meet that standard — including an article that conflated a company’s market valuation with unrelated technical terminology — and we are actively auditing older programmatic content for similar errors. If you spot a factual problem in any article, please report it using the contact details below; we investigate every report and correct or remove content that doesn’t hold up.
## Corrections Policy
We correct errors of fact promptly once verified. Minor corrections (spelling, formatting, broken links) are fixed without a note. Substantive corrections — incorrect figures, misattributed statements, or factual errors that change the meaning of an article — are corrected in the text with a dated correction note at the bottom of the piece. Articles found to be fundamentally inaccurate or nonsensical are removed rather than corrected.
## Advertising & Editorial Independence
Daily Finance accepts advertising and sponsored content. Sponsored and contributed content is clearly labeled as such, and advertisers have no influence over our independent market coverage or editorial decisions. Nothing on this site constitutes financial or investment advice.
## Contact
To report a factual error or ask about our editorial standards, contact us via our [Contact page](https://df.media/contact-us/).
---
### [Live Market Updates](https://df.media/live-updates/)
**Published:** February 17, 2026
**Author:** Vishnu Priya
**Content:**
## Market Summary
## Current Stock Prices and Performance

### AAPL / $145.30
Apple Inc. – A technology giant with consistent growth.
### GOOGL / $2730.75
Alphabet Inc. – Leader in search and digital advertising.
### MSFT / $299.85
Microsoft Corp. – A strong player in software and cloud services.
### AMZN / $3450.00
Amazon.com Inc. – Dominant in e-commerce and cloud computing.
### NFLX / $505.67
Netflix Inc. – Pioneering streaming entertainment worldwide.
### TSLA / $730.00
Tesla Inc. – Innovator in electric vehicles and renewable energy.
---
### [Contact Us](https://df.media/contact-us/)
**Published:** October 30, 2022
**Author:** Daily Finance
**Content:**
[Daily Finance (Df Media)](https://df.media/) is one of the **Leading Global Finance News** for investment, crypto and fintech magazines, and is owned by the Fair Media Group.
Daily Finance is an online magazine that focuses on finance, investments, cryptocurrency, fintech and blockchain. Other important topics like business, economics and politics also have a central position on our platforms, because it supports the main focus of Daily Finance.
Feel free to contact us using the below contact details.
## **Email**:
<editor@df.media.com>
## **Address**:
```
Daily Finance (Fair Media Group)
460 King Street, STE 200
Charleston, SC 29403
United States
```
---
### [About Us](https://df.media/about-us/)
**Published:** October 30, 2022
**Author:** Daily Finance
**Content:**
**[Daily Finance](https://df.media/)** is one of the leading and most trusted **global finance news** and magazine platform delivering independent, data-driven reporting on markets, investments, cryptocurrency, fintech and blockchain.
As part of [The Fair Media Group](https://www.thefairmedia.com/), we publish trusted financial news, expert analysis and global market insights designed to help readers understand economic trends, evaluate risks and make informed decisions in a rapidly evolving financial world.
Daily Finance is an online magazine that focuses on finance, investments, cryptocurrency, fintech and blockchain. Other important topics like business, economics and politics also have a central position on our platforms, because it supports the main focus of Daily Finance.
Daily Finance intends to give the reader deep insights on these topics from the global financial markets that can be a base of inspiration and information that potentially can help the reader to make informed investment decisions. However Daily Finance does not take any responsibility for any loses or gains that any reader have made from any information shared on any of Daily Finance’s website pages and social media accounts. We urge the reader to make his or her investment decisions based on a broadly informed basis and with a critical approach to all information.
Daily Finance aims to provide independent analysis and research and all our experts and other contributors are picked because of their focus on independency from any biased agenda or influence. They are all true to a fact based approach and obligated to objectivity otherwise informed the reader.
Some of our day-to-day markets coverage is drafted with the assistance of AI research tools, given the volume and pace of financial news, and is reviewed against our fact-based standard before and after publication. Full detail on our sourcing, use of AI, and corrections process is available on our [Editorial Policy](https://df.media/editorial-policy/) page.
Feel free to contact us using the below contact details.
## **Email**:
<editor@df.media>
## **Address**:
```
Daily Finance (Fair Media Group)
460 King Street, STE 200
Charleston, SC 29403
United States
```
---
### [Daily Finance News](https://df.media/daily-finance-news/)
**Published:** September 26, 2024
**Author:** Daily Finance
**Content:**
---
### [Privacy Policy](https://df.media/privacy-policy/)
**Published:** July 14, 2023
**Author:** Daily Finance
**Content:**
[ DF Media ( DAILY FINANCE)](https://df.media/) (“we,” “our,” or “us”) is a global financial news platform owned by **Fair Media**. We provide news, analysis, and insights on finance, crypto, business, partnerships, and wealth management. Protecting your privacy is our priority. This page explains how we collect, use, and manage your information.
**Information We Collect**
- **Personal Information:** Name, email, or other details provided when subscribing to newsletters, submitting PR content, guest posts, or contacting us.
**Non-Personal Information:** IP address, browser type, OS, device type, usage data from cookies, analytics, ads, pages visited, time spent, click-throughs, newsletter engagement.Who we are
Daily Finance is one of the fastest growing online finance, investment, crypto and fintech magazines, and is owned by the Fair Media Group.
Daily Finance is an online magazine that focuses on finance, investments, cryptocurrency, fintech and blockchain. Other important topics like business, economics and politics also have a central position on our platforms, because it supports the main focus of Daily Finance.
Feel free to contact us using [editor@df.media](mailto:nat@df.media)
## Comments
When visitors leave comments on the site we collect the data shown in the comments form, and also the visitor’s IP address and browser user agent string to help spam detection.
An anonymized string created from your email address (also called a hash) may be provided to the Gravatar service to see if you are using it. The Gravatar service privacy policy is available here: https://automattic.com/privacy/. After approval of your comment, your profile picture is visible to the public in the context of your comment.
## Media
If you upload images to the website, you should avoid uploading images with embedded location data (EXIF GPS) included. Visitors to the website can download and extract any location data from images on the website.
## Cookies
If you leave a comment on our site you may opt-in to saving your name, email address and website in cookies. These are for your convenience so that you do not have to fill in your details again when you leave another comment. These cookies will last for one year.
If you visit our login page, we will set a temporary cookie to determine if your browser accepts cookies. This cookie contains no personal data and is discarded when you close your browser.
When you log in, we will also set up several cookies to save your login information and your screen display choices. Login cookies last for two days, and screen options cookies last for a year. If you select “Remember Me”, your login will persist for two weeks. If you log out of your account, the login cookies will be removed.
If you edit or publish an article, an additional cookie will be saved in your browser. This cookie includes no personal data and simply indicates the post ID of the article you just edited. It expires after 1 day.
## Embedded content from other websites
Articles on this site may include embedded content (e.g. videos, images, articles, etc.). Embedded content from other websites behaves in the exact same way as if the visitor has visited the other website.
These websites may collect data about you, use cookies, embed additional third-party tracking, and monitor your interaction with that embedded content, including tracking your interaction with the embedded content if you have an account and are logged in to that website.
## Who we share your data with
If you request a password reset, your IP address will be included in the reset email.
## How long we retain your data
If you leave a comment, the comment and its metadata are retained indefinitely. This is so we can recognize and approve any follow-up comments automatically instead of holding them in a moderation queue.
For users that register on our website (if any), we also store the personal information they provide in their user profile. All users can see, edit, or delete their personal information at any time (except they cannot change their username). Website administrators can also see and edit that information.
## What rights you have over your data
If you have an account on this site, or have left comments, you can request to receive an exported file of the personal data we hold about you, including any data you have provided to us. You can also request that we erase any personal data we hold about you. This does not include any data we are obliged to keep for administrative, legal, or security purposes.
## Where your data is sent
Visitor comments may be checked through an automated spam detection service. We will never share or sell your personal information to anyone.
**How We Use Your Information**
- Deliver and improve services and website.
- Manage client or contributor content (press releases, guest posts).
- Send newsletters, updates, or promotional content (with consent).
- Analyze site traffic and improve user experience.
- Comply with legal obligations.
**Advertising, Sponsored Content & Affiliate Links**
- Ads powered by Google AdSense or partners. Users can manage ad settings via Google.
- Affiliate links may generate revenue for DF.Media at no extra cost.
- PR or client content may include links; transparency is ensured.
**Cookies & Tracking**
- Cookies and analytics track website performance and newsletter engagement.
- Users can disable cookies, but some features may not work.
**Newsletter Subscriptions**
- Optional; requires consent.
- Emails may include updates, financial insights, partner promotions, sponsored content.
- Unsubscribe anytime via the email link.
**Media / Photo Submissions**
- Users may submit content (images, videos) for articles or promotions.
- Submission grants DF.Media and Fair Media a **non-exclusive, worldwide, royalty-free license** to use and promote the content.
**Third-Party Links & Partner Sites**
- DF.Media may link to external websites, including Fair Media network platforms.
- Not responsible for external content, privacy practices, or policies.
**Security Measures**
- Encryption and secure servers protect your data.
- No method is 100% secure; absolute security cannot be guaranteed.
**Children’s Privacy**
- DF.Media does not knowingly collect information from children under 13.
- Any data collected from children will be promptly deleted.
**Global Compliance**
- GDPR, CCPA, and other applicable global regulations.
- Users can access, correct, or request deletion of personal data.
- Opt out of marketing communications anytime.
**Policy Updates**
- Privacy Policy updates will be posted with the revised effective date.
**Contact** 📧 editor@df.media.com
[Terms and Conditions](https://df.media/terms-and-conditions/) \| © 2025 DF Media \| Part of Fair Media \|Contact: editor@df.media.com\|All Rights Reserved
---
### [Contact](https://df.media/contact-2/)
**Published:** July 25, 2023
**Author:** Daily Finance
**Content:**
Feel free to contact us using the below contact details.
**Email**: [editor@df.media](mailto:Admin@df.media)
## **Address**
```
Daily Finance (Fair Media Group)
460 King Street, STE 200
Charleston, SC 29403
United States
```
---
### [My account](https://df.media/my-account/)
**Published:** July 25, 2023
**Author:** Daily Finance
**Content:**
\[woocommerce\_my\_account\]
---
### [Latest](https://df.media/latest/)
**Published:** November 3, 2022
**Author:** Daily Finance
**Content:**
## About Us
In time of ancient gods, warlords and kings, a land in turmoil cried out for a hero. She was Xena, a mighty princess forged in the heat of battle. The power. The passion. The danger. Her courage will change the world.
[ Facebook-f ](#) [ Twitter ](#) [ Instagram ](#) [ Tiktok ](#) [ Youtube ](#)
## Featured
## Authors
---
### [Terms And Conditions](https://df.media/terms-and-conditions/)
**Published:** October 17, 2025
**Author:** Daily Finance
**Content:**
**Acceptance of Terms
By accessing DF.Media, you agree to these Terms of Use. DF.Media is owned by **Fair Media**, and all content, media, and services are subject to these terms.
**Use of Content**
- For informational purposes only; not financial or legal advice.
- Copying, distribution, or modification without permission is prohibited.
**Newsletter & Subscriptions**
- Provide accurate information for subscription.
- Newsletters may include sponsored content and partner promotions.
- Unsubscribe anytime.
**User Conduct
Users must not:
- Post malicious, harmful, or illegal content.
- Violate intellectual property or privacy rights of others.
- Misuse media submission forms or newsletters
**Media / Photo Submissions**
- Submitted content can be used by DF.Media and Fair Media for promotion.
- Users grant a **worldwide, royalty-free license** to display and distribute content.
**Links to Third-Party Sites**
- DF.Media may link to external websites, including Fair Media’s network.
- DF.Media is not liable for third-party content or practices.
**Intellectual Property & Copyrights**
- All content, graphics, media, and articles are owned by DF.Media or Fair Media.
- Unauthorized use, reproduction, or redistribution is prohibited.
**Limitation of Liability**
- DF.Media is not responsible for damages from website use or reliance on content.
- Accuracy, timeliness, and completeness of information are not guaranteed.
**Modifications & Termination**
- DF.Media may modify, suspend, or terminate services at any time.
- Newsletter services may be discontinued with notice.
**Indemnity**
- Users agree to indemnify DF.Media and Fair Media for claims arising from website use, media submissions, or newsletters.
**Changes to Terms**
- Terms updates will be posted with the revised effective date.
**Governing Law**
- Terms governed by applicable laws where DF.Media operates.
- Disputes follow relevant legal frameworks.
**Contact** 📧 editor@df.media.com
[Privacy Policy](https://df.media/privacy-policy/)\| © 2025 DFMedia \| Part of Fair Media \| Contact: editor@df.media.com\| All Rights Reserved
---
## MailPoet Page
### [MailPoet Page](https://df.media/?mailpoet_page=subscriptions)
**Published:** November 6, 2025
**Author:** Daily Finance
**Content:**
\[mailpoet\_page\]
---
### [MailPoet Page](https://df.media/?mailpoet_page=captcha)
**Published:** November 6, 2025
**Author:** Daily Finance
**Content:**
\[mailpoet\_page\]
---
## Categories
### [Banking](https://df.media/category/finance/banking/)
---
### [FinTech](https://df.media/category/global-business-news/fintech/)
**Description:** Stay informed on digital banking, blockchain, AI in finance, and other FinTech innovations shaping modern financial services
---
### [Finance](https://df.media/category/finance/)
---
### [Business](https://df.media/category/global-business-news/)
---
### [Science](https://df.media/category/global-business-news/science/)
---
### [Cryptocurrency](https://df.media/category/cryptocurrency-bitcoin-ethereum-blockchain/)
---
### [Investing](https://df.media/category/finance/investing/)
---
### [Global News](https://df.media/category/global-news/)
---
### [Concordium (CCD)](https://df.media/category/cryptocurrency-bitcoin-ethereum-blockchain/ccd/)
---
### [Bitcoin (BTC)](https://df.media/category/cryptocurrency-bitcoin-ethereum-blockchain/bitcoin/)
---
### [Ethereum (ETH)](https://df.media/category/cryptocurrency-bitcoin-ethereum-blockchain/eth/)
---
### [Capital Markets](https://df.media/category/finance/capital-markets/)
---
### [Consulting](https://df.media/category/global-business-news/consulting/)
---
### [oil](https://df.media/category/oil/)
---
## Tags
### [Divorce](https://df.media/tag/divorce/)
---
### [ChildSupport](https://df.media/tag/childsupport/)
---
### [FinancialFuture](https://df.media/tag/financialfuture/)
---
### [Landlord](https://df.media/tag/landlord/)
---
### [PropertyMaintenance](https://df.media/tag/propertymaintenance/)
---
### [EnergyEfficiency](https://df.media/tag/energyefficiency/)
---
### [Tracking](https://df.media/tag/tracking/)
---
### [Fuel Card](https://df.media/tag/fuel-card/)
---
### [Accounting](https://df.media/tag/accounting/)
---
### [Telegram](https://df.media/tag/telegram/)
---
### [Investor Protection](https://df.media/tag/investor-protection/)
---
### [Crypto Scam](https://df.media/tag/crypto-scam/)
---
### [Bitcoin](https://df.media/tag/bitcoin/)
---
### [Crypto Safety](https://df.media/tag/crypto-safety/)
---
### [Online Fraud](https://df.media/tag/online-fraud/)
---
### [Astocytes](https://df.media/tag/astocytes/)
---
### [hidden brain activity](https://df.media/tag/hidden-brain-activity/)
---
### [finance](https://df.media/tag/finance/)
---
### [investment](https://df.media/tag/investment/)
---
### [crypto](https://df.media/tag/crypto/)
---
### [elon musk](https://df.media/tag/elon-musk/)
---
### [neuralink chip](https://df.media/tag/neuralink-chip/)
---
### [CHINA](https://df.media/tag/china/)
---
### [China’s Big Fund III](https://df.media/tag/chinas-big-fund-iii/)
---
### [business](https://df.media/tag/business/)
---
### [Performing Arts](https://df.media/tag/performing-arts/)
---
### [Japan trade deal 2025](https://df.media/tag/japan-trade-deal-2025/)
---
### [japan](https://df.media/tag/japan/)
---
### [us](https://df.media/tag/us/)
---
### [microsoft](https://df.media/tag/microsoft/)
---
### [tariff](https://df.media/tag/tariff/)
---
### [digital gold initiative](https://df.media/tag/digital-gold-initiative/)
---
### [U.S. Dollar](https://df.media/tag/u-s-dollar/)
---
### [Stablecoins](https://df.media/tag/stablecoins/)
---
### [Consortium](https://df.media/tag/consortium/)
---
### [Emerging Markets](https://df.media/tag/emerging-markets/)
---
### [securities](https://df.media/tag/securities/)
---
### [ETFs](https://df.media/tag/etfs/)
---
### [Ratecut](https://df.media/tag/ratecut/)
---
### [forex](https://df.media/tag/forex/)
---
### [trends](https://df.media/tag/trends/)
---
### [Credit Card](https://df.media/tag/credit-card/)
---
### [debt](https://df.media/tag/debt/)
---
### [Gold Price](https://df.media/tag/gold-price/)
---
### [gold tax](https://df.media/tag/gold-tax/)
---
### [gold tax policy](https://df.media/tag/gold-tax-policy/)
---
### [Market Rally](https://df.media/tag/market-rally/)
---
### [ai](https://df.media/tag/ai/)
---
### [fund](https://df.media/tag/fund/)
---
### [Q3 Results](https://df.media/tag/q3-results/)
---
### [NVIDIA](https://df.media/tag/nvidia/)
---
### [Travel Ban](https://df.media/tag/travel-ban/)
---
### [AI BUBBLE](https://df.media/tag/ai-bubble/)
---
### [G20](https://df.media/tag/g20/)
---
### [De-Dollarization](https://df.media/tag/de-dollarization/)
---
### [Crypto Market](https://df.media/tag/crypto-market/)
---
### [Crypto Markets](https://df.media/tag/crypto-markets/)
---
### [Global Tariff](https://df.media/tag/global-tariff/)
---
### [china trade](https://df.media/tag/china-trade/)
---
### [trade](https://df.media/tag/trade/)
---
### [DOLLAR](https://df.media/tag/dollar/)
---
### [CURRENCY](https://df.media/tag/currency/)
---
### [Dollar slides](https://df.media/tag/dollar-slides/)
---
### [Fed outlook](https://df.media/tag/fed-outlook/)
---
### [Swiss franc surge](https://df.media/tag/swiss-franc-surge/)
---
### [currency market news](https://df.media/tag/currency-market-news/)
---
### [forex analysis](https://df.media/tag/forex-analysis/)
---
### [central bank decisions](https://df.media/tag/central-bank-decisions/)
---
### [Tech Selloff](https://df.media/tag/tech-selloff/)
---
### [Federal Reserve](https://df.media/tag/federal-reserve/)
---
### [Global Debt](https://df.media/tag/global-debt/)
---
### [Sensex](https://df.media/tag/sensex/)
---
### [Global Finance](https://df.media/tag/global-finance/)
---
### [Silver](https://df.media/tag/silver/)
---
### [December 2025](https://df.media/tag/december-2025/)
---
### [Markets](https://df.media/tag/markets/)
---
### [Broadcom](https://df.media/tag/broadcom/)
---
### [QE](https://df.media/tag/qe/)
---
### [RBI](https://df.media/tag/rbi/)
---
### [Fed](https://df.media/tag/fed/)
---
### [ethereum](https://df.media/tag/ethereum/)
---
### [tokenised money](https://df.media/tag/tokenised-money/)
---
### [JPMorgan](https://df.media/tag/jpmorgan/)
---
### [FCA Rules](https://df.media/tag/fca-rules/)
---
### [UK Crypto Regulation 2025](https://df.media/tag/uk-crypto-regulation-2025/)
---
### [Global Markets](https://df.media/tag/global-markets/)
---
### [bitcoin price](https://df.media/tag/bitcoin-price/)
---
### [US China oil war](https://df.media/tag/us-china-oil-war/)
---
### [oil geopolitics](https://df.media/tag/oil-geopolitics/)
---
### [global energy markets](https://df.media/tag/global-energy-markets/)
---
### [Venezuela oil crisis](https://df.media/tag/venezuela-oil-crisis/)
---
### [US energy policy](https://df.media/tag/us-energy-policy/)
---
### [crude oil exports](https://df.media/tag/crude-oil-exports/)
---
### [China oil imports](https://df.media/tag/china-oil-imports/)
---
### [Venezuelan oil exports](https://df.media/tag/venezuelan-oil-exports/)
---
### [global oil supply](https://df.media/tag/global-oil-supply/)
---
### [macroeconomic risk](https://df.media/tag/macroeconomic-risk/)
---
### [geopolitical risk](https://df.media/tag/geopolitical-risk/)
---
### [energy security](https://df.media/tag/energy-security/)
---
### [oil market volatility](https://df.media/tag/oil-market-volatility/)
---
### [global finance news](https://df.media/tag/global-finance-news/)
---
### [international trade tensions](https://df.media/tag/international-trade-tensions/)
---
### [energy sector analysis](https://df.media/tag/energy-sector-analysis/)
---
### [commodities market](https://df.media/tag/commodities-market/)
---
### [oil price impact](https://df.media/tag/oil-price-impact/)
---
### [strategic resources](https://df.media/tag/strategic-resources/)
---
### [gold price 2026](https://df.media/tag/gold-price-2026/)
---
### [SILVER PRICE](https://df.media/tag/silver-price/)
---
### [IMF](https://df.media/tag/imf/)
---
### [INFLATION](https://df.media/tag/inflation/)
---
### [India–U.S. Trade Deal 2026: 18% Tariff Cut](https://df.media/tag/india-u-s-trade-deal-2026-18-tariff-cut/)
---
### [Business Impact](https://df.media/tag/business-impact/)
---
### [Goods](https://df.media/tag/goods/)
---
### [Altruist Hazel AI Tax Tool](https://df.media/tag/altruist-hazel-ai-tax-tool/)
---
### [Altruist Hazel AI](https://df.media/tag/altruist-hazel-ai/)
---
### [alphabet](https://df.media/tag/alphabet/)
---
### [google](https://df.media/tag/google/)
---
### [100-Year Bond](https://df.media/tag/100-year-bond/)
---
### [AI Debt Surge](https://df.media/tag/ai-debt-surge/)
---
### [ai impact summit](https://df.media/tag/ai-impact-summit/)
---
### [ai funding](https://df.media/tag/ai-funding/)
---
### [US Stocks](https://df.media/tag/us-stocks/)
---
### [oil price](https://df.media/tag/oil-price/)
---
### [Iran War](https://df.media/tag/iran-war/)
---
### [Finance News Today](https://df.media/tag/finance-news-today/)
---
### [Algreen Capital](https://df.media/tag/algreen-capital/)
---
### [iBig](https://df.media/tag/ibig/)
---
### [ESG investing](https://df.media/tag/esg-investing/)
---
### [impact investing](https://df.media/tag/impact-investing/)
---
### [family office](https://df.media/tag/family-office/)
---
### [Jonathan Algreen](https://df.media/tag/jonathan-algreen/)
---
### [sustainable investing](https://df.media/tag/sustainable-investing/)
---
### [US Iran talks](https://df.media/tag/us-iran-talks/)
---
### [oil prices](https://df.media/tag/oil-prices/)
---
### [Brent crude](https://df.media/tag/brent-crude/)
---
### [Strait of Hormuz](https://df.media/tag/strait-of-hormuz/)
---
### [Iran nuclear deal](https://df.media/tag/iran-nuclear-deal/)
---
### [oil price crash](https://df.media/tag/oil-price-crash/)
---
### [global markets 2026](https://df.media/tag/global-markets-2026/)
---
### [dollar index](https://df.media/tag/dollar-index/)
---
### [OPEC](https://df.media/tag/opec/)
---
### [markets today June 24](https://df.media/tag/markets-today-june-24/)
---
### [Nasdaq selloff](https://df.media/tag/nasdaq-selloff/)
---
### [AI stocks](https://df.media/tag/ai-stocks/)
---
### [Micron earnings](https://df.media/tag/micron-earnings/)
---
### [Fed stress test 2026](https://df.media/tag/fed-stress-test-2026/)
---
### [gold price today](https://df.media/tag/gold-price-today/)
---
### [Alphabet GOOGL](https://df.media/tag/alphabet-googl/)
---
### [stock market today](https://df.media/tag/stock-market-today/)
---
### [AI selloff](https://df.media/tag/ai-selloff/)
---
### [markets today June 25](https://df.media/tag/markets-today-june-25/)
---
### [chip stocks](https://df.media/tag/chip-stocks/)
---
### [AI rally](https://df.media/tag/ai-rally/)
---
### [Fed rate hike](https://df.media/tag/fed-rate-hike/)
---
### [Nasdaq surge](https://df.media/tag/nasdaq-surge/)
---
### [Bitcoin options expiry](https://df.media/tag/bitcoin-options-expiry/)
---
### [dollar 13-month high](https://df.media/tag/dollar-13-month-high/)
---
### [Iraq OPEC](https://df.media/tag/iraq-opec/)
---
### [SpaceX](https://df.media/tag/spacex/)
---
### [Morgan Stanley](https://df.media/tag/morgan-stanley/)
---
### [Global Stocks](https://df.media/tag/global-stocks/)
---
### [Amazon](https://df.media/tag/amazon/)
---
### [Stock Market](https://df.media/tag/stock-market/)
---
### [Nasdaq](https://df.media/tag/nasdaq/)
---
### [Bank of Japan](https://df.media/tag/bank-of-japan/)
---
### [Japanese Yen](https://df.media/tag/japanese-yen/)
---
### [Global Economy](https://df.media/tag/global-economy/)
---
### [Financial Markets](https://df.media/tag/financial-markets/)
---
### [Investing](https://df.media/tag/investing/)
---
### [Technology Stocks](https://df.media/tag/technology-stocks/)
---
### [Wall Street](https://df.media/tag/wall-street/)
---
### [European Markets](https://df.media/tag/european-markets/)
---